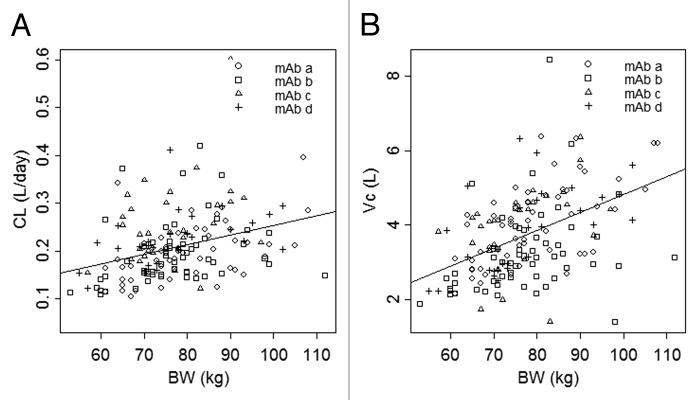
Figure 4. Clearance (A) and central volume of distribution (B) vs. body weight. The symbols represent individual maximum a posteriori Bayesian estimates of clearance (A) and central volume of distribution (B) for each mAb. The line represents the least squares regression of body weight and population average clearance (A) or central volume of distribution (B).
