

Abstract
Aim
This article reports the effects of three evidence-based interventions of varying intensity, each designed to improve outcomes of hospitalized cognitively impaired older adults.
Patients & methods
In this comparative effectiveness study, 202 older adults with cognitive impairment (assessed within 24 h of index hospitalization) were enrolled at one of three hospitals within an academic health system. Each hospital was randomly assigned one of the following interventions: Augmented Standard Care (ASC; lower dose: n = 65), Resource Nurse Care (RNC; medium dose: n = 71) or the Transitional Care Model (TCM; higher dose: n = 66). Since randomization at the patient level was not feasible due to potential contamination, generalized boosted modeling that estimated multigroup propensity score weights was used to balance baseline patient characteristics between groups. Analyses compared the three groups on time with first rehospitalization or death, the number and days of all-cause rehospitalizations per patient and functional status through 6-month postindex hospitalization.
Results
In total, 25% of the ASC group were rehospitalized or died by day 33 compared with day 58 for the RNC group versus day 83 for the TCM group. The largest differences between the three groups on time to rehospitalization or death were observed early in the Kaplan–Meier curve (at 30 days: ASC = 22% vs RNC = 19% vs TCM = 9%). The TCM group also demonstrated lower mean rehospitalization rates per patient compared with the RNC (p < 0.001) and ASC groups (p = 0.06) at 30 days. At 90-day postindex hospitalization, the TCM group continued to demonstrate lower mean rehospitalization rates per patient only when compared with the ASC group (p = 0.02). No significant group differences in functional status were observed.
Conclusion
Findings suggest that the TCM intervention, compared with interventions of lower intensity, has the potential to decrease costly resource use outcomes in the immediate postindex hospitalization period among cognitively impaired older adults.
Keywords: cognitive impairment, functional status, rehospitalizations, transitional care
Cognitive impairment complicates the care of an estimated 20–43% of older adults hospitalized in the USA and adds substantially to total annual healthcare costs [1–6]. Approximately 60% of hospitalized patients identified as having cognitive impairment have no prior history of dementia [7]. Whether cognitive impairment is due to a neurodegenerative disease (e.g., Alzheimer's disease) [8], an acute multifactorial syndrome (e.g., delirium) [4] or a progressive chronic condition (e.g., heart failure) [9], the resulting distur bances in memory, orientation and behavior create a set of unique patient needs and exacerbate the burden of episodes of acute illness for patients, their family caregivers and healthcare clinicians [1].
Acutely ill cognitively impaired older adults are especially vulnerable to systems of care that too often ignore their unique needs [7,10–12]. Unrecognized or poorly managed cognitive deficits commonly trigger a cascade of costly, adverse clinical events [13] during and following hospitalizations, including increased rates of falls, functional decline, incontinence, malnutrition, rehospitalizations, nursing home admissions and mortality [2–5,7,14–19]. While available evidence offers a few solutions, particularly in the detection and management of delirium risk during hospitalizations [20–22], the nature and intensity of interventions needed to enhance posthospital outcomes of this vulnerable population are not known.
Hospital-based strategies that have demonstrated promise include: systematic assessment and reporting of older adults’ cognitive findings to health team members [23] and use of hospital resource nurses with special preparation in the clinical management of this high-risk group [21,24]. The Transitional Care Model (TCM), an approach that spans hospital to home, has consistently demonstrated reduced rehospitalizations and improvements in experience of care and health outcomes for cognitively intact older adults [25–27]. However, the TCM has not been tested among cognitively impaired older adults, nor has the model been compared with other evidence-based approaches. This comparative effectiveness clinical trial tested the following hypothesis: compared with interventions limited to hospital settings, a hospital to home intervention based on the TCM would decrease avoidable rehospitalizations and improve or maintain the functional status of hospitalized cognitively impaired older adults through 6 months after the initial (heretofore ‘index’) hospital discharge (NCT00294307) [28]. This article reports primary patient outcomes observed on the first 202 patients enrolled in this National Institute of Aging (R01-AG023116) and Marian S Ware Alzheimer Program funded clinical trial [29].
Patients & methods
Study design
In this prospective comparative effectiveness study, one of three interventions of varying intensity was randomly assigned to one of three hospitals within a single health system, enabling cross-site comparisons [30]. Random assignment at the patient level was not possible due to potential within-site contamination. For example, one intervention utilized advanced practice nurses (APNs) while another relied upon registered nurses (RNs) without master's degrees; this latter group of nurses were often deployed to multiple units throughout the hospital. Thus, the potential existed that APNs and RNs implementing two of the interventions being compared could have directly or indirectly influenced the care of the same patients during their hospitalizations (see the ‘Interventions’ section). To assure comparable groups, generalized boosted modeling was used to create multigroup propensity score (PS) weights (see the ‘Statistical analyses’ section) [31].
Participant screening & recruitment
Trained research assistants (RAs), bachelor's prepared nurses or social workers, reviewed the medical records of all patients 65 years and older admitted to the participating hospitals to determine basic eligibility. Potentially eligible patients included hospitalized, community-dwelling older adults (≥65 years) who planned to return home, lived within 30 miles of admitting hospital, spoke English and had a family caregiver willing to enroll in the study. All eligible patients also had to demonstrate evidence of cognitive impairment during their index hospitalization assessed by the RAs via abstracting documented diagnoses of dementia from medical records or in-person screening of deficits in orientation, recall or executive function. The goal of the screening was not to diagnose a cognitive disorder but rather to identify cognitive deficits that could influence a patient's ability to manage healthcare needs following the transition to the community. Patients with a diagnosis of dementia who met all criteria were eligible to enroll with no additional assessment. For all other patients, deficits in orientation and recall were identified using the Six-Item Screener (patients with two or more errors, scores ≤4 were eligible) [32]. Patients with fewer than two errors on the Six-Item Screener were further assessed for executive function deficits using the CLOX1, clock drawing task [33]. Patients with five or more errors out of 15 possible points on the CLOX1 (scores ≤10) were eligible. Patients receiving hospice services, undergoing treatment for cancer, stroke or end-stage renal disease, or with untreated psychiatric problems were ineligible. Eligible patients and family caregivers were offered the opportunity to enroll in the study immediately after identification of a dementia diagnosis or positive screening for cognitive deficits. Enrolled patients provided assent and family caregivers provided written informed consent to participate in this University of Pennsylvania (PA, USA) Institutional Review Board-approved study. Intervention group assignment was based on index hospitalization site.
Interventions
Throughout the study period, participating hospitals applied similar admission, care and discharge planning procedures. None of the hospitals routinely screened patients for cognitive impairment. All interventions included screening, reporting and documenting cognitive deficits (Augmented Standard Care; ASC). ASC and Resource Nurse Care (RNC) were hospital-based only; the TCM extended from hospital to home. The protocols are summarized below and detailed elsewhere [34].
Augmented Standard Care
Within 24 h of each patient's index hospitalization, cognitive screening was completed by RAs; delirium assessment continued throughout hospitalization. Within 2 h of assessments, RAs verbally communicated enrolled older adults’ cognitive findings to nurses, physicians and social workers assigned to patients and documented findings in patients’ medical records.
Resource Nurse Care
Hospital employed RNs implemented the RNC intervention, which extended from patient enrollment to index hospital discharge. Prior to implementing the intervention, 69 RNs volunteered to complete web-based modules focused on managing and transitioning hospitalized cognitively impaired older adults; modules were developed by the study team in consultation with clinical experts [34]. The RNs who had successfully completed post-test (scores 80% or higher) were considered ‘resources nurses’ (59 out of 69 completed). These resources nurses provided direct care and/or coached other nurses involved in the care of enrolled patients during the hospital stay [35]. Throughout the study, resource nurses also participated in seminars provided by study team members on issues relevant to cognitive impairment.
Transitional Care Model
Master's prepared APNs implemented the TCM intervention, which extended from patient enrollment through an average of 2 months postindex hospital discharge [34]. In addition to the orientation designed for resource nurses, APNs successfully completed TCM-specific web-based modules and individualized clinical experiences. The TCM protocol consisted of hospital and home visits, at least one physician follow-up visit, telephone outreach and 7 days a week availability; the intervention supplemented care of hospitalized patients and substituted for skilled RN home care [34]. Two full time and one part-time APN implemented the TCM protocol.
Outcome variables
Primary rehospitalization outcomes were: time to first rehospitalization or death and total number and days of all-cause rehospitalizations. Time to first rehospitalization or death was measured from date of index hospital discharge to date of event (e.g., rehospitalization or death) or last interview for censored patients. Data on all-cause rehospitalizations were initially reported to RAs during in-person interviews with caregivers and subsequently independently validated using medical records from all rehospitalization sites. If discrepancies between caregivers’ reported rehospitalizations and review of medical records were noted (e.g. differences in dates of service) the medical record data were utilized. Deaths were confirmed through the Social Security Death Index. Number of all-cause rehospitalizations and days rehospitalized per patient were assessed at 30-day increments through 6 months postindex hospital discharge. Rehospitalization rates per patient were calculated per time period using the total number of hospitalizations divided by the total days at risk (e.g., non-hospitalized and alive days) multiplied by time period days. Data on patients’ functional status were collected by RAs via in-person interviews with caregivers at baseline, 2, 6, 12, and 26 weeks postindex hospitalization. Functional status data included basic activities of daily living (BADLs; the patient's ability to conduct self-care) [37] and instrumental activities of daily living (IADLs; the patient's ability to perform higher level activities such as using the telephone, medication management and household chores) [38]. Lower scores on both scales indicate increased functional deficits.
Independent variables
Patients’ and family caregivers’ baseline sociodemo-graphic and psychosocial characteristics, and patients’ clinical characteristics were collected via in-person interviews by RAs and supplemented by chart abstractions (Table 1). Standardized instruments were used to assess cognitive status (Mini-Mental State Examination [MMSE] [39] and Confusion Assessment Method [22]), presence of depressive symptoms (Geriatric Depression Scale [40] if MMSE ≥16 or the Cornell Scale for Depression in Dementia [41] if MMSE <16), and time burden associated with caregiving (subscale of Caregiver Burden Inventory [42]).
Table 1.
Patient and family caregiver nonclinical and clinical characteristics (unweighted; n = 202).
| Variables | ASC (n = 65) | RNC (n = 71) | TCM (n = 66) | p-value |
|---|---|---|---|---|
| Patient variables | ||||
| Male; n (%) | 26 (40.0) | 24 (33.8) | 26 (39.4) | 0.71 |
| Age, M ± SD (range); years | 80.8 ± 6.4 (68–98) | 80.9 ± 6.4 (65–98) | 79.4 ± 6.6 (68–96) | 0.97 |
| White; n (%) | 33 (50.1) | 15 (21.1) | 33 (50.0) | <0.001 |
| Patient lives alone; n (%) | 18 (27.7) | 17 (23.9) | 18 (27.3) | 0.86 |
| Medical history of dementia; n (%) | 14 (21.5) | 20 (28.2) | 8 (12.1) | 0.07 |
| Coexisting conditions, M ± SD (range); n | 5.0 ± 2.3 (1–11) | 4.5 ± 2.6 (0–11) | 5.7 ± 2.5 (1–12) | 0.62 |
| Hospitalizations in prior 6 months, M ± SD (range); n | 0.8 ± 1.1 (0–5) | 0.99 ± 1.3 (0–5) | 1.3 ± 2.4 (0–11) | <0.001 |
| Delirium present; n (%) | 12 (18.5) | 21 (29.6) | 12 (18.2) | 0.15 |
| – Not assessed; n (%) | 2 (3.1) | 3 (4.2) | 0 (0) | |
| Mini Mental State Examination; M ± SD (range) | 22.9 ± 4.8 (9–30) | 20.9 ± 1.2 (4–30) | 21.7 ± 5.9 (2–30) | 0.006 |
| – Unable to complete; n (%) | 2 (3.1) | 4 (5.6) | 0 (0) | |
| Basic activities of daily living; M ± SD (range) | 4.4 ± 1.9 (0–6) | 4.3 ± 2.1 (0–6) | 4.4 ± 1.9 (0–6) | 0.54 |
| Instrumental activities of daily living; M ± SD (range) | 4.8 ± 2.4 (1–8) | 4.2 ± 2.9 (0–8) | 5.3 ± 2.6 (0–8) | 0.26 |
| – Missing; n (%) | 3 (4.6) | 4 (5.6) | 4 (6.1) | |
| Depressive symptoms present; n (%) | 16 (24.6) | 16 (22.5) | 8 (12.1) | 0.25 |
| – Missing; n (%) | 3 (4.6) | 3 (4.2) | 9 (13.6) | |
| Index Hospitalization Diagnosis†; n (%): | ||||
| – Cardiac/pulmonary | 17 (26.2) | 25 (35.2) | 35 (53.0) | 0.005 |
| – Orthopedic/mechanical fall | 18 (27.7) | 14 (19.7) | 4 (6.1) | 0.005 |
| – Neurologic | 7 (10.8) | 10 (14.1) | 10 (15.2) | 0.74 |
| – Gastrointestinal/genitourinary | 12 (18.5) | 11 (15.5) | 7 (10.6) | 0.44 |
| – Endocrine/Metabolic | 11 (16.9) | 11 (15.5) | 10 (15.2) | 0.74 |
| Caregiver variables | ||||
| Male; n (%) | 14 (19.7) | 15 (23.1) | 17 (25.8) | 0.70 |
| Age, M ± SD (range); years | 60.4 ± 12.8 (34–87) | 61.0 ± 14.0 (36–93) | 60.6 ± 12.9 (34–85) | 0.73 |
| – Missing; n (%) | 1 (1.5) | 3 (4.2) | 8 (12.1) | |
| Caregiver Burden Inventory: | 0.22 | |||
| – Time subscale; M ± SD (range) | 8.0 ± 5.9 (0–20) | 7.3 ± 6.9 (0–20) | 7.2 ± 5.5 (0–19) | |
| – Missing; n (%) | 2 (3.1) | 4 (5.6) | 10 (15.2) | |
| Relationship to patient: | 0.58 | |||
| – Spouse | 20 (30.8) | 19 (26.8) | 20 (30.3) | |
| – Adult child | 35 (53.8) | 35 (49.3) | 33 (50.0) | |
| – Other relative/friend/other (e.g., godchild) | 5 (15.4) | 17 (23.9) | 13 (19.7) | |
Percentages may not add to 100 due to rounding.
ASC: Augmented Standard Care; M: Mean; RNC: Resource Nurse Care; SD: Standard deviation; TCM: Transitional Care Model.
Statistical analyses
Descriptive statistics (Table 1) characterize the patients and caregivers studied, including frequencies and percentages for categorical variables, and means, standard deviations, and ranges for continuous variables. Comparisons between the three interventions groups were conducted using χ2 tests, Fisher's exact tests and one-way analysis of variance.
Generalized boosted modeling for estimation of PS weights [31] was used to control for observed confounding factors, balancing baseline patient characteristics between groups, and strengthening causal inferences [43,44]. PSs represent the estimated probabilities of patients receiving the ASC versus RNC versus TCM intervention protocols, conditioned upon the set of observed covariates presented in Table 1. Covariates were selected based on observable characteristics associated with health and resource use among acutely ill older adults identified in prior research [25–27] and cognitive impairment characteristics (e.g., MMSE [39] and Confusion Assessment Method [22]). The success of PS modeling is generally based on whether balance on covariates is achieved and is typically assessed by computing the standardized bias for each covariate [45].
Since the study included older adults with cognitive impairment resulting from multiple causes, three cognitive variables (i.e., diagnoses of dementia and/or delirium and MMSE score) were included in the PS adjustment. Prior to adjustment, group differences in race, number of hospitalizations in prior 6 months, MMSE scores and index hospitalization for cardiac/pulmonary diagnoses or orthopedic/mechanical falls were observed. Following PS-weighted adjustment, bias was significantly reduced for all variables except race and index hospitalization diagnoses of orthopedic/mechanical falls (e.g., standardized bias estimates exceeded 0.20). These covariates were included in all multivariable models to further control for imbalances.
PS-weighted mean outcome estimates were used to graphically describe longitudinal changes [46]. A multivariable analysis of time to first rehospitalization or death using PS-weighted accelerated failure time modeling with a loglogistic distribution was used to examine group differences [47]. This parametric approach was chosen over the commonly used Cox proportional hazards model since the underlying assumption of proportional hazards was not met [48]. Patients alive and remaining free from hospitalization were censored at study completion. Acceleration factors [exp(-β)] for intervention groups were estimated [47]. A PS-weighted Kaplan–Meier curve of the time to first rehospitalization or death was generated [49]; the log rank test was used for to compare the survival curve distributions of the groups [50], and the Wilcoxon (Breslow) test was used to test for statistical differences early in the survival curve [51]. Comparisons of PS-weighted predicted rehospitalization rates were accomplished within the general linear modeling framework. Pair-wise differences in rehospitalization rates were evaluated using post hoc Tukey–Kramer tests. PS-weighted Poisson generalized estimating equations (log link) and linear mixed models relying on an exchangeable covariance matrix were used to model the number of rehospitalizations per patient, as well as log-transformed rehospitalization days per patient and functional status over 6 months [52,53]. PS-weighted Poisson modeling controlled for varying days at risk for rehospitalization over time and accounted for correlation between observations for the same person. The linear time effects within each group aligned well with rehospitalization data. Functional status models fit well with nonlinear quadratic time effects. Estimates of hospital-based intervention group effects, along with their interaction with time, are presented relative to the TCM group. The relative rate for total number of rehospitalizations and the ratio geometric means for total days rehospitalized and function measures were calculated and presented [exp(β)]. To account for missing data (Table 1), imputed means (continuous variables) and modes (categorical variables) were used for PS modeling.
Results
A total of 1923 patients met basic eligibility criteria, of which 7% (125 out of 1923) had a diagnosis of dementia documented in their medical records and the remaining 1798 were screened for cognitive deficits. A total of 50% of patients screened had deficits in orientation, recall or executive function (892 out of 1798). Among the 1017 potentially eligible patients, only 692 (68%) of patients and their family caregivers fully met the inclusion criteria for the study (Figure 1). Of this group, 40% (275 out of 692) enrolled in the study. A total of 19 patients were determined to be ineligible after being consented. In total, 54 patients of the remaining 256 were subsequently lost to attrition (20%) (Figure 1).
Figure 1. Consolidated Standards of Reporting Trials diagram of eligibility, enrollment and attrition from 2006 to 2008.

ASC: Augmented Standard Care; RNC: Resource Nurse Care; TCM: Transitional Care Model.
The final sample included 202 patients, each with an enrolled caregiver. At enrollment, 21% (42 out of 202) had a documented diagnosis of dementia, 41% (83 out of 202) had deficits in orientation and recall and 38% (77 out of 202) had deficits in executive function. A total of 22% of the final sample also screened positive for delirium (45 out of 202) during the index hospitalization. Patients with a diagnosis of dementia were more likely to screen positive for delirium (44% [19 out of 43] vs 15% [23 out of 159] without dementia; p < 0.001). Overall, 4% (eight out of 202) of the sample died within 180 days of index hospital discharge (3% ASC; 5% RNC; 2% TCM, unweighted Fisher's exact test, p = 0.25).
Rehospitalizations
Time to first rehospitalization or death
The TCM group experienced a longer time to first rehospitalization or death than the ASC and RNC groups (25th percentile for ASC: 33 days vs RNC: 58 days vs TCM: 83 days). While the log rank test for overall differences approached significance (p = 0.06), the Wilcoxon (Breslow) test for early differences suggests that this effect was driven by differences between the curves during the 90-day postindex hospital discharge (p = 0.02, see Figure 2 for Kaplan–Meier estimates). Based on 95% CIs, the difference in time to first rehospitalization or death at 30 and 60 days was statistically significant at p ≤ 0.05 for the ASC versus TCM groups (i.e., no interval overlap). Employing similar confidence limits, marginal differences between the RNC and TCM groups at 30 days were observed (i.e., confidence limits met at 14% for the TCM group upper limit and RNC group lower limit). There were no differences between the ASC and RNC groups on time to first rehospitalization or death.
Figure 2. Time to first all-cause rehospitalization or death for three intervention groups using propensity score-weighted Kaplan–Meier curves (n = 202).

ASC: Augmented Standard Care (lowest dose) intervention; RNC: Resource Nurse Care (medium dose) intervention; TCM: Transitional Care Model (highest dose) intervention group.
Findings from the loglogistic accelerated failure time model (Table 2) estimate that progression to rehospitalization or death was accelerated for the ASC group by a factor of 1.75 in comparison to the TCM group ([exp(-β)]:[exp(0.56)] = 1.75; p = 0.05) and a factor of 1.93 for the RNC group compared with the TCM group ([exp(-β)]:[exp(0.66)] = 1.93; p = 0.02).
Table 2.
Adjusted propensity score-weighted multivariable models of rehospitalization and function outcomes over time.
| Outcome | Parameter estimate (95% CI) | p-value |
|---|---|---|
| Time to first rehospitalization or death | ||
| ASC group | −0.56 (−1.10 to −0.01) | 0.05 |
| RNC group | −0.66 (−1.22 to −0.11) | 0.02 |
| TCM (reference) | – | – |
| Rehospitalizations | ||
| ASC group | 0.76 (−0.14–1.66) | 0.10 |
| RNC group | 0.53 (−0.39–1.45) | 0.26 |
| TCM (reference) | – | – |
| Time (weeks) | −0.02 (−0.06–0.02) | 0.32 |
| Interactions: | ||
| Time × ASC | −0.05 (−0.11–0.01) | 0.11 |
| Time × RNC | −0.03 (−0.09–0.03) | 0.37 |
| Days rehospitalized | ||
| ASC group | 1.83 (−0.07–3.74) | 0.06 |
| RNC group | 1.21 (−0.65–3.07) | 0.20 |
| TCM (reference) | – | |
| Time (weeks) | −0.03 (−0.09–0.03) | 0.35 |
| Interactions: | ||
| Time × ASC | −0.10 (−0.19 to −0.002) | 0.05 |
| Time × RNC | −0.05 (−0.15–0.04) | 0.28 |
| Basic activities of daily living | ||
| ASC group | −0.28 (−0.82–0.27) | 0.32 |
| RNC group | −0.33 (−0.88–0.22) | 0.24 |
| TCM (reference) | – | |
| Time (weeks) | 0.03 (0.002–0.05) | 0.03 |
| Interactions: | ||
| Time × ASC | 0.03 (−0.02–0.08) | 0.18 |
| Time × RNC | −0.03 (−0.07–0.01) | 0.19 |
| Time × time | −0.001 (−0.001 to <0.001) | 0.12 |
| Time × time × ASC | −0.001 (−0.001–0.002) | 0.11 |
| Time × time × RNC | 0.001 (−0.001–0.002) | 0.40 |
| Instrumental activities of daily living | ||
| ASC group | −0.53 (−1.37–0.31) | 0.21 |
| RNC group | −0.83 (−1.68–0.03) | 0.06 |
| TCM (reference) | 0.01 (−0.024–0.04) | 0.58 |
| Time (weeks) | −0.02 (−0.08–0.04) | 0.44 |
| Interactions: | ||
| Time × ASC | <0.001 (−0.06–0.05) | 0.88 |
| Time × RNC | <0.001 (−0.001 to <0.001) | 0.39 |
| Time × time | 0.001 (−0.001–0.003) | 0.37 |
| Time × time × ASC | <0.001 (−0.001–0.002) | 0.88 |
| Time × time × RNC | −0.53 (−1.37–0.31) | 0.21 |
Time is measured in weeks for total rehospitalizations, total days rehospitalized and functional status analyses for interpretability.
All models adjusted using propensity score weights and the two variables that did not achieve balance (e.g., race and the diagnosis group – orthopedic/mechanical fall).
ASC: Augmented Standard Care; RNC: Resource Nurse Care; TCM: Transitional Care Model.
Number of all-cause rehospitalizations per patient
At 30-day postindex hospital discharge, the total number of rehospitalizations (unweighted) was highest among the ASC group (15 out of 66) followed by the RNC group (14 out of 71) and lowest among the TCM group (six out of 66). Over time, the TCM group demonstrated consistently fewer rehospitalizations, with the largest differences in the unweighted cumulative data seen through 90 days (Figure 3).
Figure 3. Cumulative percentage of the number of rehospitalizations over time by group.

Demonstrates the cumulative percentage of all-cause rehospitalizations over time for each intervention group using raw data. These are not adjusted using propensity score weighting. Percentages were calculated by dividing the raw cumulative number of all-cause rehospitalizations by the total sample size for each interventions group.
ASC: Augmented Standard Care; RNC: Resource Nurse Care; TCM: Transitional Care Model.
Based on post hoc-weighted pair-wise comparisons over the 0–30-day time period, the TCM group demonstrated lower least square mean rehospitalizations per patient than the RNC (p < 0.001) and ASC groups (p = 0.06) (Supplementary Table 1; see online at www.futuremedicine.com/doi/suppl/10.2217/cer.14.14). In the 0–90-day time period, the TCM group demonstrated significantly lower rehospitalizations per patient estimates than the ASC group (p = 0.02) but not RNC group (p = 0.14). The mean estimated rates per patient through 180 days were 73 versus 77 versus 64% for the ASC versus RNC versus TCM groups, respectively.
While the mean number of rehospitalizations in the TCM group was fairly consistent over time (Figure 4), the ASC and RNC groups demonstrated higher estimates early on with slowing of rehospitalization rates over time although not statistically significantly different. The overall rate for total number of all-cause rehos pitalizations in the ASC group was 2.13-fold that of the TCM group (p = 0.10) and 1.70-times higher in the RNC group versus the TCM group (p = 0.26; ASC vs TCM: [exp(.76)] = 2.13; RNC vs TCM: [exp(.53)] = 1.70; Table 2).
Figure 4. Propensity score-weighted predicted mean number of rehospitalizations per patient over time.
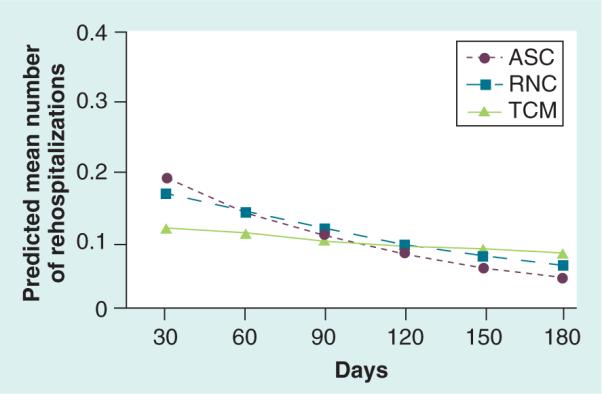
ASC: Augmented Standard Care; RNC: Resource Nurse Care; TCM: Transitional Care Model.
Number of all-cause rehospitalization days per patient
The generalized estimating equation model revealed that the profile for total number of all-cause rehospitalization days for the ASC group was 6.23-times higher than the TCM group (Table 2; [exp(β)]:[exp(1.83)]] = 6.23; p = 0.06) and the RNC group was 3.35-times higher than the TCM group ([exp(β)]:[exp(1.21)] = 3.35; p = 0.20). While the longitudinal profile for all-cause rehospitalization days differed significantly between the ASC and TCM groups (p = 0.05), the profile for RNC and TCM groups was not statistically different over time (p = 0.28). Dose effects were seen in the 0–90-day time period, with the TCM group having a relatively low number of all-cause rehospitalization days through 6 months (Figure 5).
Figure 5. Propensity score-weighted predicted mean number of rehospitalization days per patient over time.
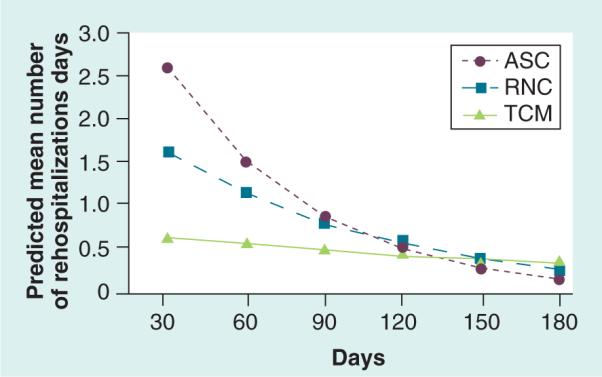
ASC: Augmented Standard Care; RNC: Resource Nurse Care; TCM: Transitional Care Model.
Functional status
There were no statistically significant differences between the intervention groups in mean functional status scores through 26 weeks for BADLs and IADLs (Table 2). Of note, visually the mean BADL and IADL scores were higher (indicating improved function from baseline) in the TCM group than the ASC and RNC groups’ early postindex hospitalization (Figure 6A & B).
Figure 6. Propensity score-weighted mean basic and instrumental activities of daily living score over time.
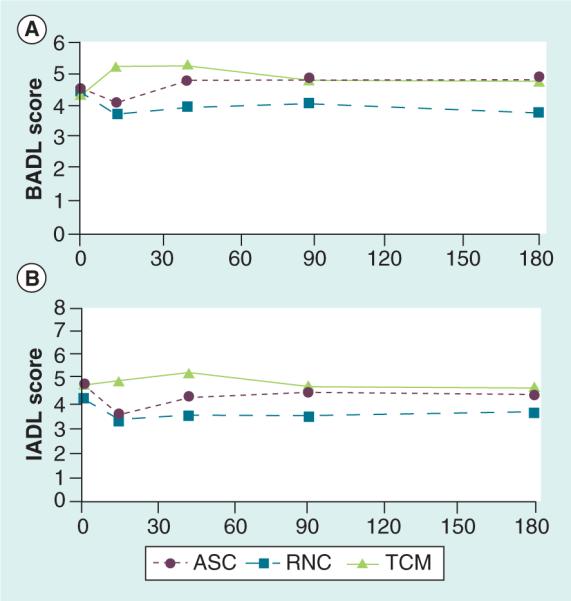
(A) BADL. (B) IADL. Means were adjusted for death and hospital/skilled nursing facility stay and for presentation we subtracted 2 for interpretation of BADL scores ranging 0–6 [35] and IADL scores ranging 0–8 [36]. Higher scores indicate fewer functional deficits.
ASC: Augmented Standard Care; BADL: Basic activities of daily living; IADL: Instrumental activity of daily living; RNC: Resource Nurse Care; TCM: Transitional Care Model.
Discussion
To our knowledge, this is the first reported study comparing the effectiveness of three evidence-based interventions varying in nature and intensity on the postdischarge outcomes of cognitively impaired older adults hospitalized at multiple sites for common medical or surgical conditions. These findings are especially important given the projected growth of the population of older adults coping with multiple chronic conditions complicated by cognitive impairment [8].
When compared with lower-dose hospital-based interventions, the TCM increased time to first rehospitalization or death among enrolled patients (Figure 2). At 30-day postindex hospitalization, the PS -weighted Kaplan–Meier estimates of the proportion of patients who were rehospitalized or died (ASC: 22% vs RNC: 19% vs TCM: 9%) are similar to 30-day postindex hospitalization findings in the most recent RCT of the TCM with cognitively intact older adults (control: 26% vs TCM: 13%) [27]. Thus, findings reinforce that both cognitively intact and impaired high-risk older adults may benefit from interventions more closely aligned with patients’ acute care experiences. In addition, rehospitalization rates and stays during the first 90 days following discharge suggest that cognitively impaired older adults may require a higher intensity care management intervention to assure care continuity among multiple clinicians and across settings.
An important unanswered question generated by study findings is why the effect on costly rehospitalizations of a hospital-to-home intervention (relative to hospital-only strategies and compared with outcomes observed in prior randomized controlled trials of the TCM with cognitively intact older adults) dissipates over time. In our most recently published randomized controlled trial, the TCM had a significant impact on rehospitalization rates for 6 months following the index hospital discharge among cognitively intact older adults [27]. At least one of the contributing factors to the observed shorter term impact is that cognitive impairment further adds to the complexity of care needs for this population and their caregivers. A qualitative review of individualized case studies maintained by APNs for those in the TCM group revealed that this patient group and their family caregivers share common ground with all high risk older adult patients but also confront a distinct set of especially burdensome behavioral health and social issues [54]. In addition, this group of patients is especially challenged when required to follow complex medication and other treatment regimens following discharge that may place them at earlier and increased risk for poor outcomes [2,3,16,18,19].
In addition to examining the impact of inter ventions for a group that consumes a disproportionate share of healthcare resources, a major goal of this study was to assess the effects of interventions of varying intensity on functional status, an outcome that matters a great deal to older adults and their family caregivers [55]. Though trend data suggest early improvements in basic and instrumental ADLs for the TCM compared with other evidence-based intervention groups, no overall group differences in these outcomes were observed at 6 months (Figure 6A & B). Since the launch of this study, knowledge regarding the measurement of functional status changes among older adults with complex chronic conditions has advanced [56]. The instruments used to assess functional status in this study may not have been sensitive enough to detect meaningful changes in the outcome. Ongoing subgroup analyses among those whose function improved, remained the same or declined may further inform our understanding of each intervention's effects on this important health outcome.
Thus, multiple opportunities exist to enhance care of this patient group. One that should be considered for immediate implementation is making cognitive assessment of older adults a standard of care. While this study used a specific set of tools to screen for deficits in orientation [32,33], recall and executive function, there are many similar evidence-based tools that could be incorporated into the patient assessment. In addition, enhanced preparation of all health team members is needed to assure that the issues unique to this population and their caregivers are addressed both during and following hospitalizations [2,3,16,18,19].
Limitations
A number of factors may limit the generalizability of study findings. This study was powered on functional status as primary outcome and, consequently, the final sample was sufficient to detect only large differences in rehospitalization measures. This factor makes observed differences in this latter group of metrics especially noteworthy.
Only 40% of eligible patients enrolled. Screening data suggested no major differences between nonen-rolled and enrolled patients; 12% (compared with 20% of enrollees) had a diagnosis of dementia and 47% (compared with 41% of enrollees) had orientation and/or recall deficits. However, these data do not capture, how knowledge regarding the presence of cognitive deficits may have influenced patients’ and family caregivers’ decisions to participate in this study. While three cognitive variables were used in PS adjustment to achieve balance among enrolled groups, our inability to randomize at the patient level may have resulted in biased intervention estimates resulting from unobservable differences among patients or the quality of services they received.
Every effort was made to assure adherence to intervention protocols. However, while ‘resource nurses’ received the prescribed orientation and successfully completed post-tests, we have limited data to determine if this protocol was consistently applied to patients in this intervention group.
Finally, data comparing rehospitalization rates observed among intervention patients with similar non-intervention patients were available for only selected conditions. Though limited, these data revealed few differences between these groups. Between 2007 and 2011, for example, the mean rehospitalization rate for Medicare beneficiaries admitted to the three hospital sites with major cardiopulmonary diagnoses (primary diagnoses for study sample) was 22% at 30 days [36]; this rate is similar to the raw unweighted 30-day rehospitalization rates for the non-TCM (i.e., ASC and RNC) sites.
Conclusion
When compared with lower intensity evidence-based interventions, a TCM intervention implemented by APNs that spans hospital to home lengthened the time between index hospital discharge and rehospitalization and decreased total all-cause rehospitalizations and days among cognitively impaired older adults in the short-term. Thus, this intervention has the potential to improve outcomes for this vulnerable group of patients while reducing their use of costly health resources.
Future perspective
In recent decades, a number of strategies designed to improve transitions in care among at risk populations have been demonstrated, at least in the short-term, to improve patient outcomes and reduce rehospitalizations when compared with standard care [54]. A priority for future work is to compare such evidence-based transitional care strategies to determine which are more patient and family caregiver centered, effective and efficient overall and among specific subgroups of patients. An important focus for such comparative effectiveness studies will be to identify the core components of the more effective but often multidimensional interventions. Future studies also should compare the impact of hospital only interventions to interventions that included postdischarge phase on variables such as follow-up with primary and specialist care to better understand the contributions of such services. In addition, studies that examine the added value of transitional care to other innovative care approaches such as the Patient-Centered Medical home or Accountable Care Organizations are needed.
Supplementary Material
Executive summary.
The effects of three evidence-based interventions of varying intensity (two hospital-based and one hospital-to-home), each designed to improve outcomes of hospitalized cognitively impaired older adults, were compared.
A total of 202 older adults and their family caregivers were enrolled at three hospitals and assigned to one of three intervention protocols based on index hospitalization site: Augmented Standard Care (ASC; lower dose: n = 65), Resource Nurse Care (RNC; medium dose: n = 71), or the Transitional Care Model (TCM; higher dose: n = 66).
Generalized boosted modeling that estimated propensity score weights was used to create weights to balance baseline patient characteristics between groups.
Analyses compared three groups on time to first rehospitalization or death, number and days of all-cause rehospitalizations, and functional status over a 6-month postindex hospitalization.
In total, 25% of the ASC group were rehospitalized or died by day 33 for the ASC group (lower dose) versus day 58 for the RNC group (medium dose) versus day 83 for the TCM group (higher dose).
The largest differences between the three groups on time to rehospitalization or death were observed early in the Kaplan–Meier curve (at 30 days: ASC = 22% vs RNC = 19% vs TCM = 9%).
The TCM group also demonstrated lower mean rehospitalization rates per patient compared with the RNC (p < 0.001) and ASC groups (p = 0.06) at 30 days.
No significant group differences in functional status were observed.
Findings suggest that the TCM intervention, compared with interventions of lower intensity, has the potential to decrease costly resource use outcomes in the immediate postindex hospitalization period.
Acknowledgments
This work was supported by the National Institute on Aging (grantnumber: R01 AG023116); and the Marian S Ware Alzheimer's Program at the University of Pennsylvania.
Footnotes
Financial & competing interests disclosure
The authors have no other relevant affiliations or financial involvement with any organization or entity with a financial interest in or financial conflict with the subject matter or materials discussed in the manuscript apart from those disclosed.
No writing assistance was utilized in the production of this manuscript.
Ethical conduct of research
The authors state that they have obtained appropriate institutional review board approval or have followed the principles outlined in the Declaration of Helsinki for all human or animal experimental investigations. In addition, for investigations involving human subjects, informed consent has been obtained from the participants involved.
References
Papers of special note have been highlighted as:
• of interest
•• of considerable interest
- 1•.Boustani M, Baker MS, Campbell N, et al. Impact and recognition of cognitive impairment among hospitalized elders. J. Hosp. Med. 2010;5(2):69–75. doi: 10.1002/jhm.589. [Provides background on cognitive impairment among hospitalized older adults in the USA.] [DOI] [PMC free article] [PubMed] [Google Scholar]
- 2.Boyd CM, Landefeld CS, Counsell SR, et al. Recovery of activities of daily living in older adults after hospitalization for acute medical illness. J. Am. Geriatr. Soc. 2008;56(12):2171–2179. doi: 10.1111/j.1532-5415.2008.02023.x. [DOI] [PMC free article] [PubMed] [Google Scholar]
- 3.Bynum JP, Rabins PV, Weller W, Niefeld M, Anderson GF, Wu AW. The relationship between a dementia diagnosis, chronic illness, medicare expenditures, and hospital use. J. Am. Geriatr. Soc. 2004;52(2):187–194. doi: 10.1111/j.1532-5415.2004.52054.x. [DOI] [PubMed] [Google Scholar]
- 4.Inouye SK. Delirium in older persons. N. Engl. J. Med. 2006;354(11):1157–1165. doi: 10.1056/NEJMra052321. [DOI] [PubMed] [Google Scholar]
- 5.Sands LP, Yaffe K, Covinsky K, et al. Cognitive screening predicts magnitude of functional recovery from admission to 3 months after discharge in hospitalized elders. J. Gerontol. A Biol. Sci. Med. Sci. 2003;58(1):37–45. doi: 10.1093/gerona/58.1.m37. [DOI] [PubMed] [Google Scholar]
- 6.Leslie DL, Marcantonio ER, Zhang Y, Leo-Summers L, Inouye SK. One-year health care costs associated with delirium in the elderly population. Arch. Intern. Med. 2008;168(1):27–32. doi: 10.1001/archinternmed.2007.4. [DOI] [PMC free article] [PubMed] [Google Scholar]
- 7.Boustani MA, Campbell NL, Khan BA, et al. Enhancing care for hospitalized older adults with cognitive impairment: a randomized controlled trial. J. Gen. Intern. Med. 2012;27(5):561–567. doi: 10.1007/s11606-012-1994-8. [DOI] [PMC free article] [PubMed] [Google Scholar]
- 8•.Thies W, Bleiler L. Alzheimer's Association. 2013 Alzheimer's disease facts and figures. Alzheimers Dement. 2013;9(2):208–245. doi: 10.1016/j.jalz.2013.02.003. [Provides background on Alzheimer's disease and other dementia in the USA.] [DOI] [PubMed] [Google Scholar]
- 9.Heckman GA, Patterson CJ, Demers C, St Onge J, Turpie ID, McKelvie RS. Heart failure and cognitive impairment: challenges and opportunities. Clin. Interv. Aging. 2007;2(2):209–218. [PMC free article] [PubMed] [Google Scholar]
- 10.Naylor MD, Stephens C, Bowles KH, Bixby MB. Cognitively impaired older adults: from hospital to home. Am. J. Nurs. 2005;105(2):52–61. doi: 10.1097/00000446-200502000-00028. quiz 61–52. [DOI] [PubMed] [Google Scholar]
- 11.Swigart SE, Kishi Y, Thurber S, Kathol RG, Meller WH. Misdiagnosed delirium in patient referrals to a university-based hospital psychiatry department. Psychosomatics. 2008;49(2):104–108. doi: 10.1176/appi.psy.49.2.104. [DOI] [PubMed] [Google Scholar]
- 12.Arora VM, Fish M, Basu A, et al. Relationship between quality of care of hospitalized vulnerable elders and postdischarge mortality. J. Am. Geriatr. Soc. 2010;58(9):1642–1648. doi: 10.1111/j.1532-5415.2010.03024.x. [DOI] [PMC free article] [PubMed] [Google Scholar]
- 13.Thornlow DK, Anderson R, Oddone E. Cascade iatrogenesis: factors leading to the development of adverse events in hospitalized older adults. Int. J. Nurs. Stud. 2009;46(11):1528–1535. doi: 10.1016/j.ijnurstu.2009.06.015. [DOI] [PubMed] [Google Scholar]
- 14.Mitchell SL, Teno JM, Kiely DK, et al. The clinical course of advanced dementia. N. Engl. J. Med. 2009;361(16):1529–1538. doi: 10.1056/NEJMoa0902234. [DOI] [PMC free article] [PubMed] [Google Scholar]
- 15.Rudolph JL, Zanin NM, Jones RN, et al. Hospitalization in community-dwelling persons with Alzheimer's disease: frequency and Causes. J. Am. Geriatr. Soc. 2010;58(8):1542–1548. doi: 10.1111/j.1532-5415.2010.02924.x. [DOI] [PMC free article] [PubMed] [Google Scholar]
- 16.Mecocci P, Von Strauss E, Cherubini A, et al. Cognitive impairment is the major risk factor for development of geriatric syndromes during hospitalization: results from the GIFA study. Dement. Geriatr. Cogn. Disord. 2005;20(4):262–269. doi: 10.1159/000087440. [DOI] [PubMed] [Google Scholar]
- 17.Hitcho EB, Krauss MJ, Birge S, et al. Characteristics and circumstances of falls in a hospital setting: a prospective analysis. J. Gen. Intern. Med. 2004;19(7):732–739. doi: 10.1111/j.1525-1497.2004.30387.x. [DOI] [PMC free article] [PubMed] [Google Scholar]
- 18.Pedone C, Ercolani S, Catani M, et al. Elderly patients with cognitive impairment have a high risk for functional decline during hospitalization: the GIFA study. J. Gerontol. A Biol. Sci. Med. Sci. 2005;60(12):1576–1580. doi: 10.1093/gerona/60.12.1576. [DOI] [PubMed] [Google Scholar]
- 19.Krauss MJ, Evanoff B, Hitcho E, et al. A case–control study of patient, medication, and care-related risk factors for inpatient falls. J. Gen. Intern. Med. 2005;20(2):116–122. doi: 10.1111/j.1525-1497.2005.40171.x. [DOI] [PMC free article] [PubMed] [Google Scholar]
- 20.Fong TG, Tulebaev SR, Inouye SK. Delirium in elderly adults: diagnosis, prevention and treatment. Nat. Rev. Neurol. 2009;5(4):210–220. doi: 10.1038/nrneurol.2009.24. [DOI] [PMC free article] [PubMed] [Google Scholar]
- 21.Inouye SK, Bogardus ST, Jr, Charpentier PA, et al. A multicomponent intervention to prevent delirium in hospitalized older patients. N. Engl. J. Med. 1999;340(9):669–676. doi: 10.1056/NEJM199903043400901. [DOI] [PubMed] [Google Scholar]
- 22.Inouye SK, Van Dyck CH, Alessi CA, Balkin S, Siegal AP, Horwitz RI. Clarifying confusion: the confusion assessment method. A new method for detection of delirium. Ann. Intern. Med. 1990;113(12):941–948. doi: 10.7326/0003-4819-113-12-941. [DOI] [PubMed] [Google Scholar]
- 23.Cole MG. Delirium in elderly patients. Am. J. Geriatr. Psychiatry. 2004;12(1):7–21. [PubMed] [Google Scholar]
- 24.Wanich CK, Sullivan-Marx EM, Gottlieb GL, Johnson JC. Functional status outcomes of a nursing intervention in hospitalized elderly. Image J. Nurs. Sch. 1992;24(3):201–207. doi: 10.1111/j.1547-5069.1992.tb00719.x. [DOI] [PubMed] [Google Scholar]
- 25••.Naylor M, Brooten D, Jones R, Lavizzo-Mourey R, Mezey M, Pauly M. Comprehensive discharge planning for the hospitalized elderly. A randomized clinical trial. Ann. Intern. Med. 1994;120(12):999–1006. doi: 10.7326/0003-4819-120-12-199406150-00005. [Provides background for the Transitional Care Model.] [DOI] [PubMed] [Google Scholar]
- 26••.Naylor MD, Brooten D, Campbell R, et al. Comprehensive discharge planning and home follow-up of hospitalized elders: a randomized clinical trial. JAMA. 1999;281(7):613–620. doi: 10.1001/jama.281.7.613. [Provides background for the Transitional Care Model.] [DOI] [PubMed] [Google Scholar]
- 27••.Naylor MD, Brooten DA, Campbell RL, Maislin G, Mccauley KM, Schwartz JS. Transitional care of older adults hospitalized with heart failure: a randomized, controlled trial. J. Am. Geriatr. Soc. 2004;52(5):675–684. doi: 10.1111/j.1532-5415.2004.52202.x. [Provides background for the Transitional Care Model.] [DOI] [PubMed] [Google Scholar]
- 28.Enhancing Care Coordination: Hospital to Home for Cognitively Impaired Older Adults and Their Caregivers. http://clinicaltrials.gov/ct2/show/NCT00294307.
- 29.Marian S Ware Alzheimer Program. www.med.upenn.edu/cndr/MarianWareAlzProgram.shtml.
- 30••.Naylor MD, Hirschman KB, Bowles KH, Bixby MB, Konick-McMahan J, Stephens C. Care coordination for cognitively impaired older adults and their caregivers. Home Health Care Serv. Q. 2007;26(4):57–78. doi: 10.1300/j027v26n04_05. [Provides background for the Transitional Care Model.] [DOI] [PMC free article] [PubMed] [Google Scholar]
- 31.McCaffrey DF, Griffin BA, Almirall D, Slaughter ME, Ramchand R, Burgette LF. A tutorial on propensity score estimation for multiple treatments using generalized boosted models. Stat. Med. 2013;32(19):3388–3414. doi: 10.1002/sim.5753. [DOI] [PMC free article] [PubMed] [Google Scholar]
- 32.Callahan CM, Unverzagt FW, Hui SL, Perkins AJ, Hendrie HC. Six-item screener to identify cognitive impairment among potential subjects for clinical research. Med. Care. 2002;40(9):771–781. doi: 10.1097/00005650-200209000-00007. [DOI] [PubMed] [Google Scholar]
- 33.Royall DR, Cordes JA, Polk M. CLOX: an executive clock drawing task. J. Neurol. Neurosurg. Psychiatry. 1998;64(5):588–594. doi: 10.1136/jnnp.64.5.588. [DOI] [PMC free article] [PubMed] [Google Scholar]
- 34.Mccauley K, Bradway C, Hirschman KB, Naylor MD. Translating evidence based interventions for acutely ill cognitively impaired older adults: lessons from ‘real-world’ applications. Am. J. Nurs. 2014 doi: 10.1097/01.NAJ.0000454851.22018.5d. (In Press) [DOI] [PMC free article] [PubMed] [Google Scholar]
- 35.Rapp C. Iowa Veterans Affairs Consortium. Evidence-based protocol: acute confusion/delirium. In: Titler M, editor. Series on Evidence-Based Practice for Older Adults. Vol. 41. University of Iowa Gerontological Nursing Interventions Research Center, Research Dissemination Core; IA, USA: 1998. [Google Scholar]
- 36.US Department of Health and Human Services Medicare Hospital Compare. 2012 www.hospitalcompare.hhs.gov.
- 37.Katz S, Akpom CA. Index of ADL. Med. Care. 1976;14(5 Suppl):116–118. doi: 10.1097/00005650-197605001-00018. [DOI] [PubMed] [Google Scholar]
- 38.Lawton MP, Brody EM. Assessment of older people: self-maintaining and instrumental activities of daily living. Gerontologist. 1969;9(3):179–186. [PubMed] [Google Scholar]
- 39.Folstein MF, Folstein SE, Mchugh PR. ‘Mini-mental state’. A practical method for grading the cognitive state of patients for the clinician. J. Psych. Res. 1975;12(3):189–198. doi: 10.1016/0022-3956(75)90026-6. [DOI] [PubMed] [Google Scholar]
- 40.Yesavage JA, Brink TL, Rose TL, et al. Development and validation of a geriatric depression screening scale: a preliminary report. J. Psych. Res. 1983;17(1):37–49. doi: 10.1016/0022-3956(82)90033-4. [DOI] [PubMed] [Google Scholar]
- 41.Alexopoulos GS, Abrams RC, Young RC, Shamoian CA. Cornell scale for depression in dementia. Biol. Psychiatry. 1988;23(3):271–284. doi: 10.1016/0006-3223(88)90038-8. [DOI] [PubMed] [Google Scholar]
- 42.Novak M, Guest C. Application of a multidimensional caregiver burden inventory. Gerontologist. 1989;29(6):798–803. doi: 10.1093/geront/29.6.798. [DOI] [PubMed] [Google Scholar]
- 43.Rosenbaum PR, Rubin DB. The central role of the propensity score in observational studies for causal effects. Biometrika. 1983;70(1):41–55. [Google Scholar]
- 44.Pearl J. Causality: Models, Reasoning, and Inference. Cambridge University Press; 348–351; NY, USA: 2009. Understanding propensity scores. [Google Scholar]
- 45.Austin PC. Balance diagnostics for comparing the distribution of baseline covariates between treatment groups in propensity-score matched samples. Stat. Med. 2009;28(25):3083–3107. doi: 10.1002/sim.3697. [DOI] [PMC free article] [PubMed] [Google Scholar]
- 46.Lunceford JK, Davidian M. Stratification and weighting via the propensity score in estimation of causal treatment effects: a comparative study. Stat. Med. 2004;23(19):2937–2960. doi: 10.1002/sim.1903. [DOI] [PubMed] [Google Scholar]
- 47.Landau S. Survival analysis. In: Melnick EL, Everitt BS, editors. Encyclopedia of Quantitative Risk Analysis and Assessment. John Wiley & Sons; NJ, USA: 2008. pp. 1736–1743. [Google Scholar]
- 48.Cox DR. Regression models and life tables. J. R. Stat. Soc. Series B. 1972;34(2):187–220. [Google Scholar]
- 49.Kaplan EL, Meier P. Nonparametric estimation from incomplete observations. J. Am. Stat. Assoc. 1958;53:457–481. [Google Scholar]
- 50.Peto R, Peto J. Asymptotically efficient rank invariant test procedures. J. R. Stat. Soc. Series A (General) 1972;135(2):185–207. [Google Scholar]
- 51.Kalbfleisch JD, Prentice RL. Statistical Analysis of Failure Time Data. Wiley; NY, USA: 1980. [Google Scholar]
- 52.Long JS. Regression Models for Categorical and Limited Dependent Variables. Sage Publications; CA, USA: 1997. [Google Scholar]
- 53.Laird NM, Ware JH. Random-effects models for longitudinal data. Biometrics. 1982;38(4):963–974. [PubMed] [Google Scholar]
- 54.Bradway C, Trotta R, Bixby MB, et al. A qualitative analysis of an advanced practice nurse-directed Transitional Care Model intervention. Gerontologist. 2012;52(3):394–407. doi: 10.1093/geront/gnr078. [DOI] [PMC free article] [PubMed] [Google Scholar]
- 55.Naylor MD, Hirschman KB, O'Connor M, Barg R, Pauly MV. Engaging older adults in their transitional care: what more needs to be done? J. Comp. Eff. Res. 2013;2(5):457–468. doi: 10.2217/cer.13.58. [DOI] [PubMed] [Google Scholar]
- 56.Working Group on Health Outcomes for Older Persons with Multiple Chronic Conditions. Universal health outcome measures for older persons with multiple chronic conditions. J. Am. Geriatr. Soc. 2012;60(12):2333–2341. doi: 10.1111/j.1532-5415.2012.04240.x. [DOI] [PMC free article] [PubMed] [Google Scholar]
Associated Data
This section collects any data citations, data availability statements, or supplementary materials included in this article.