

Abstract
Mineralization of bone, from the tissue-level to whole bones, is associated with mechanical properties. The relationship between bone tissue mineralization and micromechanical properties may be affected by age, disease, and drug treatment. Patients with severely suppressed bone turnover (SSBT) suffered atypical fractures while on bisphosphonate treatment. The role of tissue-level mineralization in predicting material-level properties of SSBT bone may be different from that of other osteoporotic patients and of normal subjects. The aim of this study was to compare the relationships between mineralization and micromechanical properties of bone biopsies from patients with SSBT, bisphosphonate-naive osteoporotic patients with typical vertebral fracture, and normal young and age-matched subjects. We used nanoindentation and quantitative backscattered electron microscopy to characterize the elastic modulus, contact hardness, plastic deformation resistance, and tissue mineralization of the biopsies at site-matched locations within each biopsy. The linear mineralization-mechanical property relationships were different among the groups with respect to the intercepts for only cortical bone tissue but not the slopes for cortical and trabecular bone tissues. For a given mineral density, there was a trend of greater plastic deformation resistance in SSBT cortical bone compared to young normal bone. Similarly, there was a trend of greater plastic deformation resistance in osteoporotic trabecular bone compared to young normal bone for a given mineral density. The age-matched normal group had higher elastic modulus and a trend of higher contact hardness compared to the young normal group for a given mineral density. However, the mechanical property-mineralization relationships within an individual were weak, and only 21 of 53 biopsies that were analyzed had at least one significant association between mineralization and a mechanical property measurement for either cortical or trabecular bone tissues. The average properties of microstructural regions (deep and superficial remodeling packets in trabecular bone; osteonal and interstitial regions in cortical bone) were consistent with mineral accumulation with tissue age, with the exception of the SSBT group. SSBT trabecular bone deep packets had higher hardness and plastic deformation resistance than superficial packets, but mineralization levels and tissue modulus were not different between packet types. We conclude that relationships between mineral and mechanical properties were different between fracture and normal groups and between young and old normal groups, and that atypical fracture may be associated with changed microstructural material properties and tissue-level mineralization compared to osteoporotic patients with vertebral fracture and normal subjects. We hypothesize that tissue-level bone quality may be an important determinant in fracture risk, such that tissue mineral density may predict different material properties in different patient groups.
Keywords: Bisphosphonate, Atypical fracture, Severely suppressed bone turnover, Mechanical properties, Mineralization, Bone quality
Introduction
Mechanical properties of bone tissue at the microscopic level are important in determining resistance to crack initiation and propagation. Materials with poor resistance to crack propagation are susceptible to catastrophic failures. In bone, cracks can lead to fractures that cause morbidity that result in significant costs to society. Variation in micro-scale properties may be important in resisting crack propagation [1]. Composite structures with alternating layers of compliant and stiff materials, such as the lamellae that compose osteons in cortical bone, have been shown to have crack-stopping properties [2]. Cracks can be trapped within individual layers and prevented from continued growth.
Studies have shown that the mineralization of bone strongly affects the elastic modulus of bone material, from the whole bone level [3] to the microscopic-level [4–6]. Elastic modulus is the resistance to deformation under load and has been found to correlate with strength [7, 8]. Past studies have shown that mineral content correlates with local modulus properties in healthy trabecular [6] and cortical [4, 9] bone samples, though the strengths of the relationships range from weak to strong.
Disease and drug treatment may affect the relationships between bone mineralization and mechanical properties. We found previously that the average micro-scale mechanical properties and mineral densities were different in patients with severely suppressed bone turnover and atypical fractures (SSBT) compared to osteoporotic patients with vertebral fracture and normal subjects [10]. SSBT patients were on bisphosphonate treatment for a minimum of 3 years when they suffered at least one non-vertebral fracture in skeletal sites that are rich in cortical bone, such as the femoral shaft. Histomorphometry of iliac bone biopsies indicated that SSBT patients had suppressed bone turnover. In contrast, the osteoporotic patients had typical vertebral fractures and were not treated with bisphosphonates. Changes in material properties, whether due to aging, suppressed bone turnover, drug treatment, or a combination of these factors, may occur in concert with changes in the mineral component (crystallinity, chemical composition), the organic component (crosslinking, advanced glycation endproducts), or the interaction between the mineral and collagen phases (arrangement of mineral crystals). In this study, we focused on mineralization as a predictor for indentation elastic modulus, contact hardness and plastic deformation resistance of hard tissue, and how these relationships were affected by disease. We hypothesized that the relationships between mineralization and mechanical properties were different among SSBT, osteoporotic, young normal, and age-matched normal groups.
Methods
Samples and specimen preparation
Trans iliac core biopsy specimens (55 total) from SSBT patients with atypical fracture, osteoporotic patients with vertebral fracture, and non-fracture subjects were obtained from biopsy collections at Henry Ford Hospital (HFH; Detroit, MI) and Southwestern Medical Center (SMC; Dallas, TX) (Table 1). The 12 SSBT biopsies were a subset of the 22 patients originally used to define SSBT [11, 12]. All biopsies, but one, were from women, and the detailed bone histomorphometric data have been reported [11, 12]. The majority of the SSBT patients had no evidence of tetracycline labels, however a few patients had a few single labels, from which we imputed bone formation rate (BFR) by assuming a mineral apposition rate of 0.3 micrometers per day as previously reported [13]. SSBT biopsies were compared to biopsies from young normal (YN), age-matched normal (AMN), and age-matched osteoporotic patients with vertebral fracture (OP). The young normal subjects had a lower mean age than the ages of all other groups, which were not different from each other. All biopsies from normal subjects and osteoporotic patients were from a library of biopsies collected at HFH between 1980 and 1992 and were performed by a single operator (DSR). The SSBT biopsies from both the HFH and the SMC were collected between 2001 and 2007. Trabecular BFR per bone surface was measured for all 55 biopsies using standard methods [12, 14] (Table 1). The BFRs measured at trabecular sites were different among groups (p=0.004), and the BFR in the SSBT group was significantly lower than the other three groups, which were not statistically different from each other.
Table 1.
Characteristics of study groups
| Group | N | Laboratory | Osteoporotic | Bisphosphonate | Fracture | Age-matched | Age (years) | Trabecular bone formation rate (BFR) (μm3/μm2/year) | ||
|---|---|---|---|---|---|---|---|---|---|---|
|
| ||||||||||
| Range | Mean (SD) | Range | Mean (SD) | |||||||
| YN | 19* | HFH | N | N | N | N | 20–40 | 31.5a (5.8) | 0–23.3 | 13.1c (6.9) |
| AMN | 11* | HFH | N | N | N | Y | 49–73 | 62.8b (8.2) | 0.6–42.3 | 13.7c (13.8) |
| OP | 11 | HFH | Y | N | lumbar vertebral | Y | 53–76 | 65.5b (7.7) | 0.5–67.1 | 16.7c (19.4) |
| SSBT | 12 | HFH (7), SMC (5) | Y | Y | atypical femur | Y | 49–77 | 64.1b (9.3) | 0–1.00 | 0.3d (0.4) |
YN – Young normal
AMN – Age-matched normal
OP – Osteoporotic
SSBT – Severely suppressed bone turnover
HFH – Henry Ford Hospital, Detroit, MI
SMC – Southwestern Medical Center, Dallas, TX
values that do not share alphabetic superscripts within a column are statistically different (p<0.05)
one YN and one AMN were excluded from the analysis
Biopsies from both laboratories were pre-stained for 72 hours in Villanueva bone stain, and then dehydrated in increasing concentrations of alcohol. Samples were embedded in poly methyl methacrylate (PMMA) blocks for detailed histomorphometric study, following laboratory-specific protocols. The samples at the SMC were embedded in 85% methyl methacrylate, with 15% dibutyl phthalate added as a plastic softener. Perkadox 16 (AzkoNobel, Amsterdam, the Netherlands) was the polymerization initiator. The HFH biopsies were prepared in 100% methyl methacrylate with benzoyl peroxide to initiate polymerization. Embedding may affect the nanoindentation measurements of mechanical properties of the bone tissues [15, 16]. Differences in biopsy preparation between the two laboratories were accounted for in the statistical analysis by the inclusion of a nominal covariate parameter to indicate the laboratory in which a sample was prepared.
Both cortical and trabecular bone tissues were exposed on one block face of each biopsy. As is standard, the biopsies were oriented so that the block face was cut along the axis of the cylindrical biopsy.
The bottom of each biopsy block was milled flat such that the top and bottom faces were parallel. The face with the exposed bone was polished to a mirror finish with successively finer grits of carborundum paper and alumina polishing powders (Buehler Ltd., Lake Bluff, Illinois). The smallest alumina particle size was 0.05 μm.
Nanoindentation
Nanoindentation was used to measure the mechanical properties of the bone tissues (Nanoindenter XP, Agilent Technologies Inc., Oak Ridge, TN). A Berkovich pyramidal diamond tip was pressed into the surfaces of the polished samples, and load and displacement were monitored at high resolution (50 nN and 0.01 nm, respectively). Elastic modulus (E) and contact hardness (Hc) were calculated using the Oliver-Pharr method [17]. In this method, elastic modulus is a function of the unloading stiffness of the force-displacement curve, under the assumption that the unloading is elastic. Contact hardness is calculated as the maximum load divided by the projected area of the indenter tip at maximum load (24.6 μm2 at 1 μm depth). Since elastic and plastic deformations contribute to the deformation at maximum load, contact hardness is derived from both the elastic and plastic properties of the material. To characterize the plastic behavior, resistance to plastic deformation (H) was also calculated using an expression derived by Sakai [18], which has been applied to nanoindentation data of mineralized tissues [19]. Plastic deformation resistance is a function of the elastic modulus and contact hardness from the indentation test and two constant terms associated with the geometry of the indenter tip. The underlying assumptions for this calculation are that the material behavior can be characterized as elastic-plastic and that the elastic and plastic deformations occur in series.
A typical load-displacement curve is shown in Fig. 1. For each test, the indenter approached the surface at10 nm/s. Once the surface was detected, the tip advanced at a target strain rate of 0.05 s−1 to maximum depth of 1 μm such that the indentation impression was visible by scanning electron microscopy. Strain rate is defined as the instantaneous rate of displacement of the indenter tip divided by the displacement at that instant in time [20]. The indenter was held at the maximum load for ten seconds, then unloaded to 10% of the maximum load for a second hold period of 100 seconds to account for thermal drift. Fluctuations in displacement measurements during this hold period were attributed to thermal expansion and contraction of the sample and indenter equipment. These values were recorded and the calculated drift rate was used to correct the displacement measurements taken during the duration of the indentation test, assuming a constant drift rate throughout the indentation test (TestWorks software, Agilent Technologies, Inc., Oak Ridge, TN). Poisson’s ratio of bone was assumed to be 0.30 [21].
Fig. 1.
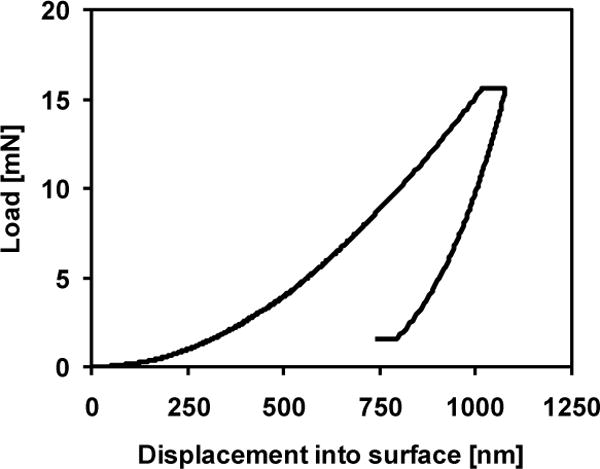
Representative nanoindentation load-displacement curve for 1 μm indent. Berkovich diamond tip loaded into the surface at a target strain rate of 0.05 s−1 to 1 μm depth. Tip was held at maximum load for 10 seconds, unloaded and held at 10% of maximum load for 100 seconds to calculate thermal drift. Elastic modulus and contact hardness were calculated from the unloading portion of the curve.
Two 4 by 5 arrays of indentations were made in each biopsy, one array in cortical bone tissue and the other in trabecular bone tissue, for a total of forty indentations per biopsy. The cortical arrays were positioned at or near osteons, since those regions were most likely to have greater range in properties [22], except when there were many cracks in those areas. Indentations were spaced at 20 μm intervals within the arrays (Fig 2).
Fig. 2.
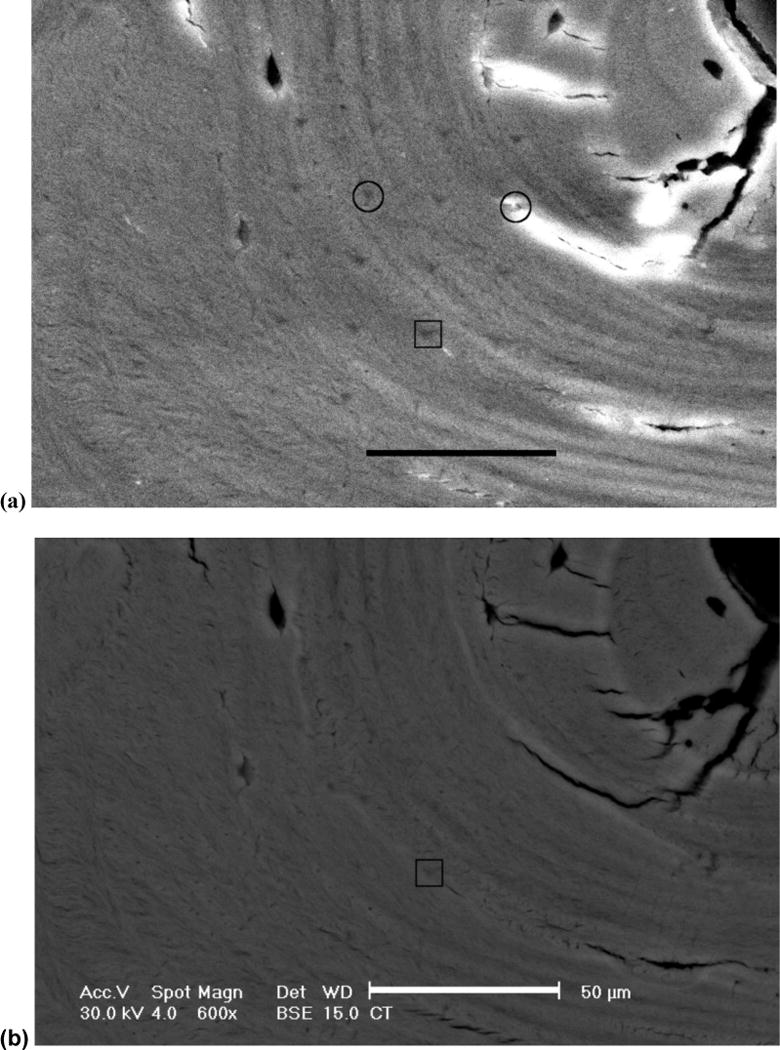
A 4 by 5 array of indents made in a cortical bone region of a biopsy from a young normal subject. Secondary electron images (600×) were captured to identify indent locations (a). Corresponding images were captured in backscattered electron mode for mineralization quantification (b). Circles mark the 2 indents that were discarded from the analysis due to cracks at those locations. Indent marked by the square corresponds with the image analysis example in Fig 3. Scale bar represents 50 μm.
Quantitative backscattered electron microscopy
The bone specimen blocks were imaged at 600× magnification (Fig 2) using a scanning electron microscope (FEI XL 30, FEI, Hillsboro, OR) equipped with a solid-state backscatter detector (FEI, model PW6843/00) at 30-kV excitation voltage and 15 mm working distance. To make the surfaces electrically conductive, each biopsy block was sputter coated with carbon (Edwards 306 Vacuum Coating System, Edwards Ltd., United Kingdom) to approximately 250 Angstroms thickness. Mineral density of bone was quantified by obtaining backscattered electron images of flat specimens, since gray-scale levels in backscattered images correlate with the atomic number and mineral content [23, 24]. The location of each indentation array was first identified in the secondary electron imaging mode, in which the residual impressions of the indentations were visible as triangles (Fig 2a). Once the array location was identified, a reference image was obtained in secondary electron mode, followed by a backscattered electron image at the same location to be used for density quantification (Fig 2b). The field of view was 148 μm by 197 μm, large enough to visualize the indentation impressions in secondary electron mode and to capture each indentation array within a single image.
Mineralization was measured from the backscattered images by converting gray-scale pixel values to atomic number (Z) using a calibration relationship based on standard materials of known average Z: aluminum (Z=13), magnesium oxide (Z=10.412), silicon dioxide (Z=10.805), and calcium carbonate (Z=12.57). Images of the calibration standard materials were taken before and after collecting each bone specimen to account for fluctuations in the system electronics. A calibration relationship was constructed by fitting a linear least squares regression between the gray-scale level measurements and the mean atomic numbers of the standards (ImageJ, National Institutes of Health, Bethesda, MD). Pixel resolution of the images was 0.138 μm. All images were collected by a single operator.
Indentations that were positioned in lacunae, cracks or cement lines were discarded from the analysis. Additionally, indentation regions that exhibited charging artifacts (e.g. near a crack) were also excluded from the analysis. Twelve entire arrays were excluded from the analysis due to substantial cracking in the region of the arrays. The numbers of trabecular and cortical arrays that were removed from each group in the analysis (between 0 and 4) were not statistically different among groups (Chi square test, p>0.24). Two biopsies, one YN and one AMN, were excluded from the study since neither cortical nor trabecular arrays were analyzable due to cracks.
Image processing
Quantitative backscattered electron image pixel intensities can be influenced by the topography of the specimen surface. Thus the residual impressions of indentations were faintly visible as dark triangles in some of the backscatter images (Fig 3a). In order to estimate the mineral density at the location of the indent without the influence of the indent impression, a fitting algorithm based on the mineral data from the region immediately surrounding the indent impression was used. A 24 by 24 pixel (3.3 by 3.3 μm) region, large enough to encompass the indent impression, was cut out from the image at each indent location (Fig 3a). A surrounding region of 50×50 pixels was used to estimate the gray-levels of the excised region using a thin plate cubic spline function (Matlab R2010a, Mathworks, Inc). The mineralization at an indent location was calculated as the average atomic weight of the fitted 24 by 24 pixel region (Fig 3b), which was calculated from the average gray-level of the fitted region and the calibration equation corresponding with the backscattered image. A preliminary validation study was conducted in which regions without indentations were analyzed for mineral density to compare the spline fitting method with direct measurement of mineral density by averaging the gray-scale levels of the pixels of the calibrated image. The two measurements were strongly correlated (R2=0.83 to 0.91) with a slope of 1 +/− 0.04.
Fig. 3.
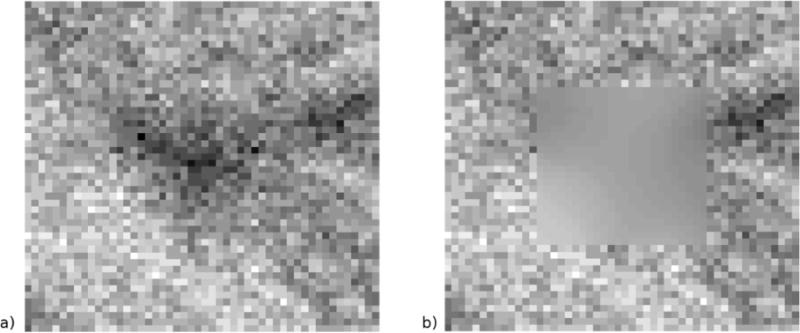
A magnified image of an indent impression from the young normal biopsy array in Fig 2b (a). Each square represents one image pixel of the 50 by 50 pixel image. The triangular indent impression is visible in the backscattered image and influences the measurement of mineral density. To estimate the mineralization at the indent location, a 24 by 24 pixel region encompassing the indent impression is excised, and this region is reconstructed using a thin-plate cubic spline fit to the surrounding 50 by 50 pixel region. The 50 by 50 pixel region with the fitted pixel intensities is shown in (b). The mineralization was calculated from the average gray-level of the fitted 24 by 24 region. Gray-level contrast of these images was enhanced to demonstrate the effect of the fitting algorithm. Pixel resolution is 0.138 μm.
Statistics
Four analyses were conducted to examine the relationships between mineral density and mechanical properties. Separate analyses were conducted on cortical and trabecular tissues. The first analysis examined whether within-biopsy specimen correlations existed between mineral density (Z) and mechanical properties (E, Hc, H) using Pearson correlations. The second analysis compared the Pearson correlation coefficients among groups. Fisher’s Z transformation, a variance-stabilizing transformation that allows for hypothesis testing of correlation coefficients, was applied to the Pearson coefficients, and then ANOVA was performed on the transformed Pearson coefficients. The third analysis compared the effects of mineralization on mechanical properties among groups using repeated-measures ANCOVA, in which the mechanical property outcomes were predicted by mineralization, group, and the interaction term mineralization*group, with laboratory as a nominal covariate and biopsy as a random variable. Pair-wise differences among groups were analyzed post-hoc using Tukey’s HSD test. The fourth analysis examined the effect of microstructural region (osteonal and interstitial regions in cortical bone tissue, and superficial and deep packets in trabecular bone tissue) on mineral density and mechanical properties among the groups using repeated-measures ANOVA. Contrasts were used to compare the trends in properties of the regions within groups. Laboratory was included as a covariate in each of the repeated measures ANOVA models. Statistical significance was p<0.05, except in testing the contrasts, for which the significance level was p<0.0125 after correcting for multiple comparisons (Bonferroni, 4 tests).
Results
Within-biopsy Pearson correlations
Fifty trabecular and 48 cortical arrays from 53 biopsies were analyzed in total. Three correlations for each array (between mineral density and modulus, contact hardness, or plastic deformation resistance) were calculated for a total of 294 correlations. Forty-two of the 294 correlations (14%) were significant. Twenty percent, 18% and 20% of the trabecular arrays had significant correlations between mineral density and modulus, mineral density and contact hardness, and mineral density and plastic deformation, respectively. Only 8.5 to 11% of the cortical arrays had significant correlations between mineral density and modulus, mineral density and contact hardness, or mineral density and plastic deformation (Fig 4). The SSBT and OP groups did not have any significant cortical mineral density-mechanical property relationships. The coefficient of determination (R2) of the significant relationships ranged from 0.24 to 0.76. The coefficients of variation (CV), defined as the standard deviation divided by the mean, for mineral density or mechanical properties within an indentation array were 4 to 11 times greater for mechanical properties than for mineral density data (Table 2).
Fig. 4.
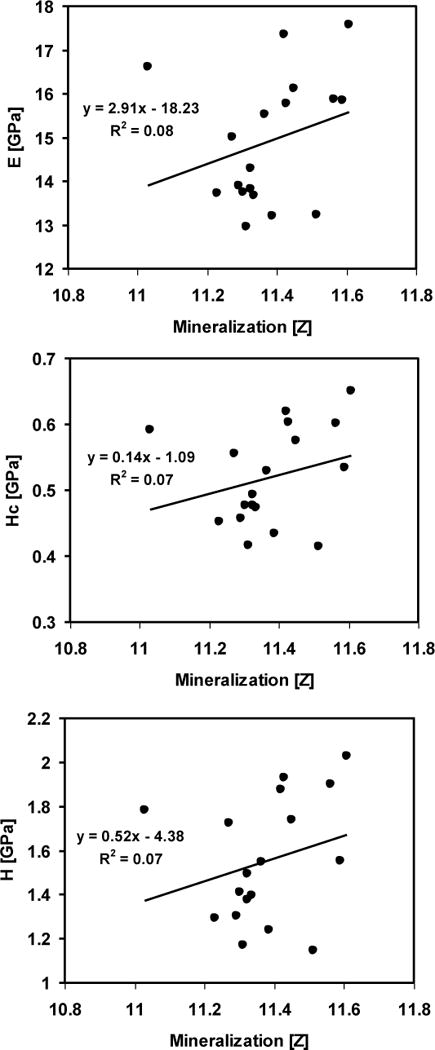
Simple linear regressions between mineralization and elastic modulus (E), contact hardness (Hc), and plastic deformation resistance (H), corresponding with an indentation array in the cortical tissue of a young normal biopsy (Fig 2). All three relationships were not significant (p>0.05).
Table 2.
Coefficients of variation for mineral density (Z), modulus (E), contact hardness (Hc), and plastic deformation resistance (H)
| Z
|
E
|
Hc
|
H
|
||||||
|---|---|---|---|---|---|---|---|---|---|
| Group | N | Range | Mean (SD) | Range | Mean (SD) | Range | Mean (SD) | Range | Mean (SD) |
| YN | 33 | 0.51–5.83 | 2.02 (1.01) | 4.50–13.40 | 8.70 (2.27) | 6.38–20.65 | 13.89 (3.17) | 9.99–27.78 | 19.13 (4.51) |
| AMN | 21 | 0.56–2.95 | 1.68 (0.58) | 2.39–12.82 | 7.04 (2.29) | 4.07–15.33 | 10.79 (3.12) | 5.95–22.34 | 15.08 (4.51) |
| OP | 21 | 0.56–2.60 | 1.63 (0.51) | 3.59–15.34 | 8.16 (3.32) | 5.55–22.86 | 12.13 (4.93) | 7.61–31.86 | 16.40 (6.42) |
| SSBT | 23 | 0.84–2.61 | 1.62 (0.45) | 3.60–20.13 | 7.88 (3.86) | 6.54–19.11 | 12.16 (3.20) | 10.76–25.58 | 17.76 (3.85) |
Group differences in Pearson correlation coefficients relating mineralization to mechanical properties
Pearson correlation coefficients (r) were transformed (Fisher’s Z) such that the variances of the transformed values were approximately equal for all values of correlation coefficients. Cortical and trabecular tissues were analyzed separately for group differences in Pearson coefficients. Groups did not have significantly different mean transformed correlation coefficients for any of the three mechanical property-mineral relationships for either trabecular or cortical bone arrays (p>0.05). All arrays were included in this analysis, including arrays with non-significant correlations.
Group differences in the effects of mineralization on mechanical properties
Trabecular bone and cortical bone arrays were analyzed separately for group differences in linear regression relationships between mineral density and mechanical properties (Table 3). Mineral density was significantly (p<0.05) and positively associated with modulus, contact hardness, and plastic deformation resistance for both trabecular and cortical bone arrays. The slopes of the mineral-mechanical property relationships were not different among groups for either bone tissue type. However the intercepts of the regressions were different among the groups for some of the cortical bone properties. For a given mineral density value, the cortical bone had a trend of higher plastic deformation resistance in SSBT than in YN (p=0.05); for a mineral density of 11.5 Z, the mean mineral density when all of the measurements were pooled, the cortical bone plastic deformation resistance was 10.1% higher in SSBT than YN. The AMN group had 13.6% higher cortical bone modulus than the other three groups (p<0.05 for all comparisons) and a trend of 16.2% higher cortical contact hardness than YN, for a mineral density value of 11.5 Z (p=0.08). For the regressions of trabecular bone properties, the intercepts were not different with the exception of a trend of 18.2% higher plastic deformation resistance in OP compared to YN for a mineral density value of 11.5 Z (p=0.12). Laboratory was a significant covariate in the analyses of mineral density relationships with trabecular bone modulus and plastic deformation resistance. For a given mineral density value, SMC biopsies had lower modulus but higher plastic deformation resistance than HFH biopsies.
Table 3.
ANCOVA table: P-values for explanatory factors in the ANCOVA models for the modulus (E), contact hardness (Hc), and plastic deformation resistance (H), for trabecular and cortical tissues within each biopsy§
| Trabecular tissue
| ||||
|---|---|---|---|---|
| Outcome | Group | Mineral | Group*Mineral | Laboratory |
| E | 1 | <0.01 | 0.50 | 0.03& |
| Hc | 0.13 | <0.01 | 0.29 | 0.70 |
| H | 0.07* | <0.01 | 0.30 | 0.01& |
|
Cortical tissue
| ||||
|---|---|---|---|---|
| Outcome | Group | Mineral | Group*Mineral | Laboratory |
| E | 0.01ˆ | 0.02 | 0.23 | 0.50 |
| Hc | 0.06# | <0.01 | 0.26 | 0.46 |
| H | 0.06† | <0.01 | 0.24 | 0.61 |
Significant effects noted in boldface (p<0.05)
Biopsy was a random variable in the model
OP>YN trend (Tukey HSD, p=0.12)
AMN>YN, OP and SSBT (Tukey HSD, p<0.05)
AMN>YN trend (Tukey HSD, p=0.08)
SSBT>YN (Tukey HSD, p=0.05)
HFH>SMC for E and SMC>HFH for H (Student’s t-test, p<0.05)
Mechanical property differences between microstructural regions
Because the correlations between modulus and mineral densities within individual biopsies were weak and most were statistically nonsignificant, we investigated whether the high variability in the data was in part due to the influence of microstructural regions such as osteons and trabecular packet location, which were not controlled in the study design. Indents were classified as located in osteonal (O) or interstitial (I) cortical regions, or in superficial (S) or deep (D) trabecular packets (Fig 5). Indents in interstitial regions of cortical bone and deep packets of trabecular bone had greater modulus, hardness, and plastic deformation resistance than osteonal and superficial regions, respectively (Region effect, p<0.05, Table 4; Fig 6). Cortical mineral density was not different between osteonal and interstitial regions (p=0.47). However, trabecular mineral density was different between packet types, with deep packets having higher mineralization than superficial packets (p<0.01). The interaction between Region and Group indicated a trend (p=0.07) in differences in regional mineralization among the groups. The post-hoc analysis with contrasts indicated that SSBT trabecular mineral density was not different by packet-type (p=0.31), unlike that of the YN, AMN, and OP groups (p<0.013). A similar trend in the interaction between Region and Group for trabecular modulus was found (p=0.08), with a lack of difference in modulus between packet types in SSBT (p=0.33). Laboratory was again a significant covariate in the analyses of trabecular bone modulus and plastic deformation resistance, in which HFH biopsies had higher modulus and lower plastic deformation resistance than SMC biopsies.
Fig. 5.
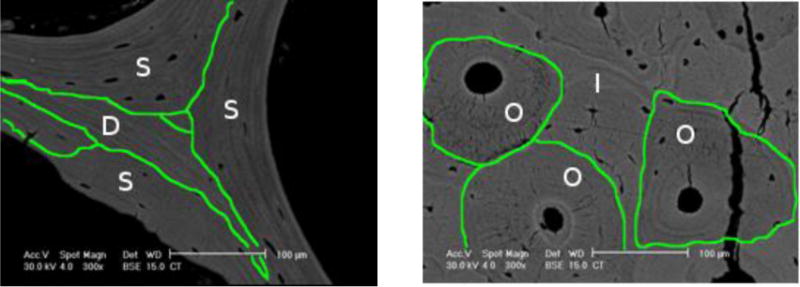
Indentations made in cortical and trabecular bone tissues were classified by region in order to analyze whether regional differences in mean properties were the same among groups. Trabecular bone indents were located in superficial (S) or deep (D) packets, the former were packets that had a portion touching the surface of the trabecula. Cortical bone indents were located in osteonal (O) or interstitial (I) regions. The lines drawn on the backscattered images delineate between regions (300×, scale bar = 100 μm).
Table 4.
ANOVA table: P-values for the effects of region (superficial and deep for trabecular bone tissue, osteonal and interstitial for cortical bone tissue), group, and laboratory in the ANOVA models for the mean modulus (E), contact hardness (Hc), plastic deformation resistance (H), and mineral density (Z) for trabecular and cortical bone tissues§
| Trabecular tissue
| ||||
|---|---|---|---|---|
| Outcome | Group | Region | Group*Region | Laboratory |
| E | 0.81 | <0.01# | 0.08† | 0.01& |
| Hc | 0.09 | <0.01# | 0.20 | 0.51 |
| H | 0.06 | 0.02# | 0.19 | 0.02& |
| Z | 0.05* | <0.01# | 0.07† | 0.44 |
|
Cortical tissue
| ||||
|---|---|---|---|---|
| Outcome | Group | Region | Group*Region | Laboratory |
| E | 0.01ˆ | 0.01# | 0.27 | 0.54 |
| Hc | 0.18 | 0.02# | 0.86 | 0.44 |
| H | 0.18 | 0.04# | 0.08 | 0.51 |
| Z | 0.23 | 0.47 | 0.23 | 0.26 |
Significant effects noted in boldface (p<0.05)
Biopsy was a random variable in the model
SSBT>OP trend (Tukey HSD, p=0.07)
AMN>YN, OP, and SSBT (Tukey HSD, p<0.05)
D>S for trabecular and I>O for cortical (Student’s t-test, p<0.05)
D>S for YN, AMN, OP (Contrasts, Student’s t-test, p<0.0125) but not for SSBT (p>0.0125)
HFHgt;SMC for E and SMC>HFH for H (Student’s t-test, p<0.05)
Fig 6.
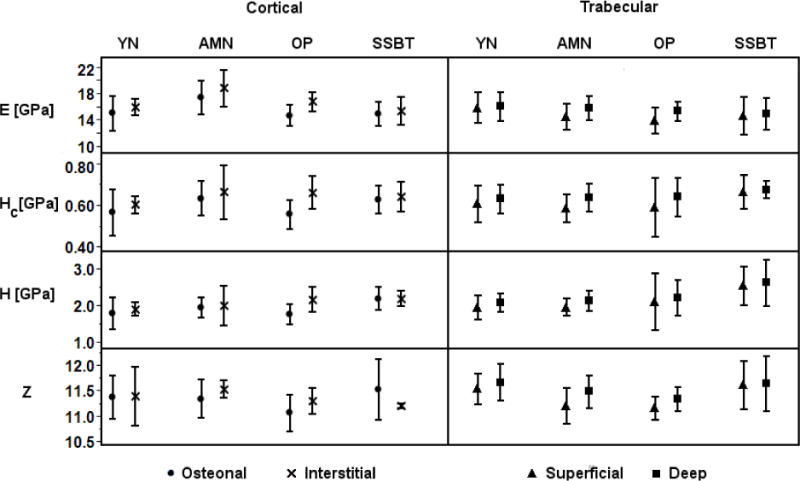
Average modulus (E), contact hardness (Hc), plastic deformation resistance (H), and mineralization (Z) of each region (osteonal, interstitial; superficial, deep) for each biopsy plotted by group. E, Hc, and H were greater in interstitial regions compared to osteonal regions, and greater in deep packets compared to superficial packets (ANOVA, Region effect p<0.05; Table 4). Cortical mineral density was not different by region. Trabecular mineral density was greater in deep packets compared to superficial packets, except in SSBT (ANOVA, Region*Group interaction p=0.07; Table 4). Error bars indicate plus or minus one standard deviation. YN=young normal, AMN=age-matched normal, OP=osteoporotic, SSBT=severely suppressed bone turnover.
Since the study was not originally designed to detect microstructural differences in properties, the number of indents in each region was not evenly distributed. Only seven of the 48 cortical arrays contained both osteonal and interstitial indents, and of those, 6 arrays had only one indent in one region and the remainder in the other region. Thirty three of the cortical arrays contained only osteonal indents, and 8 of the cortical arrays contained only interstitial indents. Thirty five of the 50 trabecular arrays contained indents spanning both superficial and deep packets; 13 arrays contained only deep packet indents, and 2 arrays contained only superficial indents.
Discussion
We were primarily interested in determining whether SSBT, osteoporotic, age-matched normal and young normal groups had different mechanical property-mineral density relationships. While the slopes of the regression lines were not different among the groups, there were differences in the mechanical property-mineral density regression intercepts, indicating that for a given mineral density, there were some differences in the mean mechanical property values among the groups. Interestingly, there were some differences between the fracture groups (SSBT and OP) compared to the normal groups in the plastic deformation resistance-mineral density relationships. The SSBT group had a trend of higher cortical plastic deformation resistance, while the osteoporotic group had a trend of higher trabecular plastic deformation resistance, than the young normal group for a given mineral density. These results suggest that there may be changes in the bone tissue such that for a given mineral density, the local resistance to plastic deformation is higher in fracture groups than non-fracture groups. One possible scenario is that the organic matrix is different in the osteoporotic bone compared to the young normal bone, such that the bone tissue experiences less permanent deformation in the osteoporotic groups compared to the young normal group, though the mineral densities may be the same. Plastic deformation resistance is a “true hardness” material parameter [25] that isolates the permanent component of the deformation from the elastic deformation, similar to the hardness measurements calculated from micrometer-scale indenter tests that are calculated from the surface area of the deformed region. Hard materials are more likely to crack near the location of an indentation test compared to soft materials that may plastically deform [26]. Therefore the greater plastic deformation resistance observed in the fracture groups indicates greater brittle material-level behavior, since brittle materials do not deform plastically. The greater brittleness in SSBT and OP bone for a given mineral density may indicate a greater tendency for spontaneous crack propagation and thus brittle fracture. Moreover the finding that relationships between mineral density and plastic deformation resistance are important in cortical bone for SSBT and in trabecular bone for OP may be associated with the atypical fracture type in the former and the typical vertebral fracture type in the latter. The cortical bone modulus was also lower in the two fracture groups than in the age-matched normal group for a given mineral density, which suggests that osteoporosis is associated with changes in the tissue-level properties that are independent of age.
There were also some differences between the young and age-matched normal groups in the relationships between mechanical properties and mineral densities. The AMN group had higher cortical modulus and a trend of higher contact hardness than the YN group for a given mineral density. Therefore age-related changes in the bone matrix may change the relationship between the mineral density and tissue elastic properties.
When the arrays were analyzed individually, there was a large number of weak or non-significant associations between mineral density and mechanical properties. Only 21 of 53 biopsies had at least one significant association between mineralization and a mechanical property measurement for either the cortical or trabecular region. This may have contributed to the lack of differences in the strengths of the mineral-mechanical property correlations among groups. On the other hand, the weak associations were consistent with the findings of a recent study [9], in which the mineralization of the cortical bone of the trochanter explained less than 30% of the variation in tissue elastic properties in half of the samples analyzed. The lower coefficient of variation in mineral density data within a region of interest compared to that of the mechanical property data was also observed [9].
At least two factors may have contributed to the small number of significant relationships between mineralization and mechanical properties that were detected in this study: small variation in tissue age and the limited number of indents made per sample. Tissue age has been shown to be a strong predictor of local mechanical properties and mineral-to-matrix ratio [22, 27, 28]. Some studies that showed strong correlations between mechanical property and mineral density were designed to sample regions of various tissue ages, and in some cases, measurements in regions of similar age were averaged (e.g. within packets [6] or within specific ranges of measured osteonal tissue age [22, 29]). The ranges of values of mineralization and mechanical properties, which are largely determined by tissue age, also affect the strength of correlations.
Associations between properties that are from a large range of values are more likely to have strong relationships than associations between properties in which the range of possible values is narrow. For example, by indenting the entire trabecula, superficial and deep packets are measured so the range in mineralization values has a wide span, resulting in correlations that are more likely to reach significance. In the present study, when the ranges of mineral densities of biopsies with significant trabecular modulus-mineral relationships are compared to those with nonsignificant relationships, there was a trend of wider range in mineral densities in those with significant relationships (p=0.06). Another notable difference in the present study compared to others that found mostly significant relationships within individuals is the total number of measurements made per sample. For example, Fratzl-Zelman [30] reported significant correlations of r=0.24 to 0.49 in 8 of 10 individuals when sampling about 100 indents over the thickness of the femoral neck cortex. With a greater number of samples made per biopsy, the likelihood of finding significant relationships is greater for a given correlation coefficient. In contrast, we sampled 20 measurements per biopsy, thus only moderate to strong relationships would be detected as significant. (The critical correlation coefficient value above which a relationship would be significant was r=0.44, if all 20 measurements were valid.) We designed our study to see if small regions of bone had moderate or strong relationships between mechanical properties and mineral densities across many patient samples, thus we made fewer indents per sample. We would expect to find a greater number of significant relationships if we increased the number of measurements per array or controlled for tissue age.
The weak relationships between mineral density and mechanical properties may also be due to features of the bone at the lamellar and sub-lamellar levels that are not explained by mineral density, such as collagen orientation, collagen crosslinking, and mineral crystallinity. The widely accepted model for collagen within lamellae suggests that neighboring lamellae have different fiber orientations [31]. These variations in collagen orientation may be important in determining the mechanical properties at the lamellar level, in contrast to longer length scales such as the osteonal level. At the osteonal level, significant relationships have been consistently observed between mineral density and mechanical properties [32]. The concentration of non-enzymatic collagen crosslinks has been negatively associated with failure load and work to fracture in whole bone [33], while collagen maturity, a measurement of enzymatic crosslinks, has been positively associated with plastic deformation resistance in osteons [32]. The spatial variation in collagen maturity is different in bone from osteoporotic fracture patients compared to normal bone [34]. The mineral crystallinity, as measured by Fourier transform infrared imaging (FTIR), may also influence the nanomechanical properties [35]. Therefore the weak relationships found in the current study and others [9] may indicate that the mechanical properties at the lamellar level are influenced by factors other than mineral density alone.
The relative mechanical properties of microstructural regions within cortical and trabecular bone tissues were consistent with other studies that have demonstrated high mineral density, modulus and hardness in interstitial bone compared to osteonal bone [29], and in deep packets compared to superficial packets [6, 36]. Interestingly this pattern was not observed in the mineral densities and moduli of the trabecular regions of SSBT biopsies— deep and superficial packets did not differ in atomic weight or moduli. In OP, AMN, and YN biopsies, deep packets had higher modulus, contact hardness, and plastic deformation resistance, which corresponded with higher mineral density, compared to superficial packets. However, deep packets in SSBT were harder and had higher plastic deformation resistance compared to superficial packets, whereas mineral density and modulus were not different by packet location (Fig 6). Deep packets have greater tissue age compared to superficial packets, since the remodeling process occurs at trabecular surfaces. Greater tissue age is associated with harder and stiffer properties [6, 22], which was confirmed in our measurements, except in SSBT trabecular bone modulus. Also, there was not an accompanying increase in mineral density of deep packets in SSBT as was found in the other groups, suggesting that the non-mineral component of the tissue may contribute significantly to the differences in contact hardness and plastic deformation resistance of the regions. Tissue age-related changes in tissue properties resulting from the extreme suppression of turnover may cause the tissue age of both deep and superficial packets to be “older” than those in individuals with normal turnover. Normal bone is mineralized in two phases—primary mineralization, during which 70% of the mineral content is accumulated rapidly over a few days, followed by secondary mineralization, during which the mineral content increases gradually as tissue reaches a maximum saturated level. In individuals with suppressed bone turnover, the difference in mineral density between superficial and deep regions decreases until it is undetectable despite differences in tissue age, due to unremodeled tissue and saturation of the mineralization curve. This may affect the ability for the SSBT bone tissue to resist crack propagation across trabecular packets. Characterization of the organic components, such as collagen crosslinks, of packet regions of SSBT patients would be needed in order to test whether changes in the organic matrix contribute to the observed differences in mechanical properties of the SSBT group.
We note that our study was not designed to detect region differences in mechanical properties and mineral densities. Since array locations were not selected with respect to region, 85% (41/48) of the cortical arrays did not span both cortical and interstitial regions within the array area. Similarly 30% (15/50) of trabecular arrays did not span both superficial and deep packets. Therefore we cannot conclude whether the differences detected between regions are consistent within each biopsy or are due to overall differences in mean properties among biopsies (e.g. indents in interstitial regions happened to be from biopsies that had overall high mean properties). Qualitative observation of the data (Fig 6) suggests that there could be other features of SSBT region properties that were undetected in our study due to lack of statistical power. For example, cortical bone mineral density and plastic deformation resistance appear to be greater in interstitial regions than in osteonal regions for YN, AMN, and OP groups but not in the SSBT group, a pattern that is similar to that of the trabecular bone mineral density among these groups.
We used an indirect method to quantify the mineralization at the indentation locations using image processing methods. By using the mineralization data surrounding the indentation impression, the influence of the indent impression on the mineralization measurements was eliminated. As a result we were able to capture high magnification images for mineral quantification, at which the impressions were more easily visible. Additionally, by imaging the biopsies after nanoindentation, the exact locations of the indents were identified and image registration was avoided. However, this method produced an approximation of the mineralization measurement since we used the region directly surrounding the indent impression to obtain a fitted measurement of the mineral density at the indent location. The excised region of about 3.3 μm square was on the scale of the width of lamellae (5 to 7 μm). In images with pronounced lamellation, a cutout region that encompassed the width of a single lamella (or half a lamella) might yield an erroneous approximation for the actual gray level within that region. For example, if the cutout region were positioned at a high intensity peak of a lamella, the spline fit could underestimate the actual intensity.
Dehydrated, processed, and embedded bone samples have the obvious limitation that the conditions of the specimens are not the same as the in vivo tissue condition. Nanomechanical properties of dehydrated bone have been demonstrated to be greater than that of hydrated specimens [37], and embedded bone has been shown to have greater nanomechanical properties than unembedded specimens [15]. However, the samples in the present study were processed using the same methods (Villanueva stain, dehydration with ethanol), thus the comparisons of relative mechanical properties are relevant. The PMMA embedding methods were different, and the significant Laboratory covariate in some of the statistical analyses suggests that the embedding, or another unknown difference in sample processing between the laboratories, may be important in the mechanical property measurements.
The age of the biopsies may influence the nanoindentation measurements since the embedding material properties can change over time [16]. The present study utilized a collection of biopsies obtained from a library amassed over a span of more than 3 decades. For the biopsies prepared by HFH (N=50), the age of the biopsy correlated with the embedding modulus and with the average bone modulus [10], but in opposite directions. Embedding modulus was greater in biopsies that were prepared earlier. On the other hand, recently prepared biopsies (SSBT biopsies) had greater bone modulus than older biopsies. The opposite directions of these age effects contradict a hypothesis that age-stiffened plastic causes an apparent stiffening of the SSBT material since the older samples had the lower average bone tissue moduli and hardnesses but greater embedding modulus. Regardless, the storage time of the biopsies may be important to monitor since there was a significant correlation in the embedding plastic properties over time with this collection of biopsies. In this experiment, the trends in the bone mechanical properties among the groups were not explained by biopsy age, indicating that the observed group differences in mechanical properties were irrespective of, and not due to, the storage effect.
In spite of the limitations of the study, the finding that different patient groups have different mineral-mechanical property relationships suggests that there are bone quality differences at the tissue-level. The mechanical properties at the tissue-level are not directly predicted by the tissue-level mineralization density; particularly, SSBT and osteoporotic patient biopsies have trends of higher plastic deformation resistance than would be predicted by mineralization compared to normal groups. At the whole-bone level, bone quality can be broadly defined as the aspects of bone that contribute to fracture resistance that are independent of bone mineral density (BMD). BMD, while associated with fracture risk, is an imperfect predictor of fracture risk. In this study we show that there are differences in tissue-level mechanical properties that are not completely explained by tissue-level mineral density. We hypothesize that there are tissue-level quality differences that may help to explain differences in fracture susceptibility among patient groups, and that characterization of both mineral density and mechanical properties at the tissue-level, in addition to other factors such as organic matrix components, may be needed to understand tissue quality differences related to fracture.
Conclusion
SSBT, osteoporotic, age-matched normal, and young normal groups have differences in mechanical property-mineral density relationships. Particularly, a mineral density value predicts greater plastic deformation resistances in SSBT cortical bone and in osteoporotic trabecular bone than in young normal bone, which may contribute to greater brittleness in respective bone tissues susceptible to fracture in SSBT and osteoporotic patients. The relationships between elastic properties and mineral densities were different between age-matched and young normal groups for a given mineral density, which may reflect the changes in tissue-level properties with age. However the changes in mechanical property per unit mineral density do not differ among the groups studied. We confirm that the relationships between mineralization and elastic modulus, hardness, and plastic deformation resistance within an individual tend to be weak within small regions of bone tissue. Additionally, the lack of difference in mineral density and modulus between deep and superficial trabecular packets in SSBT biopsies in the presence of differences in the plastic properties suggests that the organic matrix may contribute significantly to the greater contact hardness and plastic deformation resistance of the deep packets, in a manner different from osteoporotic and normal bone tissues. The more uniform mineral density across SSBT trabeculae may also play a role in enhancing crack propagation in the atypical fractures of these patients. Finally, we propose that there are tissue-level bone quality differences that may be important in characterizing the bone tissue of patient groups.
Research Highlights.
Severely suppressed bone turnover (SSBT) patients had atypical fractures while on bisphosphonates.
Relationships between tissue mechanical properties and mineralization of bone biopsies from SSBT, treatment-naïve osteoporotic, and normal groups were compared.
Mechanical property-mineralization relationships differed between fracture and non-fracture groups and between young and old groups.
SSBT trabecular bone mineralization and modulus were not different between superficial and deep remodeling packets, unlike the other groups.
Characteristics of bone tissue other than tissue mineralization may be important in determining bone tissue-level quality and fracture risk.
Acknowledgments
We wish to thank Julie Schoenung and Enrique Lavernia for providing access to and training for the nanoindentation measurement system; Sarah Roeske for providing access to and training for the carbon coating equipment; Patricia Kysar for training and advice on the SEM; Xiang Wang for assistance in developing Matlab scripts; Tyler Franklin for assistance in image processing; Yolanda Hagar for statistics consultation. This study was supported by National Institutes of Health (NIH) grant AR040776 (DPF). Statistical support was made possible by grant UL1 RR024146 from the National Center for Research Resources (NCRR), a component of the NIH, and NIH Roadmap for Medical Research. Its contents are solely the responsibility of the authors and do not necessarily represent the official view of NCRR or NIH.
Abbreviations
- SSBT
severely suppressed bone turnover
- E
elastic modulus
- Hc
contact hardness
- H
plastic deformation resistance
- BFR
bone formation rate
- Z
atomic number
- PMMA
poly(methyl methacrylate)
Footnotes
Publisher's Disclaimer: This is a PDF file of an unedited manuscript that has been accepted for publication. As a service to our customers we are providing this early version of the manuscript. The manuscript will undergo copyediting, typesetting, and review of the resulting proof before it is published in its final citable form. Please note that during the production process errors may be discovered which could affect the content, and all legal disclaimers that apply to the journal pertain.
References
- 1.Gupta HS, Stachewicz U, Wagermaier W, Roschger P, Wagner HD, Fratzl P. Mechanical modulation at the lamellar level in osteonal bone. Journal of Materials Research. 2006;21:1913–1921. [Google Scholar]
- 2.Fratzl P, Gupta HS, Fischer FD, Kolednik O. Hindered crack propagation in materials with periodically varying Young’s modulus – Lessons from biological materials. Advanced Materials. 2007;19:2657–+. [Google Scholar]
- 3.Currey JD. Effects of differences in mineralization on the mechanical properties of bone. Philos Trans R Soc Lond B Biol Sci. 1984;304:509–18. doi: 10.1098/rstb.1984.0042. [DOI] [PubMed] [Google Scholar]
- 4.Donnelly E, Chen DX, Boskey AL, Baker SP, van der Meulen MC. Contribution of mineral to bone structural behavior and tissue mechanical properties. Calcif Tissue Int. 2010;87:450–60. doi: 10.1007/s00223-010-9404-x. [DOI] [PMC free article] [PubMed] [Google Scholar]
- 5.Oyen ML, Ferguson VL, Bembey AK, Bushby AJ, Boyde A. Composite bounds on the elastic modulus of bone. J Biomech. 2008;41:2585–8. doi: 10.1016/j.jbiomech.2008.05.018. [DOI] [PubMed] [Google Scholar]
- 6.Smith LJ, Schirer JP, Fazzalari NL. The role of mineral content in determining the micromechanical properties of discrete trabecular bone remodeling packets. J Biomech. 2010;43:3144–9. doi: 10.1016/j.jbiomech.2010.07.038. [DOI] [PubMed] [Google Scholar]
- 7.Currey JD, Brear K. Hardness, Young Modulus and Yield Stress in Mammalian Mineralized Tissues. Journal of Materials Science-Materials in Medicine. 1990;1:14–20. [Google Scholar]
- 8.Hou FJ, Lang SM, Hoshaw SJ, Reimann DA, Fyhrie DP. Human vertebral body apparent and hard tissue stiffness. J Biomech. 1998;31:1009–15. doi: 10.1016/s0021-9290(98)00110-9. [DOI] [PubMed] [Google Scholar]
- 9.Zebaze RMD, Jones AC, Pandy MG, Knackstedt MA, Seeman E. Differences in the degree of bone tissue mineralization account for little of the differences in tissue elastic properties. Bone. 2011;48:1246–1251. doi: 10.1016/j.bone.2011.02.023. [DOI] [PubMed] [Google Scholar]
- 10.Tjhia CK, Odvina CV, Rao DS, Stover SM, Wang X, Fyhrie DP. Mechanical property and tissue mineral density differences among severely suppressed bone turnover (SSBT) patients, osteoporotic patients, and normal subjects. Bone. 2011;49:1279–89. doi: 10.1016/j.bone.2011.09.042. [DOI] [PMC free article] [PubMed] [Google Scholar]
- 11.Odvina CV, Levy S, Rao S, Zerwekh JE, Sudhaker Rao D. Unusual mid-shaft fractures during long term bisphosphonate therapy. Clin Endocrinol (Oxf) 2010;72:161–8. doi: 10.1111/j.1365-2265.2009.03581.x. [DOI] [PubMed] [Google Scholar]
- 12.Odvina CV, Zerwekh JE, Rao DS, Maalouf N, Gottschalk FA, Pak CY. Severely suppressed bone turnover: a potential complication of alendronate therapy. J Clin Endocrinol Metab. 2005;90:1294–301. doi: 10.1210/jc.2004-0952. [DOI] [PubMed] [Google Scholar]
- 13.Foldes J, Shih MS, Parfitt AM. Frequency distributions of tetracycline-based measurements: implications for the interpretation of bone formation indices in the absence of double-labeled surfaces. J Bone Miner Res. 1990;5:1063–7. doi: 10.1002/jbmr.5650051010. [DOI] [PubMed] [Google Scholar]
- 14.Parfitt AM, Drezner MK, Glorieux FH, Kanis JA, Malluche H, Meunier PJ, Ott SM, Recker RR. Bone histomorphometry: standardization of nomenclature, symbols, and units. Report of the ASBMR Histomorphometry Nomenclature Committee. J Bone Miner Res. 1987;2:595–610. doi: 10.1002/jbmr.5650020617. [DOI] [PubMed] [Google Scholar]
- 15.Ferguson VL. Deformation partitioning provides insight into elastic, plastic, and viscous contributions to bone material behavior. J Mech Behav Biomed Mater. 2009;2:364–74. doi: 10.1016/j.jmbbm.2009.01.004. [DOI] [PubMed] [Google Scholar]
- 16.Mittra E, Akella S, Qin YX. The effects of embedding material, loading rate and magnitude, and penetration depth in nanoindentation of trabecular bone. J Biomed Mater Res A. 2006;79:86–93. doi: 10.1002/jbm.a.30742. [DOI] [PubMed] [Google Scholar]
- 17.Oliver WC, Pharr GM. An Improved Technique for Determining Hardness and Elastic-Modulus Using Load and Displacement Sensing Indentation Experiments. Journal of Materials Research. 1992;7:1564–1583. [Google Scholar]
- 18.Sakai M. The Meyer hardness: A measure for plasticity? Journal of Materials Research. 1999;14:3630–3639. [Google Scholar]
- 19.Oyen ML. Nanoindentation hardness of mineralized tissues. J Biomech. 2006;39:2699–702. doi: 10.1016/j.jbiomech.2005.09.011. [DOI] [PubMed] [Google Scholar]
- 20.Lucas BN, Oliver WC, Pharr GM, Loubet JL. Time-Dependent Deformation During Indentation Testing. Mat Res Soc Symp Proc. 1996;436 [Google Scholar]
- 21.Zysset PK, Guo XE, Hoffler CE, Moore KE, Goldstein SA. Mechanical properties of human trabecular bone lamellae quantified by nanoindentation. Technol Health Care. 1998;6:429–32. [PubMed] [Google Scholar]
- 22.Donnelly E, Boskey AL, Baker SP, van der Meulen MC. Effects of tissue age on bone tissue material composition and nanomechanical properties in the rat cortex. J Biomed Mater Res A. 2009;92:1048–56. doi: 10.1002/jbm.a.32442. [DOI] [PMC free article] [PubMed] [Google Scholar]
- 23.Skedros JG, Bloebaum RD, Bachus KN, Boyce TM. The meaning of graylevels in backscattered electron images of bone. J Biomed Mater Res. 1993;27:47–56. doi: 10.1002/jbm.820270107. [DOI] [PubMed] [Google Scholar]
- 24.Skedros JG, Bloebaum RD, Bachus KN, Boyce TM, Constantz B. Influence of mineral content and composition on graylevels in backscattered electron images of bone. J Biomed Mater Res. 1993;27:57–64. doi: 10.1002/jbm.820270108. [DOI] [PubMed] [Google Scholar]
- 25.Sakai F, Shimizu S, Ishikawa T. The indentation load-depth curve of ceramics. Journal of Materials Research. 1999;14:14. [Google Scholar]
- 26.Quinn JB, Quinn GD. Indentation brittleness of ceramics: A fresh approach. Journal of Materials Science. 1997;32:4331–4346. [Google Scholar]
- 27.Paschalis EP, DiCarlo E, Betts F, Sherman P, Mendelsohn R, Boskey AL. FTIR microspectroscopic analysis of human osteonal bone. Calcif Tissue Int. 1996;59:480–7. doi: 10.1007/BF00369214. [DOI] [PubMed] [Google Scholar]
- 28.Gourion-Arsiquaud S, Burket JC, Havill LM, DiCarlo E, Doty SB, Mendelsohn R, van der Meulen MC, Boskey AL. Spatial variation in osteonal bone properties relative to tissue and animal age. J Bone Miner Res. 2009;24:1271–81. doi: 10.1359/JBMR.090201. [DOI] [PMC free article] [PubMed] [Google Scholar]
- 29.Rho JY, Tsui TY, Pharr GM. Elastic properties of human cortical and trabecular lamellar bone measured by nanoindentation. Biomaterials. 1997;18:1325–30. doi: 10.1016/s0142-9612(97)00073-2. [DOI] [PubMed] [Google Scholar]
- 30.Fratzl-Zelman N, Roschger P, Gourrier A, Weber M, Misof BM, Loveridge N, Reeve J, Klaushofer K, Fratzl P. Combination of nanoindentation and quantitative backscattered electron imaging revealed altered bone material properties associated with femoral neck fragility. Calcif Tissue Int. 2009;85:335–43. doi: 10.1007/s00223-009-9289-8. [DOI] [PMC free article] [PubMed] [Google Scholar]
- 31.Weiner S, Wagner HD. The material bone: Structure mechanical function relations. Annual Review of Materials Science. 1998;28:271–298. [Google Scholar]
- 32.Bala Y, Depalle B, Douillard T, Meille S, Clément P, Follet H, Chevalier J, Boivin G. Respective roles of organic and mineral components of human cortical bone matrix in micromechanical behavior: An instrumented indentation study. Journal of the Mechanical Behavior of Biomedical Materials. 2011;4:1473–1482. doi: 10.1016/j.jmbbm.2011.05.017. [DOI] [PubMed] [Google Scholar]
- 33.Viguet-Carrin S, Roux JP, Arlot ME, Merabet Z, Leeming DJ, Byrjalsen I, Delmas PD, Bouxsein ML. Contribution of the advanced glycation end product pentosidine and of maturation of type I collagen to compressive biomechanical properties of human lumbar vertebrae. Bone. 2006;39:1073–9. doi: 10.1016/j.bone.2006.05.013. [DOI] [PubMed] [Google Scholar]
- 34.Paschalis EP, Shane E, Lyritis G, Skarantavos G, Mendelsohn R, Boskey AL. Bone fragility and collagen cross-links. J Bone Miner Res. 2004;19:2000–4. doi: 10.1359/JBMR.040820. [DOI] [PMC free article] [PubMed] [Google Scholar]
- 35.Bala Y, Farlay D, Chapurlat RD, Boivin G. Modifications of bone material properties in postmenopausal osteoporotic women long-term treated with alendronate. Eur J Endocrinol. 2011;165:647–55. doi: 10.1530/EJE-11-0333. [DOI] [PubMed] [Google Scholar]
- 36.Ciarelli TE, Fyhrie DP, Parfitt AM. Effects of vertebral bone fragility and bone formation rate on the mineralization levels of cancellous bone from white females. Bone. 2003;32:311–5. doi: 10.1016/s8756-3282(02)00975-4. [DOI] [PubMed] [Google Scholar]
- 37.Hoffler CE, Guo XE, Zysset PK, Goldstein SA. An application of nanoindentation technique to measure bone tissue Lamellae properties. J Biomech Eng. 2005;127:1046–53. doi: 10.1115/1.2073671. [DOI] [PubMed] [Google Scholar]