Abstract
AIM: To explore a method for quantitative assessment of hepatic functional reserve by combining computed tomography (CT) volumetry with CT grading of liver cirrhosis before liver resection in patients with hepatocellular carcinoma.
METHODS: CT images of 55 patients undergoing liver resection were studied prospectively. The degree of liver cirrhosis was referred as "CT grade" and the percentage of remnant liver volume (PRLV) [PRLV = predicted RLV/predicted total liver volume (PTLV) × 100%; PTLV (mL) = 121.75 + 16.49 × body mass (kg)] were calculated by adding slice by slice of CT liver images. The postoperative RLV, pathologic stages of liver fibrosis in non-tumor area and survival time in these cases were analyzed.
RESULTS: There was a significant difference in survival time between the group with PRLV ≤ 50% and the group with PRLV > 50% (χ2 = 4.988, P = 0.026), and between the group with CT grade 0/1 and the group with CT grade 2/3 (χ2 = 5.429, P = 0.026). With combination of the both parameters, an oblique line was identified according to the distribution of 32 survivors versus 23 deceased subjects. The mortality rate above the line was 7.1% (1/14), and that below the line was 53.7% (22/41), indicating a significant difference between the two rates (χ2 = 9.281, P = 0.002, P < 0.05).
CONCLUSION: PRLV and CT grades are significantly correlated with hepatic functional reserve. The predicted line using these two parameters is useful in candidates undergoing liver resection for judging hepatic functional reserve.
Keywords: Hepatic functional reserve, Liver cirrhosis, Computed tomography, Hepatocellular carcinoma
INTRODUCTION
Liver failure after liver resection is one of the major limitations in surgical therapy of liver cancer[1-3]. It has been generally believed that correct preoperative assessment of the risk of postoperative liver failure is essential in the determination of appropriate surgical procedures. Because impaired liver function after resection and transplantation is caused by insufficient liver volume, the reliable volumetric assessment of the hepatic segments of potential living donors is a critical element in preoperative evaluation[2,4].
Traditional methods for estimation of hepatic functional reserve, such as biochemical examinations of liver function and Child-Pugh classification[5], have been shown to be limited in clinical practice[1]. For example, the liver failure occasionally happened in postoperative patients with Child-Pugh class A, B or C. Thus, it is important to explore more rational strategies for estimating hepatic functional reserve in preoperative patients with hepatocellular carcinoma (HCC). Recently, imaging techniques, such as CT[6-8], ultrasound[9-11], SPECT[12,13], MRI[14,15], etc., have been used to estimate the liver volume. Data derived from these techniques have demonstrated that hepatic functional reserve is significantly correlated with liver volume. Vanthey et al[6] measured the liver volume using spiral CT and found that postoperative patients had an increased rate of serious complications when the remaining liver volume was less than 25%. In our previous studies, we found that, based-on CT image informations, liver cirrhosis can be divided into 4 grades, and the grades were significantly correlated to the prognosis as well. Thus, in this study, we aimed to combine this grading system with liver volumetric analysis to explore a further reliable method for prediction of the postoperative hepatic functional reserve before liver resection.
MATERIALS AND METHODS
Patients
Fifty-five patients (51 men and 4 women; mean age, 48.2 years; range 26-73 years) with HCC were prospectively studied from March 2001 to October 2005. According to the TNM classification[16], 3 were classified as stage II, 12 as stage III and 40 as stage IVa. All patients were histopathologically diagnosed as HCC. Histopathological data of 55 cases revealed chronic hepatitis and liver fibrosis in peri-tumor liver tissues. Eleven of 55 had liver cirrhosis (stage IV of liver fibrosis[17]) at the compensatory stage of liver function. According to the criteria of Child-Pugh classification[5], 46 patients had Child-Pugh class A and 9 had Child-Pugh class B. Hepatitis B surface antigen (HBsAg) was positive in 49.1% (27/55) of the patients. With regard to the surgical data, the average diameter of tumors in the patients was 8.5 cm. The average resected liver volume was 630 mL. The average duration of follow-up in all patients was 236.8 d.
Measurement of the liver volume
Preoperative measurements of the liver volume were performed on dual-phase contrasted CT images using Shimadzu 7000 TX and Somatom Plus 4 CT scanners. The slice thickness was 10 mm and interval was 10 mm. Each slice was traced with a cursor and the liver volume (mL) was calculated by simply adding the area of each slice using a calculator. The whole liver volume and predicted remnant liver volumes (RLV) were measured according to CT imaging and surgically resected specimens. RLV was be confirmed to actual RLV after resection. The percentage of RLV (PRLV) was calculated using the following formula: PRLV = RLV/predicted total liver volume × 100%; RLV = Total liver tumor - (tumor volume + peri-tumor volume); the predicted total liver volume (mL) = 121.75 + 16.49 × body mass (kg). This formula was resulted from regression according to the relations between liver volumes and body weight in 50 cases of normal Chinese. For example, if a patient body is 50 kg and his RLV is 500 mL, his predicted total liver volume will be 946.25 mL and his PRLV will be 52.9%.
Grading of liver cirrhosis
The degree of liver cirrhosis of non-tumor area was divided into 4 grades on CT images. The higher grades represent more serious liver cirrhosis: GradeIshows the most favorable condition, and is characterized by equal density, normal or lightly distorted shape, moderate size of the spleen [spleen index ≤ 300; spleen index = thickness of the spleen (cm) × diameter fore and aft (cm) × spleen up and down (cm)], and no any sign of portal vein hypertension (Figure 1A). Grade II shows the declining condition, and is characterized by unequal density, seriously distorted shape with some atrophy, especially in the liver section 4, and enlargement of the spleen (liver fissure ≤ 1.5 cm, spleen index = 300-600, or 2-3 signs of portal vein hypertension) (Figure 1B). Grade III shows the worsening liver, and is characterized by regenerating nodules, badly trimmed contour, and seriously atrophied volume (fissure > 1.5 cm, spleen index > 600, and 3-4 signs of portal vein hypertension with mild ascites, smaller than 2 cm in depth) (Figure 1C). Grade IV shows the worst condition, and is characterized by the signs worsened than in Grade III, more numerous regeneration nodules, indented contour, and obviously atrophied volume [fissure > 2 cm, over 4 signs of portal vein hypertension with serious ascites, bigger than 2 cm in depth) Figure 1D]. The gradings were identified in a double-blind manner.
Figure 1.
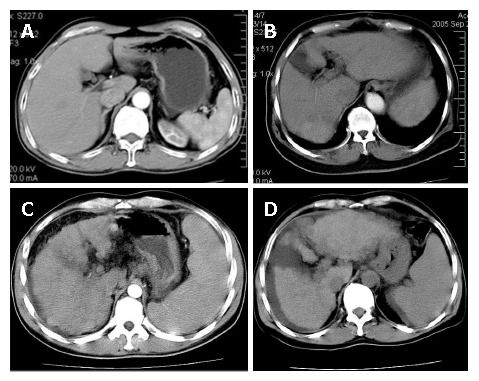
Grading of liver cirrhosis. A: Equal density, normal shape, spleen index 250, and no any sign of portal vein hypertension; B: Unequal density, distorted shape with section 4 atrophy, liver fissure 1.5 cm and spleen index 360; C: Regenerating nodules density, badly trimmed contour, spleen index 620 with mild ascites, 1 cm in depth; D: More numerous regeneration nodules, indented contour, obviously atrophied volume, serious ascites, 2.2 cm in depth.
Surgical procedures
The surgical procedures were selected mainly according to the CT images of the tumor, Child-Pugh classification and liver function test. The RLV was to follow surgical routine procedures. All the liver specimens from the tumor margin were sent to a senior pathologist for histopathological confirmation. The pathological staging of liver fibrosis was according to the methods of the National Virus Hepatitis Prevention and Therapy Congress in 1995 (S0-S4)[17]. The pathologic characteristics of each specimen were recorded.
After surgery, all patients were monitored at the inpatient or outpatient hospital. Liver function tests were performed after surgery and followed by a monthly checkup. Imaging studies, including ultrasound and CT, were performed every 3 to 4 mo.
Statistical analysis
Data were studied by using correlation coefficient, Student’s t-test, Chi-square test and survival analysis when appropriate. Data were analyzed with SAS software (Version 8.2) by Statistical Department of Tongji Medical College of Huazhong University of Science and Technology.
RESULTS
Table 1 shows the intraoperative characteristics of survivors and nonsurvivors resulted from liver failure. The LRV and PLRV of the patients were significantly higher in the survivors than in the nonsurvivors (P < 0.05), while other parameters were not significantly different between the two groups.
Table 1.
Some criteria between the survivors and nonsurvivors
| Criterion | Survivors (n = 32) | Nonsurvivors (n = 25) | t | P |
| Intraoperative blood loss (mL) | 493.6 ± 160.9 | 516.5 ± 269.3 | -0.16 | 0.8735 |
| Intermittent hepatic inflow occlusion (min) | 15.4 ± 4.2 | 15.9 ± 3.3 | -0.17 | 0.863 |
| RLV (mL) | 669.7 ± 76.6 | 512.1 ± 82.8 | 2.83 | 0.0066a |
| P RLV (%) | 62.0 ± 8.0 | 46.0 ± 9.0 | 2.94 | 0.0049a |
| Percentage of resected liver (%) | 57.0 ± 7.0 | 50.0 ± 8.0 | 1.29 | 0.2031 |
P < 0.05.
Using PRLV to predict hepatic functional reserve, the patients were assigned into two groups: PRLV > 50% (n = 27) and PRLV ≤ 50% (n = 28). The survival times were analyzed using Kaplan-Meier methods. Figure 2 represents the survival curves for the two groups. The difference between the two survival probabilities was statistically significant at the level of α = 0.05 using log-rank test (χ2 = 4.988, P = 0.026, P < 0.05). Dividing these 55 cases into two groups of > 50% rate of resection liver volumes and ≤ 50% rate of them, there was no significant difference between the two groups in survival rate using the log-rank test (P = 0.9015).
Figure 2.
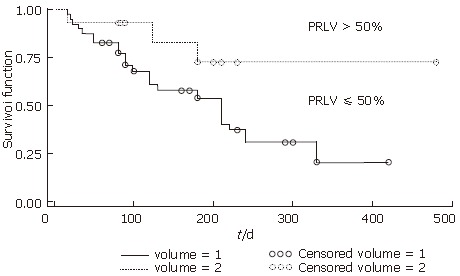
Survival time of two groups based on PRLV. PRLV > 50 (volume = 2) and ≤ 50% (volume = 1); P < 0.05 between the two groups.
Grades of liver cirrhosis based on CT images in the survivors and nonsurvivors are compared in Table 2. After merging CT grade 0 with grade 1 and CT grade 2 with grade 3, the mortality rate of the patients with CT grade 0 and 1 was significantly lower than those with grade 2 and 3 (Fisher’s exact test, χ2 = 5.429, P = 0.026, P < 0.05). The survival time of the former was significantly longer than the latter (Figure 3).
Table 2.
CT grades of cirrhosis in the two groups (n)
| Grade 0 + 1 | Grade 2 + 3 | Total | |
| Survivors | 16 | 16 | 32 |
| Nonsurvivors | 5 | 20 | 25 |
| Total | 21 | 36 | 57 |
Figure 3.
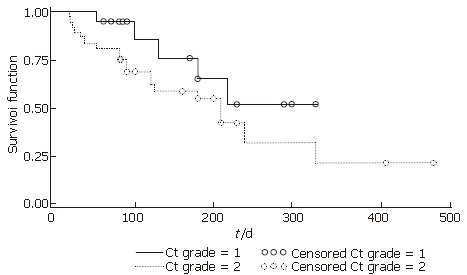
Survival time of two groups based on CT grades. CT grade 1: Group of CT grade 0 and 1; CT grade 2: Group of CT grade 2 and 3. P < 0.05 between the two groups.
Pathologic staging
A positive correlation (r = 0.77, P < 0.0001) was found between CT grades and pathologic fibrosis stages of the non-tumorous liver tissue (S1-S4). Moreover, a significant correlation (r = 0.8, P < 0.0001) between CT grades and Child-Pugh classification was observed.
Follow-up results
Of 55 cases, 32 survived and 23 deceased. The relationship between patients’ outcome and their PRLV with CT grades are shown in Figure 4. An oblique line was identified according to the distribution of 32 survivors versus 23 deceased subjects, which can be used as the predicted line of liver functional reserve before liver resection. The mortality rate above the line (Figure 4) was 7.1% (1/14), and that below the line was 53.7% (22/41), indicating a significant difference between the two rates (χ2 = 9.281, P = 0.002, P < 0.05). A logistic regression was followed. The distribution of the predicted probability of survival in different PRLV with different CT grades is shown in Figure 5, which shows that higher the CT grade and lower the PRLV, higher the predicted probability of death.
Figure 4.
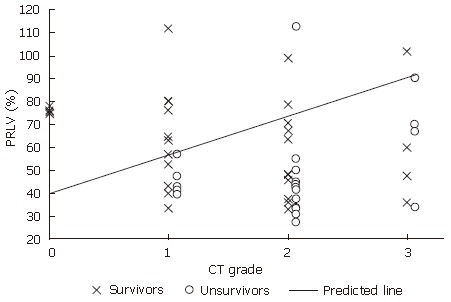
Distribution of survivors and nonsurvivors in the different CT grades with the different PRLV.
Figure 5.
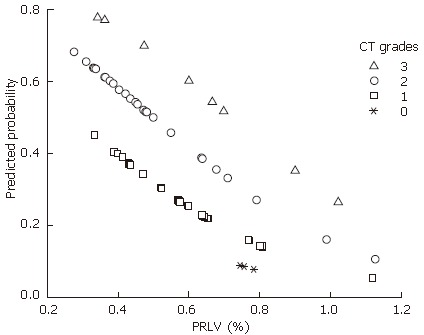
Distribution of the predicted probability of survival in different PRLV (%) with different CT grades.
DISCUSSION
Hepatic functional reserve is highly related to the quantity and quality of liver cells. Liver volume and shape may reflect the condition[18,19]. It is valuable and important to get the accurate assessment of functional reserve of remaining liver prior to hepatectomy. Many researchers have reported that the larger the resected liver volume, the greater the risk of liver failure. However, if the resected liver volume is smaller, the risk of tumor recurrence becomes higher. This problem is paradoxical by nature. It is very difficult to accurately estimate the remnant liver volume using the ratio of liver section because the range of variation is very large under different conditions[20]. Estimating resection volume during surgery is also very difficult, particularly with respect to the appearance of the diseased liver. CT images not only directly show the status of tumor, but also allow measurements of non-tumor areas and subsequent calculation of RLV. We found the error rate of the measurement of CT liver volume was only 2.6%, so it is a highly reproducible technique. The mortality in this study was higher than that reported by others, because of the larger tumors and the late clinical stages (40 with stage IVa, 72.7%), as well as the larger resection volumes (PRLV < 50% was 50.9%).
At present, there exists disagreement as to what percentages of the remnant hepatic volume is safe for liver resection. Previous reports had focused mainly on resected liver volume or the ratio of resected liver volume (resected liver volume/total liver volume)[7,18,21]. The disadvantages of those methods were that they did not take into account the liver volumes of the patients and their whole body condition, such as body weight, and the functional reserve of the remnant liver. Liver volume is actually related to body weight[22,23]. Therefore, our study was designed to explore a quantitative method for the evaluation of hepatic functional reserve by combining CT volumetry with morphometry in different conditions of the patients. We found that there were no obvious differences in the percentage of resected liver volume, but there was a significant difference in PRLV between the survivors and the nonsurvivors, thereby suggesting that PRLV is more valuable than the percentage of resected liver volume.
What is the valuable range of RLV for estimating the hepatic functional reserve? How many PRLV is safe in different degrees of liver cirrhosis? PRLV is an important factor that affects patients’ survival rate. However, there are some disadvantages of this criterion. Firstly, the time of follow-up was not the same. Secondly, TNM classification of the tumors was not the same in the nonsurvivors versus the survivors. Therefore, PRLV may not completely explain the difference in these two survival rates. Because survival analysis includes information about time and outcome, as well as data about the mean terminal time of follow-up, which is especially suitable for the analysis of mixed factors or situations where the time of observation is too long to be controlled. As shown in Figure 2, 50% of PRLV may be a safe threshold line for liver resection. However, the major disadvantage of Figure 2 is that it cannot reflect the hepatic functional reserve in different grades of liver cirrhosis. Therefore, the application of the 50% of PRLV as a safe threshold for surgical resection may not be reliable enough and the difference in mortality within 200 d may not be enough to reflect the liver function in the different grades of cirrhosis. It has been observed in clinical studies that resection of even small tumors could lead to liver failure[24], while the resection of large tumors could have a longer survival time[25]. This suggests that PRLV should not be the same in different grades of liver cirrhosis. Therefore, it is necessary to evaluate the CT grading of liver cirrhosis for estimating the hepatic functional reserve. For this, we designed the CT grading system to evaluate the liver cirrhosis because it is valuable to evaluate liver fibrosis and cirrhosis by using MR and Doppler US image[26,27]. A series of observation was designed according to CT grade 0, 1, 2, 3 which included survival rate and fibrosis stages of non-tumor area. The survival rate of CT grade 0 and 1 was significantly higher than that in CT grade 2 and 3 (Figure 3).
Although both PRLV and CT grading had a certain value for preoperative assessment of hepatic functional reserve, they could not resolve the dilemma that PRLV should differ from the degrees of liver cirrhosis. For this reason, we further investigated how to combine the two parameters that could be used to determine the resection volume. Based on our data, it is clear that mortality increases, if PRLV is lower than 50%, with varied difference of survival rates among the different CT grade groups.
As the hepatic functional reserve reduces due to liver cirrhosis, not only the numbers of liver cell is decreased, but also the stage of fibrosis increases at the same time[28]. Therefore, according to the theoretical calculations, PRLV should be increased with the increasing grade of liver cirrhosis. But what is a safe threshold has not been clearly elucidated. For this reason, we designed a method to analyze the survival distribution together with PRLV and CT grades and found an oblique line (Figure 4) which could be used as a prediction for survival based on both PRLV and different CT grades of liver cirrhosis.
This predicted line suggests that 40% of PRLV is safe if no liver cirrhosis occurred, but more than 90% PRLV is marginally safe at CT grade 3. This line is very simple and useful to be used as one parameter for liver resection. This line not only concerns with the quality of the remnant liver, but also the quantity of the remnant liver. Therefore, this line has a certain ability of predicting hepatic functional reserve. This method is particularly applicable to the evaluation of the hepatic functional reserve for HCC with liver cirrhosis, because it can eliminate the false estimation of liver function due to the liver tumor itself. This method is considered to be non-invasive, relatively cheap and applicable enough to be clinically applied. It can clearly suggest how much liver resection is safe during hepatectomy.
In conclusion, postoperative liver function level and survival rate are related to PRLV and CT grades of liver cirrhosis. Combining the two parameters can form an important prediction line for the evaluation of hepatic functional reserve. The criterion should be tested and verified with more cases in clinical applications. Also, implementing this algorithm in CT analysis software could lead to automatic measures of liver volume, which could be used for better diagnosis and prognosis in HCC patients.
ACKNOWLEDGMENTS
We thank Professor Deyun Feng, Department of Pathology of Xiangya Medical College, Central-South University for the liver fibrosis classification; Jian-Guang Luo, MD, Ji-Xiong Hu, MD, Second Hospital of Xiangya, Central-South University; Jian-Jun Li and Dr. Xuan-Ju Gong, Hainan Province Hospital for supplying some of the data, and Professor Song-Lin Yu, Tongji Medical College, Huazhong University of Science and Technology for his expert advice on statistical analysis. We thank Dr. Melissa Parisi, University of Washington and Rifat Hamoudi, MD, Addenbrooke’s Hospital, University of Cambridge, UK for critical reviewing our manuscript and helpful comments.
Footnotes
Supported by the Natural Science Foundation of Hainan Province, No. 30527
S- Editor Zhu LH L- Editor Kumar M E- Editor Wang HF
References
- 1.Mullin EJ, Metcalfe MS, Maddern GJ. How much liver resection is too much? Am J Surg. 2005;190:87–97. doi: 10.1016/j.amjsurg.2005.01.043. [DOI] [PubMed] [Google Scholar]
- 2.Okamoto E, Yamanaka N, Oriyama T, Tomoda F, Kyo A. Prediction of the safe limits of hepatectomy by combined volumetric and functional measurements in patients with impaired hepatic function. Cancer Treat Res. 1994;69:293–299. doi: 10.1007/978-1-4615-2604-9_24. [DOI] [PubMed] [Google Scholar]
- 3.Shirabe K, Shimada M, Gion T, Hasegawa H, Takenaka K, Utsunomiya T, Sugimachi K. Postoperative liver failure after major hepatic resection for hepatocellular carcinoma in the modern era with special reference to remnant liver volume. J Am Coll Surg. 1999;188:304–309. doi: 10.1016/s1072-7515(98)00301-9. [DOI] [PubMed] [Google Scholar]
- 4.Fazakas J, Mándli T, Ther G, Arkossy M, Pap S, Füle B, Németh E, Tóth S, Járay J. Evaluation of liver function for hepatic resection. Transplant Proc. 2006;38:798–800. doi: 10.1016/j.transproceed.2006.01.048. [DOI] [PubMed] [Google Scholar]
- 5.Pugh RN, Murray-Lyon IM, Dawson JL, Pietroni MC, Williams R. Transection of the oesophagus for bleeding oesophageal varices. Br J Surg. 1973;60:646–649. doi: 10.1002/bjs.1800600817. [DOI] [PubMed] [Google Scholar]
- 6.Vauthey JN, Chaoui A, Do KA, Bilimoria MM, Fenstermacher MJ, Charnsangavej C, Hicks M, Alsfasser G, Lauwers G, Hawkins IF, et al. Standardized measurement of the future liver remnant prior to extended liver resection: methodology and clinical associations. Surgery. 2000;127:512–519. doi: 10.1067/msy.2000.105294. [DOI] [PubMed] [Google Scholar]
- 7.Schiano TD, Bodian C, Schwartz ME, Glajchen N, Min AD. Accuracy and significance of computed tomographic scan assessment of hepatic volume in patients undergoing liver transplantation. Transplantation. 2000;69:545–550. doi: 10.1097/00007890-200002270-00014. [DOI] [PubMed] [Google Scholar]
- 8.Saygili OB, Tarhan NC, Yildirim T, Serin E, Ozer B, Agildere AM. Value of computed tomography and magnetic resonance imaging for assessing severity of liver cirrhosis secondary to viral hepatitis. Eur J Radiol. 2005;54:400–407. doi: 10.1016/j.ejrad.2004.08.001. [DOI] [PubMed] [Google Scholar]
- 9.Laudy JA, Janssen MM, Struyk PC, Stijnen T, Wallenburg HC, Wladimiroff JW. Fetal liver volume measurement by three-dimensional ultrasonography: a preliminary study. Ultrasound Obstet Gynecol. 1998;12:93–96. doi: 10.1046/j.1469-0705.1998.12020093.x. [DOI] [PubMed] [Google Scholar]
- 10.Lim AK, Patel N, Eckersley RJ, Kuo YT, Goldin RD, Thomas HC, Cosgrove DO, Taylor-Robinson SD, Blomley MJ. Can Doppler sonography grade the severity of hepatitis C-related liver disease? AJR Am J Roentgenol. 2005;184:1848–1853. doi: 10.2214/ajr.184.6.01841848. [DOI] [PubMed] [Google Scholar]
- 11.Haktanir A, Cihan BS, Celenk C, Cihan S. Value of Doppler sonography in assessing the progression of chronic viral hepatitis and in the diagnosis and grading of cirrhosis. J Ultrasound Med. 2005;24:311–321. doi: 10.7863/jum.2005.24.3.311. [DOI] [PubMed] [Google Scholar]
- 12.Bennink RJ, Dinant S, Erdogan D, Heijnen BH, Straatsburg IH, van Vliet AK, van Gulik TM. Preoperative assessment of postoperative remnant liver function using hepatobiliary scintigraphy. J Nucl Med. 2004;45:965–971. [PubMed] [Google Scholar]
- 13.Kwon AH, Matsui Y, Kaibori M, Ha-Kawa SK. Preoperative regional maximal removal rate of technetium-99m-galactosyl human serum albumin (GSA-Rmax) is useful for judging the safety of hepatic resection. Surgery. 2006;140:379–386. doi: 10.1016/j.surg.2006.02.011. [DOI] [PubMed] [Google Scholar]
- 14.Matsuo M, Kanematsu M, Kim T, Hori M, Takamura M, Murakami T, Kondo H, Moriyama N, Nakamura H, Hoshi H. Esophageal varices: diagnosis with gadolinium-enhanced MR imaging of the liver for patients with chronic liver damage. AJR Am J Roentgenol. 2003;180:461–466. doi: 10.2214/ajr.180.2.1800461. [DOI] [PubMed] [Google Scholar]
- 15.Annet L, Materne R, Danse E, Jamart J, Horsmans Y, Van Beers BE. Hepatic flow parameters measured with MR imaging and Doppler US: correlations with degree of cirrhosis and portal hypertension. Radiology. 2003;229:409–414. doi: 10.1148/radiol.2292021128. [DOI] [PubMed] [Google Scholar]
- 16.Hermanek P, Scheibe O, Spiessl B, Wagner G. TNM classification of malignant tumors: the new 1987 edition. Radiobiol Radiother (Berl) 1987;28:845–846. [PubMed] [Google Scholar]
- 17.Desmet VJ, Gerber M, Hoofnagle JH, Manns M, Scheuer PJ. Classification of chronic hepatitis: diagnosis, grading and staging. Hepatology. 1994;19:1513–1520. [PubMed] [Google Scholar]
- 18.Shoup M, Gonen M, D'Angelica M, Jarnagin WR, DeMatteo RP, Schwartz LH, Tuorto S, Blumgart LH, Fong Y. Volumetric analysis predicts hepatic dysfunction in patients undergoing major liver resection. J Gastrointest Surg. 2003;7:325–330. doi: 10.1016/s1091-255x(02)00370-0. [DOI] [PubMed] [Google Scholar]
- 19.Lu LG, Zeng MD, Wan MB, Li CZ, Mao YM, Li JQ, Qiu DK, Cao AP, Ye J, Cai X, et al. Grading and staging of hepatic fibrosis, and its relationship with noninvasive diagnostic parameters. World J Gastroenterol. 2003;9:2574–2578. doi: 10.3748/wjg.v9.i11.2574. [DOI] [PMC free article] [PubMed] [Google Scholar]
- 20.Abdalla EK, Denys A, Chevalier P, Nemr RA, Vauthey JN. Total and segmental liver volume variations: implications for liver surgery. Surgery. 2004;135:404–410. doi: 10.1016/j.surg.2003.08.024. [DOI] [PubMed] [Google Scholar]
- 21.Wigmore SJ, Redhead DN, Yan XJ, Casey J, Madhavan K, Dejong CH, Currie EJ, Garden OJ. Virtual hepatic resection using three-dimensional reconstruction of helical computed tomography angioportograms. Ann Surg. 2001;233:221–226. doi: 10.1097/00000658-200102000-00011. [DOI] [PMC free article] [PubMed] [Google Scholar]
- 22.Truant S, Oberlin O, Sergent G, Lebuffe G, Gambiez L, Ernst O, Pruvot FR. Remnant liver volume to body weight ratio > or =0.5%: A new cut-off to estimate postoperative risks after extended resection in noncirrhotic liver. J Am Coll Surg. 2007;204:22–33. doi: 10.1016/j.jamcollsurg.2006.09.007. [DOI] [PubMed] [Google Scholar]
- 23.Sandrasegaran K, Kwo PW, DiGirolamo D, Stockberger SM, Cummings OW, Kopecky KK. Measurement of liver volume using spiral CT and the curved line and cubic spline algorithms: reproducibility and interobserver variation. Abdom Imaging. 1999;24:61–65. doi: 10.1007/s002619900441. [DOI] [PubMed] [Google Scholar]
- 24.Horigome H, Nomura T, Nakao H, Saso K, Takahashi Y, Akita S, Sobue S, Mizuno Y, Nojiri S, Hirose A, et al. Treatment of solitary small hepatocellular carcinoma: consideration of hepatic functional reserve and mode of recurrence. Hepatogastroenterology. 2000;47:507–511. [PubMed] [Google Scholar]
- 25.Capussotti L, Muratore A, Amisano M, Massucco P, Polastri R, Bouzari H. Liver resection for large-size hepatocellular carcinomas in 47 non-cirrhotic patients--no mortality and long-term survival. Hepatogastroenterology. 2006;53:768–772. [PubMed] [Google Scholar]
- 26.Ito K, Mitchell DG, Hann HW, Kim Y, Fujita T, Okazaki H, Honjo K, Matsunaga N. Viral-induced cirrhosis: grading of severity using MR imaging. AJR Am J Roentgenol. 1999;173:591–596. doi: 10.2214/ajr.173.3.10470885. [DOI] [PubMed] [Google Scholar]
- 27.Bolognesi M, Sacerdoti D, Mescoli C, Bombonato G, Cillo U, Merenda R, Giacomelli L, Merkel C, Rugge M, Gatta A. Different hemodynamic patterns of alcoholic and viral endstage cirrhosis: analysis of explanted liver weight, degree of fibrosis and splanchnic Doppler parameters. Scand J Gastroenterol. 2007;42:256–262. doi: 10.1080/00365520600880914. [DOI] [PubMed] [Google Scholar]
- 28.Nakaji M, Hayashi Y, Ninomiya T, Yano Y, Yoon S, Seo Y, Nagano H, Komori H, Hashimoto K, Orino A, et al. Histological grading and staging in chronic hepatitis: its practical correlation. Pathol Int. 2002;52:683–690. doi: 10.1046/j.1440-1827.2002.01410.x. [DOI] [PubMed] [Google Scholar]


