Abstract
Background
Planners have relied on the Urban Development Boundary (UDB)/Urban Growth Boundary (UGB) and Central Business District (CBD) to encourage contiguous urban development and conserve infrastructure. However, no studies have specifically examined the relationship between proximity to the UDB/UGB and CBD and walking behavior.
Purpose
To examine the relationship between UDB- and CBD-distance and walking in a sample of recent Cuban immigrants, who report little choice in where they live after arrival to the U.S.
Methods
Data were collected in 2008-2010 from 391 healthy, recent Cuban immigrants recruited and assessed within 90 days of arrival to the U.S. who resided throughout Miami-Dade County FL. Analyses in 2012-2013 examined the relationship between each UDB- and CBD-distance for each participant’s residential address and purposive walking, controlling for key sociodemographics. Follow-up analyses examined whether Walk Score®, a built-environment walkability metric based on distance to amenities such as stores and parks, mediated the relationship between purposive walking and each of UDB- and CBD-distance.
Results
Each one-mile increase in distance from the UDB corresponded to an 11% increase in the number of minutes of purposive walking, whereas each one-mile increase from the CBD corresponded to a 5% decrease in the amount of purposive walking. Moreover, Walk Score® mediated the relationship between walking and each of UDB- and CBD-distance.
Conclusions
Given the lack of walking and walkable destinations observed in proximity to the UDB/UGB boundary, a sprawl repair approach could be implemented, which strategically introduces mixed-use zoning to encourage walking throughout the boundary’s zone.
Introduction
Planners have relied on the Urban Development Boundary, or Urban Growth Boundary, (UDB/UGB) to encourage contiguous urban development and conserve infrastructure.1-6 Proximity to the UGB/UDB boundary typically indicates development that is single use, sprawling, and isolated,1, 6-8 the opposite of the Central Business District (CBD), which is characterized by mixed-use neighborhoods with high connectivity.9-11 If it could be shown that the proximate environment of the UGB/UDB boundary demonstrates deleterious health impacts, then policy planners using the tool of the UGB/UDB to contain growth may reconsider zoning, density, and financial incentives that encourage any development that occurs at the boundary to manifest neighborhood characteristics associated with beneficial health impacts.12-14 However, no peer-reviewed studies have specifically examined the relationship between either proximity to a UDB or a CBD and residents’ walking behavior.
Recent Cuban immigrants are a population who overwhelmingly reported little choice in their selection of built-environments,15 thus addressing selection bias, which occurs in many built-environment studies.15-18 When these immigrants arrive in the U.S., a population generally accustomed to physical activity19, 20 is exposed to a variety of neighborhood walkability conditions. This study investigates the relationship between UDB- and CBD-distance and recent Cuban immigrants’ purposive or utilitarian walking.21-26 Walk Score®, a built-environment walkability metric assessing proximity to amenities such as parks and stores,27 was shown to be related to purposive walking in the current sample.15 The present study assesses whether Walk Score® mediates the relationship between UDB- or CBD-distance and purposive walking.
Methods
Study Population
Data were collected as part of the Cuban Health Study, a population-based, prospective cohort study.15 Analyses (2012-2013) utilized data from the baseline assessment (2008-2010).
Study Setting
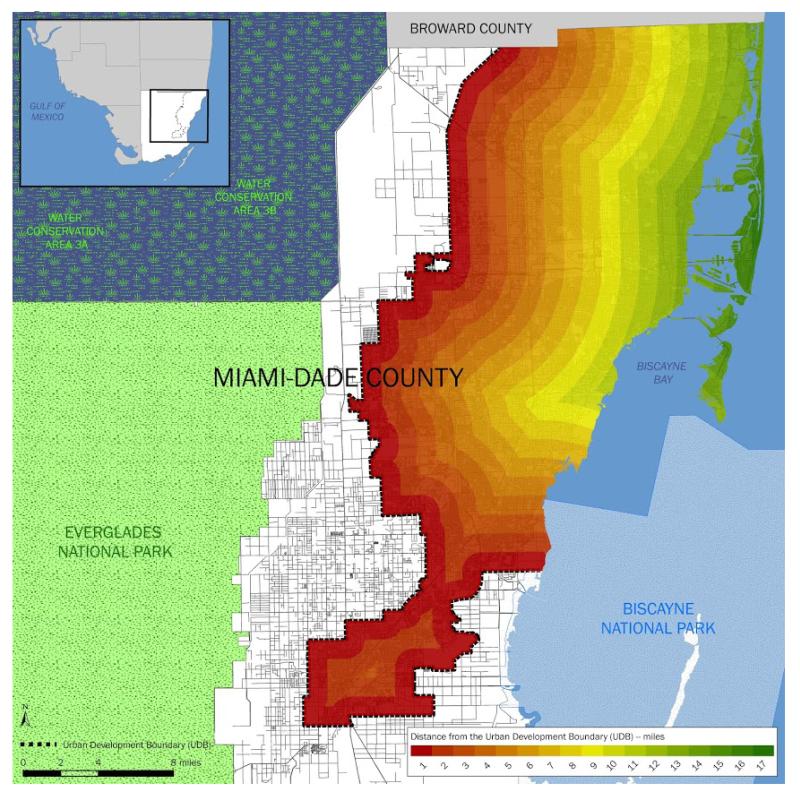
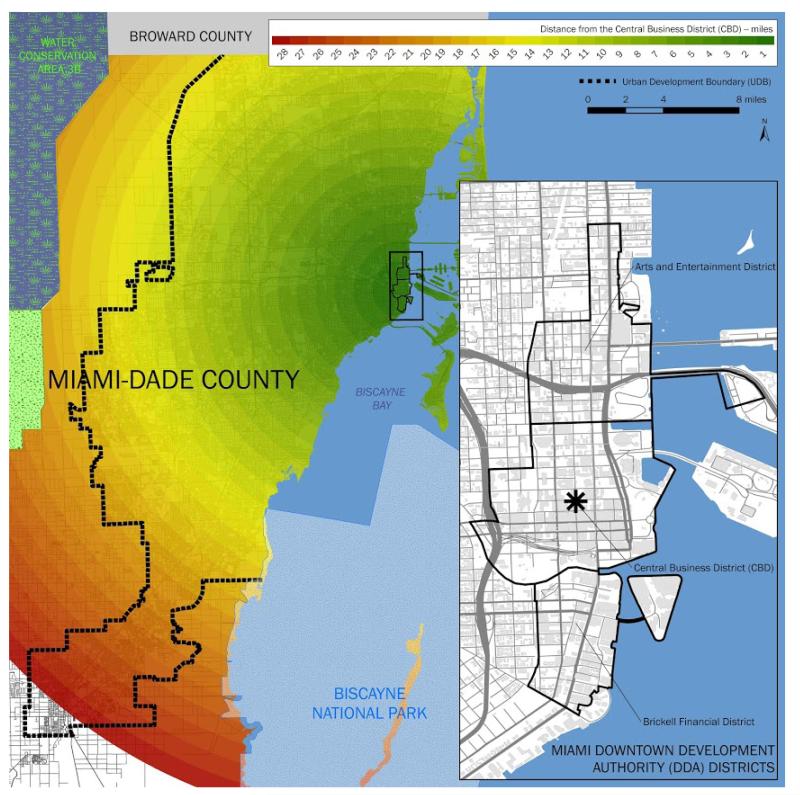
Participants resided throughout Miami-Dade County FL, which encompasses diverse built-environments, with Walk Scores® ranging from 2-98 on a scale of 0-100.15 The UDB is a zoning mechanism delimiting the extent of urban and agricultural expansion within Miami-Dade County to protect Everglades National Park (Figure 1).1 Growth originated along the east coast; sprawl extends to the UDB. The CBD is the cultural, financial, and commercial center of the county, which includes residences near retail and civic uses in downtown Miami (Figure 2).28, 29
Figure 1.
Distance (in miles) from the Urban Development Boundary in Miami-Dade County, Florida.
Figure 2.
Distance (in miles) from the greater Miami Central Business District in Miami-Dade County, Florida.
Measures
Distance to the UDB1 and CBD28 was calculated for participants’ residential addresses using ArcGIS, version 9.3 (Esri, Redlands CA) and used as predictor variables. UDB-distances for participants who lived inside the UDB (n=388) were coded as positive numbers, whereas distances beyond the UDB (n=3) were coded as negative numbers because they are hypothesized to be detrimental.
Walk Score® is a measure of walkability, based on distance to amenities or walkable destinations.27, 30-32 Walk Score® awards points based on distance to the nearest destination of each type (e.g., retail, recreational) using multiple data sources (e.g., Google, OpenStreetMap). Points are summed and normalized to produce a score of 0-100.15, 27, 30-32 Reliability and validity are acceptable.15, 30, 31, 33-36 Participants’ addresses were coded using walkscore.com.15, 27
Purposive walking, used as the outcome variable, was assessed for the week prior to baseline using the International Physical Activity Questionnaire (IPAQ) “walking for transport” subscale, which assesses minutes of walking to get from place to place.37
Covariates were age, gender, education, BMI, days in the U.S., and habitual physical activity level (walking and cycling frequency for the last year in Cuba).38, 39
Statistical Analyses
Regression analyses examined separately the relationship between UDB- and CBD-distance and the amount of purposive walking (log10-minutes, because of skewing), adjusting for covariates. Follow-up analyses assessed whether Walk Score® mediated the relationship between the outcome of purposive walking and each of UDB- and CBD-distance. Mediation was tested using the asymmetrical distribution of products test,40 which multiplies the unstandardized coefficients of the two paths that determine the mediating pathway and estimates a corresponding SE. If the 95% CI for this product does not include zero, then mediation is assumed. Analyses were conducted using SPSS/PASW Statistics, version 18 (IBM, Endicott NY) and Mplus, version 7.0 (Muthén & Muthén, Los Angeles CA).
Results
Table 1 presents summary statistics for the study sample. Table 2 presents the results of the regression analyses. For each one-mile increase in distance from the UDB, there was a significant 11% increase in the number of minutes of purposive walking (0.045 log10-minutes), and for each one-mile increase in distance from the CBD, there was a significant 5% decrease in the number of minutes of purposive walking (-0.023 log10-minutes).
Table 1.
Descriptive statistics for the sample
| Variable | Overall sample | ||
|---|---|---|---|
| M | (SD) | Range | |
| Demographics | |||
| Age | 37.11 52.2 |
(4.52) | 30.00–45.00 |
| Gender, % male | % | ||
| Education, years | 13.13 | (2.52) | 6.00–17.00 |
| BMI | 24.95 | (2.44) | 18.73–30.36 |
| Days in U.S. at baseline assessment | 40.99 | (24.71) | 6.00–123.00 |
| Habitual physical activity in Cuba | 3.13 | (0.69) | 1.00–5.00 |
| Predictor variables | |||
| UDB-distance, milesa | 5.35 | (3.41) | −2.35–15.73 |
| CBD-distance, miles | 9.48 | (4.98) | 0.12–26.51 |
| Mediator variable | |||
| Walk Score® | 59.26 | (16.43) | 2.00–98.00 |
| Outcome variables | |||
| Amount of purposive walking in last week, minutes (in U.S.) |
121.5 6 | (251.2 8) |
0.00– 1260.00 |
Positive values for UDB-distances correspond to participants whose residential addresses were inside the UDB.
Negative values for UDB-distances correspond to participants whose addresses were outside the UDB boundary (i.e., beyond the extent of allowable urban expansion). 1
CBD, Central Business District; UDB, Urban Development Boundary.
Table 2.
Adjusted regression analyses of the relationship between (a) UDB-distance and (b) CBD-distance with the amount of purposive walking
| Outcome variable: Amount of purposive walking (log10-min), last week (in U.S.) |
|||||||||
|---|---|---|---|---|---|---|---|---|---|
| (a) UDB distance and covariates in relation to purposive walking |
(b) CBD distance and covariates in relation to purposive walking |
||||||||
| Unstandardized Coefficient (b) |
SE |
P- value |
β | Unstandardized Coefficient (b) |
SE |
P- value |
β | ||
| Independent variables |
Independent variables |
||||||||
|
UDB
distance (miles) a |
0.045 | 0.016 | 0.004 ** | 0.143 |
CBD distance
(miles) |
− 0.023 | 0.011 | 0.034 * |
−
0.107 |
| Age | 0.015 | 0.012 | 0.206 | 0.064 | Age | 0.015 | 0.012 | 0.222 | 0.062 |
| Genderb | −0.040 | 0.111 | 0.721 | − 0.019 |
Genderb | −0.045 | 0.112 | 0.687 | − 0.021 |
| Education, years |
0.037 | 0.022 | 0.085 | 0.088 | Education (years) |
0.036 | 0.022 | 0.099 | 0.084 |
| BMI | −0.023 | 0.023 | 0.315 | − 0.052 |
BMI | −0.023 | 0.023 | 0.312 | − 0.053 |
| Number of days in U.S. |
0.002 | 0.002 | 0.362 | 0.046 | Number of days in U.S. |
0.002 | 0.002 | 0.355 | 0.047 |
|
Habitual PA
in Cuba |
0.220 | 0.078 | 0.005 ** | 0.143 |
Habitual PA
in Cuba |
0.219 | 0.080 | 0.006 ** | 0.139 |
Note: Boldface indicates statistical significance.
p<0.05
p<0.01.
Positive values for UDB distances correspond to participants whose residential addresses were inside the UDB. Negative values for UDB distances correspond to participants whose addresses were outside the UDB boundary (i.e., beyond the extent of allowable urban expansion).1
Gender coded as a dichotomous variable (1=male, 0=female).
β, standardized path coefficient; CBD, Central Business District; b, unstandardized path coefficient; PA, physical activity, UDB, Urban Development Boundary
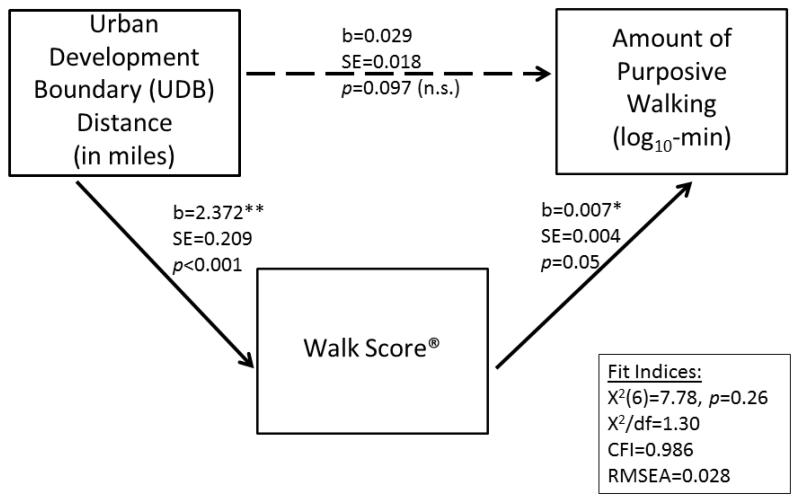
Planned post-hoc analyses included a path model which simultaneously examined the relationships among UDB-distance, Walk Score®, and purposive walking, with paths drawn from each covariate to the outcome: purposive walking (Figure 3a). Standard fit indices for structural equation modeling revealed an excellent fit of the model to the data: X2/df<3, Comparative Fit Index (CFI)>0.90, and Root Mean Square Error of Approximation (RMSEA)<0.08 suggested adequate model fit.41, 42 The direct pathway between UDB-distance and purposive walking was no longer statistically significant when all variables were entered simultaneously into the model. The CI for the mediation test40 did not include zero (product of unstandardized paths=0.017, 95% CI= 0.003, 0.032), suggesting that Walk Score® mediates the UDB-distance to walking relationship.
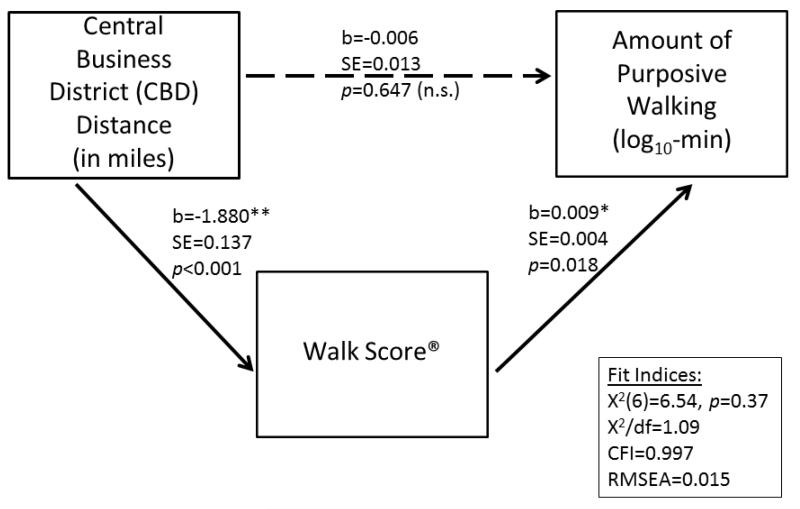
Figure 3.
Final path models of the interrelationships among: A) UDB-Distance, Walk Score®, and purposive walking; and B) CBD-distance, Walk Score®, and purposive walking. CBD, Central Business District; CFI, Comparative Fit Index; RMSEA, Root Mean Square Error of Approximation; UDB, Urban Development Boundary
Similarly, the direct pathway between CBD-distance and purposive walking was no longer statistically significant when Walk Score® and all covariates were included simultaneously in the model. Model fit was excellent (Figure 3b). The CI for the mediation test40 did not include zero (product of unstandardized paths= −0.017, 95% CI= −0.030, −0.005), suggesting that Walk Score® mediates the CBD-distance to walking relationship.
Discussion
For a sample of recent Cuban immigrants, living a greater distance from the Miami-Dade County UDB1 and in closer proximity to the CBD28 were associated with greater amounts of purposive walking. Given that Walk Score®27 mediated the relationship of walking to both UDB- and CBD-distance, living closer to the CBD and further from the UDB may be associated with less urban sprawl and more destinations for walking.
This is the first study to find relationships between both UDB- and CBD-distance and walking behavior. It does so in a population who reported that they did not select where they lived based on built-environment characteristics,15 thus reducing the potential for selection bias.16-18
There are limitations: this analysis omits constructs such as pedestrian infrastructure, crime, and destination quality. However, levels of land-use mix (i.e., Walk Score®) may account in part for the relationships observed between UDB-, CBD-distance, and walking. Future studies should assess these findings’ generalizability in similar and different populations. Finally, walking was assessed by a single measure (IPAQ)37 and motorized vehicle access or travel were not assessed.
Conclusions
This is the first study to find that UDB- and CBD-distance are related to purposive walking and destinations for walking, measured by Walk Score®,27 albeit in opposite directions. Increased distance from the UDB/UGB and reduced distance from the CBD may potentially offer health benefits associated with greater numbers of destinations to promote walking. UDB/UGB policies may therefore merit reconsideration. Given the health implications of such an environment, the UDB/UGB might benefit from a sprawl repair approach13 in which mixed-use zoning, connection of roadways, and development of amenities that better serve the citizenry living in the boundary’s zone are strategically introduced.12-14
Acknowledgments
The work presented in this paper was supported by a research grant from the National Institute of Diabetes and Digestive and Kidney Diseases (grant No. 1R01-DK-074687, J. Szapocznik, PI; T. Perrino, Project Director), and a grant from the National Center for Advancement of Translational Sciences (grant No. 1UL1TR000460, J. Szapocznik, Principal Investigator).
Professor Joanna Lombard is a licensed architect and public speaker on New Urbanism, and the results of this study may lead to financial benefit because she has expertise in New Urbanism, which encourages walkable community designs. Professor Elizabeth Plater-Zyberk is a founding member of the Congress for the New Urbanism and one of the principals of the Duany Plater-Zyberk (DPZ) architectural firm; therefore, the results of this study may lead to financial benefit because she has expertise in New Urbanism. None of the authors have any financial interest in walkscore.com.
Footnotes
Publisher's Disclaimer: This is a PDF file of an unedited manuscript that has been accepted for publication. As a service to our customers we are providing this early version of the manuscript. The manuscript will undergo copyediting, typesetting, and review of the resulting proof before it is published in its final citable form. Please note that during the production process errors may be discovered which could affect the content, and all legal disclaimers that apply to the journal pertain.
No other financial disclosures have been reported by the authors of this paper.
References
- 1.Environmental Protection Agency (EPA) Growing for a sustainable future: Miami-Dade County Urban Development Boundary assessment. EPA; Washington, DC: 2012. http://www.epa.gov/smartgrowth/pdf/Miami-Dade_Final_Report_12-12-12.pdf. [Google Scholar]
- 2.Herold M, Goldstein NC, Clarke KC. The spatiotemporal form of urban growth: measurement, analysis and modeling. Remote Sens Environ. 2003;86:286–302. [Google Scholar]
- 3.Long Y, Shen Z, Mao Q. An urban containment planning support system for Beijing. Comput Environ Urban. 2011;35:297–307. [Google Scholar]
- 4.Nelson AC, Dawkins CJ. Urban containment in the United States: history, models, and techniques for regional and metropolitan growth management. American Planning Association; Chicago, IL: 2004. [Google Scholar]
- 5.Pendall R, Martin J, Fulton W. Holding the line: urban containment in the United States. Brookings Institution Center on Urban and Metropolitan Policy; Washington, DC: 2002. [Google Scholar]
- 6.Song Y, Knaap GJ. Measuring urban form: is Portland winning the war on sprawl? J Am Plann Assoc. 2004;70(2):210–25. [Google Scholar]
- 7.Siu VW, Lambert WE, Fu R, Hillier TA, Bosworth M, Michael YL. Built environment and its influences on walking among older women: use of standardized geographic units to define urban forms. J Environ Public Health. 2012:2012–203141. doi: 10.1155/2012/203141. [DOI] [PMC free article] [PubMed] [Google Scholar]
- 8.Duany A, Plater-Zyberk E, Speck J. Suburban nation: the rise of sprawl and the decline of the American dream. North Point Press; New York: 2000. [Google Scholar]
- 9.Ewing R, Cervero R. Travel and the built environment: A meta-analysis. J Am Plann Assoc. 2010;76(3):265–94. [Google Scholar]
- 10.Turrell G, Haynes M, Wilson L-A, Giles-Corti B. Can the built environment reduce health inequalities? A study of neighbourhood socioeconomic disadvantage and walking for transport. Health & Place. 2013;19:89–98. doi: 10.1016/j.healthplace.2012.10.008. [DOI] [PubMed] [Google Scholar]
- 11.Yamada I, Brown BB, Smith KR, Zick CD, Kowaleski-Jones L, Fan JX. Mixed land use and obesity: an empirical comparison of alternative land use measures and geographic scales. Prof Geogr. 2012;64(2):157–77. doi: 10.1080/00330124.2011.583592. [DOI] [PMC free article] [PubMed] [Google Scholar]
- 12.Eitler TW, McMahon ET, Thoerig TC. Ten Principles for Building Healthy Places. Urban Land Institute; Washington, DC: 2013. http://www.uli.org/wp-content/uploads/ULI-Documents/10-Principles-for-Building-Healthy-Places.pdf. [Google Scholar]
- 13.Tachieva G. Sprawl Repair Manual. Island Press; Washington, DC: 2010. [Google Scholar]
- 14.Urban Land Institute . Intersections: Health and the Built Environment. Urban Land Institute; Washington, DC: 2013. http://www.uli.org/wp-content/uploads/ULI-Documents/Intersections-Health-and-the-Built-Environment.pdf. [Google Scholar]
- 15.Brown SC, Pantin H, Lombard J, Toro M, Huang S, Plater-Zyberk E, et al. Walk Score®: Associations with purposive walking in recent Cuban immigrants. Am J Prev Med. 2013;45(2):202, 6. doi: 10.1016/j.amepre.2013.03.021. [DOI] [PMC free article] [PubMed] [Google Scholar]
- 16.Frank LD, Saelens BE, Powell KE, Chapman JE. Stepping towards causation: Do built environments or neighborhood and travel preferences explain physical activity, driving, and obesity? Soc Sci Med. 2007;65(9):1898–914. doi: 10.1016/j.socscimed.2007.05.053. [DOI] [PubMed] [Google Scholar]
- 17.Handy SL, Cao X, Mokhtarian PL. The causal influence of neighborhood design on physical activity within the neighborhood: Evidence from Northern California. Am J Health Promot. 2008;22(5):350–8. doi: 10.4278/ajhp.22.5.350. [DOI] [PubMed] [Google Scholar]
- 18.Lee I-M, Ewing R, Sesso HD. Relationship between the built environment and physical activity levels: The Harvard Alumni Health Study. Am J Prev Med. 2009;37(4):293–8. doi: 10.1016/j.amepre.2009.06.007. [DOI] [PMC free article] [PubMed] [Google Scholar]
- 19.Burnett V. Relenting on car sales, Cuba turns notorious clunkers into gold. NY Times; Nov 6, 2011. A1. http://www.nytimes.com/2011/11/06/world/americas/relenting-on-car-sales-cuba-turns-notorious-clunkers-into-gold.html?pagewanted=all&_r=0. [Google Scholar]
- 20.Franco M, Orduñez P, Caballero B, Tapia Granados JA, Lazo M, Bernal JL, et al. Impact of energy intake, physical activity, and population-wide weight loss on cardiovascular disease and diabetes mortality in Cuba, 1980-2005. Am J Epidemiol. 2007;166(12):1374–80. doi: 10.1093/aje/kwm226. [DOI] [PubMed] [Google Scholar]
- 21.Brown BB, Smith KR, Hanson H, Fan JX, Kowaleski-Jones L, Zick CD. Neighborhood design for walking and biking: Physical activity and body mass index. Am J Prev Med. 2013;44(3):231–8. doi: 10.1016/j.amepre.2012.10.024. http://www.sciencedirect.com/science/article/pii/S074937971200880X. [DOI] [PMC free article] [PubMed] [Google Scholar]
- 22.Centers for Disease Control and Prevention (CDC) More people walk to better health: CDC Vitalsigns™. CDC; Atlanta, GA: Aug, 2012. http://www.cdc.gov/vitalsigns/Walking/index.html. [Google Scholar]
- 23.Kruger J, Ham SA, Berrigan D, Ballard-Barbash R. Prevalence of transportation and leisure walking among U.S. adults. Prev Med. 2008;47(3):329–34. doi: 10.1016/j.ypmed.2008.02.018. [DOI] [PubMed] [Google Scholar]
- 24.Reis RS, Hino AAF, Parra DC, Hallal PC, Brownson RC. Bicycling and walking for transportation in three Brazilian cities. Am J Prev Med. 2013;44(2):e9–e17. doi: 10.1016/j.amepre.2012.10.014. http://www.sciencedirect.com/science/article/pii/S0749379712007994. [DOI] [PMC free article] [PubMed] [Google Scholar]
- 25.Rodríguez DA. Active transportation: Making the link from transportation to physical activity and obesity. Active Living Research: A national program of the Robert Wood Johnson Foundation; San Diego, CA: 2009. http://www.activelivingresearch.org/files/ALR_Brief_ActiveTransportation_0.pdf. [Google Scholar]
- 26.Sallis JF, Frank LD, Saelens BE, Kraft MK. Active transportation and physical activity: Opportunities for collaboration on transportation and public health research. Transp Res Part A Pol Pract. 2004;38(4):249–68. [Google Scholar]
- 27.Walk Score Walk Score®: How Walk Score works. 2014 http://www.walkscore.com/live-more/
- 28.Miami Downtown Development Authority (DDA) Central Business District: DDA Subdistrict. Miami DDA; Miami, FL: 2013. http://miamidda.com/pdf/2013DDA_DistrictProfile_CBDcloseup.pdf. [Google Scholar]
- 29.Goodkin LM, Werley CA, Decade of Change: Downtown Miami Area, 2001-2011 . Downtown Development Authority District and Adjacent Areas of Influence. Goodkin Consulting. (Prepared for Miami Downtown Development Authority); Miami, FL: 2012. http://miamidda.com/pdf/DwntwnMiami_Decade-of-Change04202012.pdf. [Google Scholar]
- 30.Carr LJ, Dunsiger SI, Marcus BH. Validation of Walk Score for estimating access to walkable amenities. Br J Sports Med. 2011;45(14):1144–8. doi: 10.1136/bjsm.2009.069609. [DOI] [PMC free article] [PubMed] [Google Scholar]
- 31.Duncan DT, Aldstadt J, Whalen J, Melly S, Gortmaker SL. Validation of Walk Score® for estimating neighborhood walkability: an analysis of four US metropolitan areas. Int J Environ Res Public Health. 2011;8(11):4160–79. doi: 10.3390/ijerph8114160. [DOI] [PMC free article] [PubMed] [Google Scholar]
- 32.Pivo G, Fisher J. The walkability premium in commercial real estate investments. Real Estate Econ. 2011;39(2):185–219. [Google Scholar]
- 33.Carr LJ, Dunsiger SI, Marcus BH. Walk Score™ as a global estimate of neighborhood walkability. Am J Prev Med. 2010;39(5):460–3. doi: 10.1016/j.amepre.2010.07.007. [DOI] [PMC free article] [PubMed] [Google Scholar]
- 34.Manaugh K, El-Geneidy AM. Validating walkability indices: How do different households respond to the walkability of their neighbourhood? Transp Res Part D Transp Environ. 2011;16(4):309–15. http://dx.doi.org/10.1016/j.trd.2011.01.009. [Google Scholar]
- 35.Jilcott Pitts SB, McGuirt JT, Carr LJ, Wu Q, Keyserling TC. Associations between body mass index, shopping behaviors, amenity density, and characteristics of the neighborhood food environment among female adult Supplemental Nutrition Assistance Program (SNAP) participants in eastern North Carolina. Ecol Food Nutr. 2012;51(6):526–41. doi: 10.1080/03670244.2012.705749. [DOI] [PubMed] [Google Scholar]
- 36.Hirsch JA, Moore KA, Evenson KR, Rodríguez DA, Diez Roux AV. Walk Score® and Transit Score® and walking in the Multi-Ethnic Study of Atherosclerosis. Am J Prev Med. 2013;45(2):158–66. doi: 10.1016/j.amepre.2013.03.018. [DOI] [PMC free article] [PubMed] [Google Scholar]
- 37.Craig CL, Marshall AL, Sjöström M, Bauman AE, Booth ML, Ainsworth BE, et al. International physical activity questionnaire: 12-country reliability and validity. Med Sci Sports Exerc. 2003;35(8):1381–95. doi: 10.1249/01.MSS.0000078924.61453.FB. [DOI] [PubMed] [Google Scholar]
- 38.Baecke JAH, Burema J, Frijters JER. A short questionnaire for the measurement of habitual physical activity in epidemiological studies. Am J Clin Nutr. 1982;36(5):936–42. doi: 10.1093/ajcn/36.5.936. [DOI] [PubMed] [Google Scholar]
- 39.Folsom AR, Arnett DK, Hutchinson RG, Liao F, Clegg LX, Cooper LS. Physical activity and incidence of coronary heart disease in middle-aged women and men. Med Sci Sports Exerc. 1997;29(7):901–9. doi: 10.1097/00005768-199707000-00009. [DOI] [PubMed] [Google Scholar]
- 40.MacKinnon DP, Lockwood CM, Hoffman JM, West SG, Sheets V. A comparison of methods to test mediation and other intervening variable effects. Psychol Methods. 2002;7(1):83–104. doi: 10.1037/1082-989x.7.1.83. [DOI] [PMC free article] [PubMed] [Google Scholar]
- 41.Arbuckle JL. AMOS 6.0 User’s Guide. Spring House, PA: 2005. [Google Scholar]
- 42.Kline RB. Principles and Practice of Structural Equation Modeling. 2nd ed. Guilford; New York, NY: 2005. [Google Scholar]


