Abstract
Functional T1ρ mapping has been proposed as a method to assess pH and metabolism dynamics in the brain with high spatial and temporal resolution. The purpose of this work is describe and evaluate a variant of the spin-locked echo-planar imaging (SLEPI) sequence for functional T1ρ mapping at 3T. The proposed sequence rapidly acquires a time series of T1ρ maps with 4.0 sec temporal resolution and 10 slices of volumetric coverage. Simulation, phantom, and in vivo experiments are used to evaluate many aspects of the sequence and its implementation including fidelity of measured T1ρ dynamics, potential confounds to the T1 response, imaging parameter tradeoffs, time series analysis approaches, and differences compared to BOLD fMRI. It is shown that the high temporal resolution and volumetric cove of the sequence are obtained with some expense including underestimation of the T1ρ response, sensitivity to T1 dynamics, and reduced signal-to-noise ratio. In vivo studies using a flashing checkerboard fMRI paradigm suggest differences between T1ρ and BOLD activation pattern Possible sources of the functional T1ρ response and potential sequence improvements are discussed. The capability of T1ρ to map whole-brain pH and metabolism dynamics with high temporal and spatial resolution is potentially unique and warrants further investigation and development.
Keywords: T1rho, BOLD, fMRI, metabolism, pH, dynamics
Introduction
Quantitative MRI mapping of T1ρ (T1 relaxation in the rotating frame) is an emerging technique to assess structural and functional properties of the brain. Compared to the more routinely measured T1, T2, and T2* relaxation parameters, T1ρ is unique in that it is sensitive to slow dynamic processes such as pH- and concentration-dependent chemical exchange between bulk water and proteins [1,2]. In the brain, T1ρ mapping has been investigated as a biomarker and novel contrast mechanism for neurological diseases [3,4], stroke [5], and tumors [6]. Another potential application of T1ρ mapping is functional imaging of non-hemodynamic neural-evoked activity [7,8]. This approach aims to use the sensitivity of T1ρ to chemical exchange to dynamically image activity-dependent changes in pH or metabolite concentrations while suppressing sensitivity to BOLD and other hemodynamic-based contrasts. Relative to MR spectroscopy, which is also sensitive to pH and metabolites, functional T1ρ mapping offers higher spatial and temporal resolution and greater anatomical coverage.
To assess neural-evoked activity with functional T1ρ mapping in a manner similar to BOLD fMRI, it is desirable to acquire T1ρ maps at multiple slices with temporal resolution on the order of seconds. However, T1ρ mapping is a slow imaging technique. Multiple spin-lock times (TSLs) must be acquired to quantify T1ρ, and the use of lengthy non-selective spin-lock RF pulses requires extended repetition times (TRs) to limit heating, T1 weighting, and loss of signal-to-noise ratio (SNR). Many pulse sequence advances have been made over the past decade to reduce the acquisition time and extend the spatial coverage of T1ρ mapping at high field strength [9-13]. For functional T1ρ mapping, the spin-locked echo-planar imaging (SLEPI) sequence offers a compact single-shot readout and multi-slice volumetric coverage [13]. The SLEPI sequence has previously been used to image T1ρ-weighted single-slice, single-TSL functional images with 2.0 sec temporal resolution as a means to enhance BOLD contrast [14]. However, for functional T1ρ mapping, in which the dynamics of the T1ρ relaxation time itself are of interest, typical SLEPI imaging parameters provide insufficient temporal resolution. For example, a single 10-slice, four-TSL T1ρ map with 2.0 sec per TSL slice requires an 80 sec acquisition time.
In the initial demonstration of in vivo functional T1ρ mapping by Magnotta et al. [7], the SLEPI sequence was enhanced to improve the temporal resolution of 10-slice T1ρ maps to 6.0 sec. This was accomplished by reducing the acquisition time per TSL slice to 200 ms and dynamically switching three TSLs in succession. This prior study focused on the motivation and feasibility of functional T1ρ mapping, but details of the high-temporal-resolution SLEPI acquisition strategy and its advantages and limitations were not provided. The purpose of the present study is to describe and evaluate this functional T1ρ mapping sequence. Simulation, phantom, and in vivo studies are used to investigate the fidelity of measured T1ρ dynamics, potential confounds, and time series analysis approaches.
Methods
Functional T1p Mapping Sequence
Robust functional T1ρ mapping of the brain requires a number of imaging properties. First, temporal resolution must be sufficiently high to capture a stimulus-evoked response function and allow many repetitions of imaging to improve detection of the dynamic contrast. Second, 3D brain coverage is needed to correct for motion of the head over the course of an extended time series and enable probing of activation over a large portion of the brain. Third, confounding activation mechanisms such as BOLD contrast must be taken into account. Lastly, preparatory spin-lock RF pulses must be sufficiently restricted to limit specific absorption rate (SAR) to an acceptable level. These imaging properties are in competition and must be balanced.
In this work, a spin-locked SE-EPI sequence is investigated for functional T1ρ mapping (Fig. 1). For each sequentially-acquired slice, the sequence consists of fat saturation preparation, self-compensating spin-lock preparation with a specific TSL as described by Charagundla et al. [15], a single-shot SE-EPI readout, and a TSL-dependent delay to fix the time between slice acquisitions (τ) to be TR/N, where N is the number of slices. After each TR interval, the TSL is switched to a new value and the sequence is repeated. For all experiments in this study only two unique TSLs are acquired to maximize the temporal resolution of the T1ρ maps. A SE-EPI readout with minimal echo time (TE) is used to reduce T2* (i.e., BOLD) weighting.
Fig. 1.
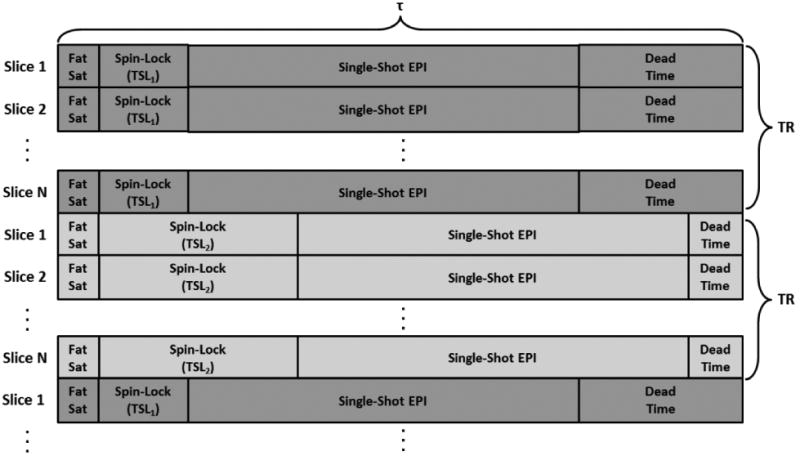
Functional T1ρ mapping sequence components. Fat saturation and spin-lock preparation pulses are played out for each slice of the EPI acquisition. The spin-lock pulse has a specific spin-lock time (TSL). This is followed by a traditional EPI sequence with a single-shot readout. This sequence is repeated for each slice of the N-slice EPI acquisition. The time to acquire a single slice is τ, and the time to acquire all N slices is TR. The sequence investigated in this work uses N=10, τ=200 ms, and TR=2000 ms. After all slices are acquired, the sequence is repeated with a different TSL. The TSLs are alternated every TR for the full time series, enabling generation of T1ρ maps with temporal resolution 2*TR for a two-TSL acquisition. If the spin-lock preparation pulses were removed, then the sequence would match that of a standard BOLD fMRI acquisition. Note that the sequence component times are not to scale.
Typically it is assumed that the measured signal S of TSL images will exhibit mono-exponential decay as governed by the equation:
| (1) |
where S0 is the signal in the absence of spin locking (i.e., TSL=0 ms). S0 is assumed to be constant for all TSLs of the fit, includes the effects of standard EPI sequence T1 recovery and T2 and T2* decay on the signal, and in theory provides an equivalent measure of signal dynamics as a SE-EPI BOLD fMRI sequence. Therefore, S0 will ideally capture any dynamic changes in T1, T2, and T2* (including BOLD contrast) and the T1ρ term will be uncontaminated by these confounds. However, the functional T1ρ mapping sequence signal will depart from the behavior of Eq. (1) for two reasons: first, the short τ of the sequence (˜200 ms) leaves insufficient time for complete recovery of the longitudinal magnetization Mz (i.e., τ≪≪T1), therefore a steady state signal that depends on both τ and TSL will be developed; and second, each switching of the TSL will disrupt the steady state signal. Using the Bloch equations, the TSL-specific steady state signal S is:
| (2) |
The typical spin-lock weighting is modulated by the term in parentheses, which is a function of TSL, T1ρ, τ, and T1. Dynamic changes in these parameters will alter the calculated T1ρ using the traditional log-linear fit of Eq. (1). An aim of this work is to determine the effect of this modulating term on measured T1ρ dynamics when applying the functional T1ρ mapping sequence to imaging of brain matter.
Simulations
To determine the fidelity of dynamic T1ρ measurements using the high-temporal-resolution SLEPI sequence, simulations of the longitudinal magnetization time evolution Mz(t) were performed using the Bloch equations. A 10-slice (N=10) sequence with TSL=10 and 50 ms, τ=200 ms, TR=2000 ms, and Mz(0)=1.0 was used, and typical 3T brain tissue relaxation parameters of T1ρ=75 ms and T1=1500 ms were assumed [14,16]. These parameters are similar to those used in the prior functional T1ρ mapping feasibility study [7] and the phantom and in vivo experiments described below. Eq. (1) was used to calculate T1ρ for each slice, with the measurable signal S of each TSL taken to be the value of Mz(t) immediately after spin-lock preparation (i.e., at the time of the slice-selective excitation pulse). Sequence measurements of T1ρ dynamics were assessed by varying the true T1ρ value to simulate a functional T1ρ response.
The influence of potential confounds on the functional T1ρ response was also assessed for the described τ=200 ms sequence at the steady-state signals given by Eq. (2). Due to the modulating term in Eq. (2), changes in T1 will cause a change in the measured T1ρ relaxation time. Both changes that can occur between TSL measurements (i.e., within a 2.0 sec window in a two-TSL acquisition) and from one map to another (i.e., over more than a 2.0 sec window) were studied. Changes in the S0 parameter in Eq. (2) within the 2.0 sec between-TSL window were also considered (changes in S0 from one map to another will not alter the measured T1ρ value). Finally, a known hemodynamic contributor to the functional T1ρ response is a change in cerebral blood volume (CBV) due to the longer T1ρ of blood relative to brain tissue (˜110 ms vs. 75 ms) [1,14]. This is the basis of the T1ρ-weighted BOLD fMRI approach described by Hulvershorn et al [14]. To determine the sensitivity of T1ρ dynamics to changes in CBV, the percent change in T1ρ due to changes in blood volume fraction were calculated using the model described by Hulvershorn et al. (Eq. 4 in Ref [14]).
To investigate sequence tradeoffs between temporal resolution, volumetric coverage, SNR, and T1ρ fidelity, the Mz(t) simulations described above were performed for a range of τ and N values. Sequence-specific T1ρ SNR, measurements, and dynamic responses were compared to the ideal case of complete longitudinal magnetization recovery (i.e., τ≫≫T1). T1ρ SNR was defined as T1ρ/σ, where T1ρ and σ were calculated using the signal measurements for each TSL and propagation of error using the two-TSL log-linear relationship of Eq. (1). T1ρ was measured assuming a true time of 75 ms, and the T1ρ dynamic response was calculated for a 1% change in the true T1ρ value.
Phantom Experiments
Two phantom experiments were performed to validate the T1ρ fidelity simulations for the N=10, τ=200 ms functional T1ρ mapping sequence and to assess the effectiveness of the spin-lock preparation pulse to detect contrast specific to T1ρ. First, a homogeneous agar phantom with T1 and T2 relaxation times similar to brain tissue was imaged with the functional sequence using a 3T MRI system (Magnetom Trio; Siemens Healthcare; Erlangen, Germany) and the following parameters: FOV=24×24 cm2; matrix=64×64; resolution=3.8×3.8 mm2; slice thickness/gap=5.0/1.25 mm; slices=10; TR/TE=2000/15 ms; L/R partial Fourier=5/8; B1SL frequency=213 Hz; and TSL=10 and 50 ms. The TSLs were dynamically switched every TR for a total of ten TR intervals, yielding five TSL pairs. A T1ρ map was calculated using Eq. (1) and images from the last TSL repetition cycle, and a region-of-interest (ROI) analysis was performed to determine the mean T1ρ value of each phantom slice. Processing was performed using Matlab (MathWorks; Natick, MA). The phantom was also imaged with long-TR 2D techniques to determine reference T1ρ and T1 values for estimation of the slice-dependent T1ρ relaxation time using the Bloch equation simulation. For measurement of T1, an inversion-recovery spin-echo sequence was used with TIs ranging from 50 to 1000 ms. For T1ρ, a spin-locked spin-echo sequence was used with TSLs ranging from 10 to 50 ms. Experimental and simulation functional T1ρ values were then compared.
For the second experiment, five 50 mL vials were filled with liquid egg white and either 0, 250, 500, 750, or 1000 μL of 1.0 M hydrochloric acid (HCl) to vary the pH-dependent T1ρ relaxation time. The vials were placed in a container of water and imaged using 2D techniques to generate reference T1ρ and T2 maps with the following imaging parameters: FOV=12.8×12.8 cm2; sampling matrix=128×64 for T2 and 128×128 for T1ρ; and TR/TE=5000/12 ms. T2 was quantified using TE=30, 50, 75, 100, and 150 ms, and T1ρ was quantified using B1SL frequency=330 Hz and TSL=10, 30, 50, 70, 90, and 110 ms. Functional imaging was performed using the same sequence as the agar phantom experiment except 140 images were acquired, yielding 70 T1ρ and S0 maps by fitting each pair of TSL images using Eq. (1). The average time series T1ρ map was compared to the reference 2D T1ρ and T2 maps. ROI analysis was used to compare the percent change of vial T1ρ vials imaged using both the reference and functional sequences. To assess how well the S0 parameter is fit by Eq. (1), the functional sequence was repeated without spin-lock preparation, yielding 140 reference S0 maps (this is equivalent to a SE-EPI BOLD fMRI acquisition). The average reference S0 map was then qualitatively compared to the average fit S0 map using the functional SLEPI time series. After completion of the imaging experiments, the pH values of the phantom vials were measured using a glass-membrane pH probe (Accumet AB15; Fischer Scientific; Pittsburgh, PA). The pH values of each vial corresponding to the above amounts of HCl were measured to be 8.7, 8.1, 7.5, 7.2 and 6.9 pH units, respectively.
In Vivo Experiments
To assess the functional response provided by the N=10, τ=200 ms functional T1ρ mapping sequence in vivo, three research participants (3 males aged 29 to 33 y/o) were imaged using the same MRI system and imaging parameters as the phantom experiments after providing written informed consent for a protocol approved by our local Institutional Review Board. Imaging was performed using the SE-EPI sequence both with and without spin-lock preparation to compare functional T1ρ mapping and BOLD activation. An oblique orientation was used to center the slab about the visual cortex and frontal lobe. Slices were acquired sequentially, starting at the inferior portion of the slab. For each sequence, a single run consisted of 140 measurements acquired in conjunction with an 8 Hz full-field flashing checkerboard block design to elicit neural activation of the visual cortex. The paradigm consisted of seven 40 sec blocks with alternating rest and visual stimulation conditions, yielding a net of four rest blocks and three stimulation blocks per run. The functional T1ρ mapping sequence was run first followed by the BOLD sequence. This was repeated four times, yielding a total of 560 measurements for each sequence. During the task, the participants were asked to push a button when a red square was displayed at the center of the field of view every 10 sec during the flashing checkerboard stimuli to ensure alertness. One of the participants was additionally imaged on a different day using the functional T1ρ mapping paradigm with 16 consecutive runs to determine how the activation changed with additional averages. This experiment yielded a total of 2240 measurements.
Analysis of the functional time series consisted of standard fMRI processing procedures using Analysis of Functional NeuroImages (AFNI) [17]. The time series were first registered and then blurred using a 5.0 mm FWHM Gaussian kernel. For the functional T1ρ mapping sequence, T1ρ and S0 map time series were then calculated by fitting the TSL images to Eq. (1) using Matlab. These maps were generated using a number of different approaches (Fig. 2), similar to processing methods that have been investigated for arterial spin labeling [18]. First, the maps were generated using every contiguous pair of 10 and 50 ms TSL images (Fig. 2a). Second, the 10 ms TSL images on either side of a given 50 ms image were averaged to yield an estimate of the 10 ms TSL image at the time of the 50 ms image (Fig. 2b). This technique is referred to as “temporal interpolation.” The temporal interpolation method was again repeated with averaging of the 50 ms TSL images to estimate the response at the time of the intermediate 10 ms TSL image (Fig. 2c). Third, a sliding window approach was used to effectively increase the temporal resolution to 2.0 sec by calculating new maps for each new measurement (Fig. 2d). Lastly, temporal interpolation was combined with the sliding window approach (Fig. 2e). These resulting T1ρ and S0 map time series, as well as the BOLD time series, were then analyzed using a generalized linear model with second-order baseline correction and motion nuisance parameter regression to generate statistical activation maps assuming a delayed gamma variate model of the response functions. Activation t-maps were calculated for each time series and thresholded with a voxel-wise significance of p<0.05 (uncorrected). An uncorrected p-value was used to avoid suppression of small activation regions, particularly since the T1ρ response has an unknown activation pattern, may be more localized than the BOLD response, and has relatively low SNR. The t-maps generated using the sliding window approach were scaled to account for the use of repeated samples. Activation percentage (i.e., dynamic response) was determined by dividing the activation response model beta coefficient by the average zeroth-order baseline coefficient for all runs.
Fig. 2.
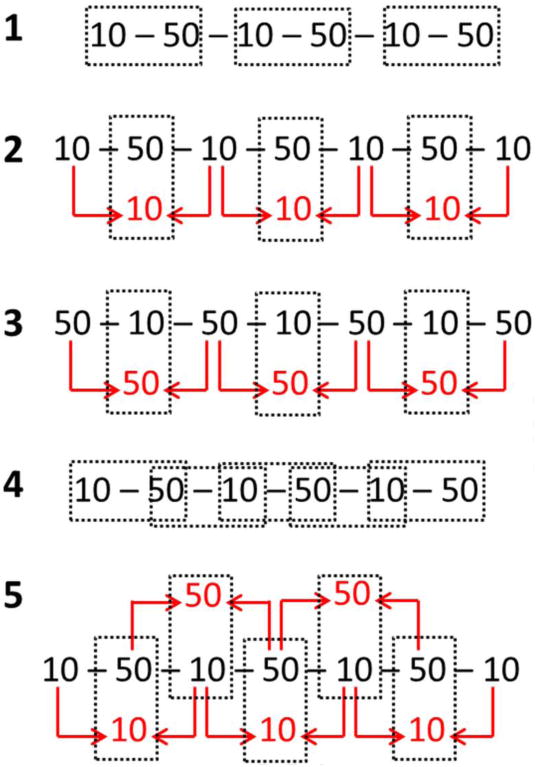
Functional T1ρ mapping time series processing methods. With standard processing (Method 1), T1ρ and S0 maps are calculated using every pair of 10 and 50 ms TSL images (dashed boxes), yielding a frame time of 4.0 sec. With temporal interpolation (Methods 2 and 3), either subsequent 10 ms (Method 2) or 50 ms (Method 3) TSL images are averaged to generate an estimate at the same time as the paired TSL image. This technique also has a 4.0 sec frame time but may provide a better estimate of T1ρ at each time point as well as decrease sensitivity to between-TSL changes in T1 and S0. With sliding window (Method 4), maps are calculated with every new TSL image, yielding a 2.0 sec frame time. Method 5 combines sliding window and temporal interpolation.
To determine which of the five processing methods (Fig. 2) yielded the strongest T1ρ and S0 responses, and to compare these responses to the BOLD response, the visual cortex was manually segmented for each participant and used as a mask to only consider the activated voxels within its boundaries. The first two temporally-acquired functional T1ρ mapping slices were excluded due to their inconsistent measurement of T1ρ (Fig. 3b). Only positively-activated voxels in the visual cortex were considered under the assumption that the BOLD response will increase with the flashing checkerboard stimulus and a majority of hypothesized T1ρ response mechanisms such as increased blood oxygenation, increased CBV, decreased pH, and decreased glucose concentration will cause T1ρ to increase [1,7,8,14]. For each participant and each processing method, the number of positively-activated voxels (p<0.05), mean t-score of the activated voxels, and percentage of activated voxels that overlapped with BOLD-activated voxels were computed. Additionally, the relative number of activated voxels and mean t-scores were computed across the five processing methods to normalize these values for each participant. The processing method with a relative percentage of 100% (i.e., the strongest activation) was considered the best approach.
Fig. 3.
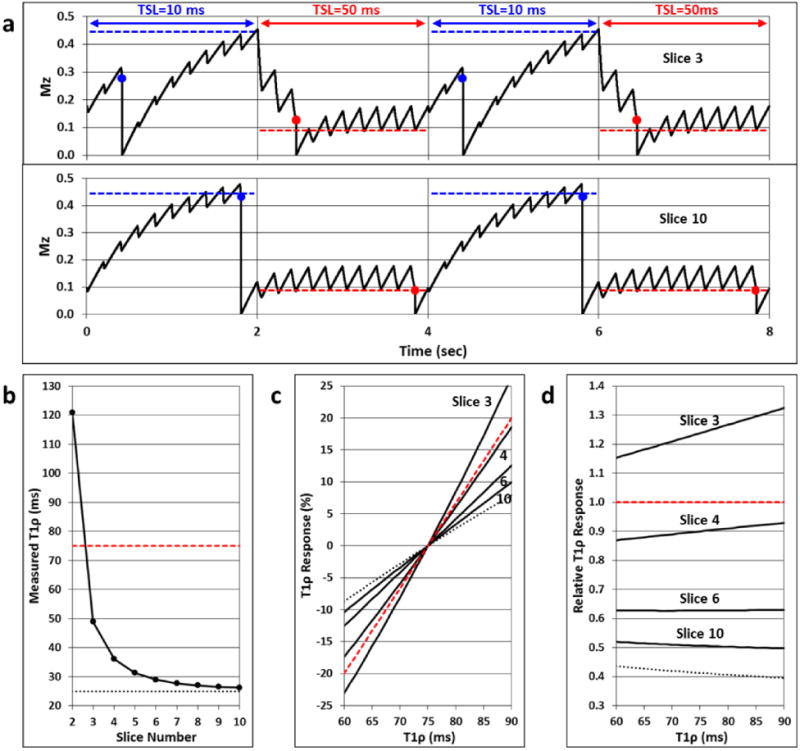
Simulation of T1ρ fidelity for an N=10, τ=200 ms functional T1ρ mapping sequence assuming T1ρ=75 ms and T1=1500 ms. (a) Longitudinal magnetization signal evolution Mz(t) for Slices 3 and 10. The TSL is switched between 10 and 50 ms every TR interval (2.0 sec). The slice-specific measurable TSL signals are indicated by the blue and red dots. For each TSL, Mz(t) approaches a steady-state signal (blue and red dashed lines). The TSL steady-state signals are not reached for Slice 3, but they are nearly reached for Slice 10. (b) Measured T1ρ relaxation time for each of the 10 slices using Eq. (1) and the TSL signals. The true (red dashed line) and sequence steady-state (dotted line) T1ρ values are also shown for comparison. Slices 1 and 2 deviate greatly from the T1ρ steady-state value, but Slices 3 through 10 quickly approach it. (c) Slice-specific T1ρ responses to a dynamic change in the true T1ρ value (±20%). Plots are shown for Slices 3, 4, 6, and 10, and the true (red dashed line) and steady-state (dotted line) responses are indicated. For Slice 10, the response is underestimated by a factor of two. This is shown in (d), which plots the ratio of the slice-specific T1ρ responses to the true response. For a given slice, the relative response is fairly consistent across the range of T1ρ dynamics.
To evaluate the effect of additional averages on the T1ρ and S0 activation maps, the 16-run functional T1ρ mapping time series was processed in the same manner described above applying only the temporal interpolation method with averaging of the 50 ms TSL images (Fig. 2c). The number of activated voxels, mean t-score, mean percent activation compared to baseline, and percentage of T1ρ- and S0-activated voxels that overlapped each other were compared for 4, 8, 12, and 16 runs of data.
Results
Simulations
Results of the T1ρ fidelity simulation with the N=10, τ=200 ms functional T1ρ mapping sequence are shown in Fig. 3. Mz(t) is plotted in Fig. 3a for Slices 3 and 10. For each TSL, Mz(t) approaches a steady-state signal (blue and red dashed lines) as given by Eq. (2). Early slices do not have sufficient time to reach the steady-state signal due to recent switching of the TSL (e.g., Slice 3), whereas latter slices rapidly approach the steady-state signal (e.g., Slice 10). The signal levels for each TSL used to quantify T1ρ (blue and red dots) are therefore slice-dependent. Fig. 3b shows the calculated T1ρ values at Slices 2 through 10, which rapidly approach the steady-state value. The calculated T1ρ values underestimate the true value of 75 ms because there is no correction for the modulating term of Eq. (2). The slice-specific responses to dynamic T1ρ changes are plotted in Fig. 3c. For slices acquired later in the series, the measured dynamic response underestimates the true response by about a factor of two over the T1ρ range (Fig. 3d).
Fig. 4 plots the anticipated steady-state T1ρ responses to potential confounds using the τ=200 ms sequence. For an N=10 sequence, the steady-state response approximates the response at Slice 10, but earlier slices will have a modified response. At steady state, T1 changes between T1ρ measurements (≫2.0 sec window) of +1.0% will cause the measured T1ρ value to change by -0.2% (Fig. 4a). For early slices, this is reduced to -0.1%. Between-TSL changes in T1 and S0 (<2.0 sec window) of +1.0% will result in steady-state T1ρ responses of +0.5% and +0.6%, respectively (Figs. 4b-c). For early slices, these responses are reduced to +0.3% and +0.5%, respectively. Note that for these effects the T1ρ response is approximately linear for T1 and S0 changes up to ±10%. For changes in CBV, the T1ρ response varies approximately linearly with initial blood volume fraction and CBV percent increase (Fig. 4d). With an initial blood volume fraction of 5%, a 20% increase in CBV will result in a steady-state T1ρ response of +0.16%. The slice-specific T1ρ response to changes in CBV will scale relative to the steady-state response as plotted in Fig. 3d. For example, for Slice 6, which has a 50% greater response than steady state, a steady-state T1ρ response of +0.16% would increase to +0.24%.
Fig. 4.
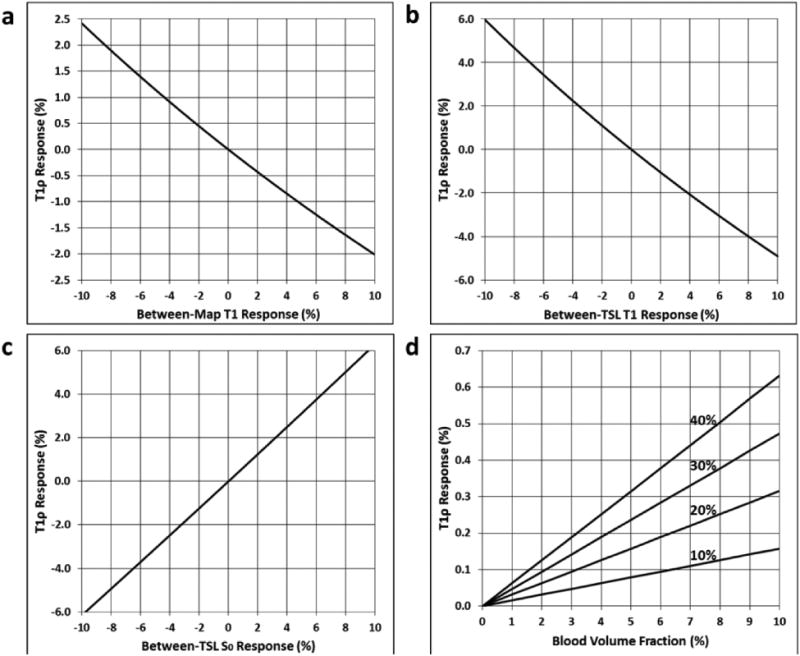
Simulation of potential confounds of the τ=200 ms functional T1ρ mapping sequence steady-state response. Plots show the functional T1ρ responses to changes in: (a) T1 from one T1ρ map to another (≥2.0 sec window); (b) T1 or (c) S0 between TSL images used to generate a given T1ρ map (<2.0 sec window); and (d) initial blood volume fraction as caused by increases in cerebral blood volume (CBV) of 10, 20, 30, or 40%.
Tradeoffs for sequences with varying number of slices N and slice acquisition times τ are shown in Fig. 5. As N increases, volumetric coverage increases and T1ρ SNR also improves for a given τ. However, this comes at the expense of temporal resolution and reduced functional T1ρ response. As τ increases, T1ρ SNR and the fidelity of T1ρ measurements improve but temporal resolution decreases. Comparing two sequences with different N but equivalent temporal resolution (e.g., the N=10, τ=200 ms sequence vs. an N=3, τ=667 ms sequence), the lower N sequence will provide both higher T1ρ SNR and greater T1ρ response.
Fig. 5.
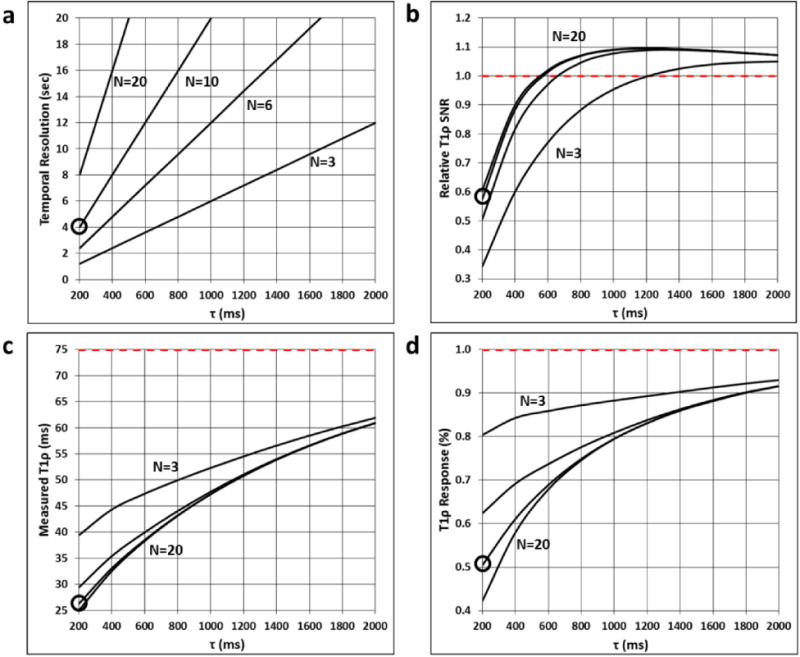
Functional T1ρ mapping sequence tradeoffs for different numbers of slices N and slice acquisition times τ. (a) Temporal resolution, (b) T1ρ SNR relative to a sequence with τ≫≫T1, (c) measured T1ρ relaxation time, and (d) functional T1ρ response to a 1% change in the true T1ρ value of 75 ms are plotted vs. τ for the final slice of N=3, 6, 10, and 20 sequences. Ideal values are shown as red dashed lines. The results for the N=10, τ=200 ms sequence investigated in this work are circled.
Phantom Experiments
The first phantom experiment confirmed that the functional T1ρ mapping sequence follows the model put forth by Eq. (2). Using the reference 2D sequences, phantom mean T1ρ and T1 values were measured to be approximately 50 and 850 ms, respectively. Simulation and experimental T1ρ values are plotted in Fig. 6 for Slices 2-10 and show close agreement.
Fig. 6.
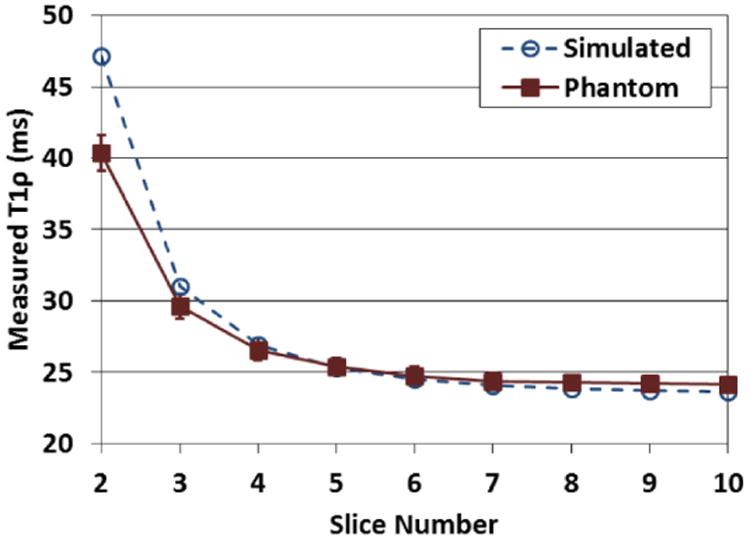
Simulated and measured T1ρ values vs. slice number of a phantom imaged using the N=10, τ=200 ms functional T1ρ mapping sequence. Error bars show the standard deviation of the T1ρ values in the analysis ROI. The experimental results support the simulation model.
Results of the second phantom experiment are shown in Fig. 7. The functional T1ρ mapping sequence shows a similar trend in T1ρ values for the five vials as the reference 2D SE acquisition (Figs. 7a-c). Plots of the measured percent change in T1ρ for each vial relative to the pH=7.5 vial show that the functional sequence underestimates the T1ρ response by approximately a factor of two, which is consistent with the simulation results (Fig. 3d). The sensitivity of the spin-lock preparation pulse to chemical exchange processes is supported by Fig. 7d, which shows that the T2 map does not exhibit the same pH dependence as the T1ρ maps in Figs. 7a-b. Comparison of the functional and reference S0 maps show similar results (Figs. 7e-f), demonstrating that the functional T1ρ mapping sequence is able to separate the S0 and T1ρ components of Eq. (1).
Fig. 7.
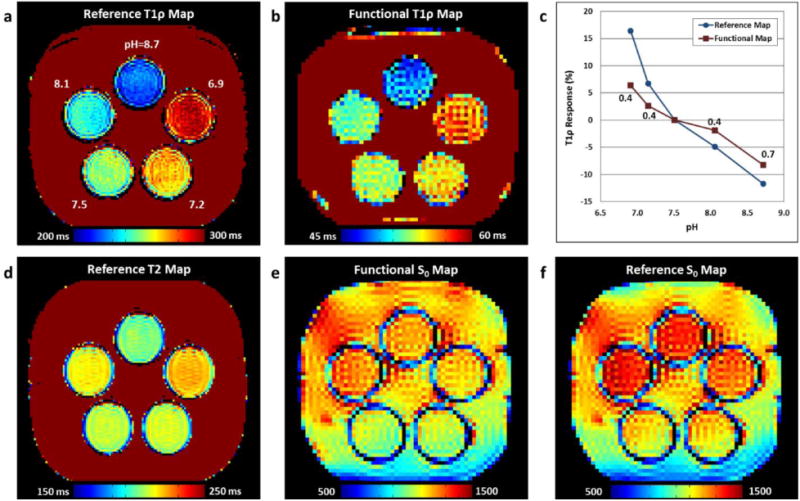
pH phantom comparison of the functional T1ρ mapping and reference sequences. (a,b) T1ρ maps acquired using the reference and functional sequences. The measured vial pH values are indicated in (a). The functional sequence image appears similar to the reference image. (c) Plot of T1ρ percent change vs. pH relative to the pH=7.5 vial for the reference (blue circles) and functional T1ρ mapping (red squares) sequences. The ratio between the functional and reference sequences responses are indicated for each pH value. (d) Reference T2 map showing different contrast than the T1ρ maps in (a) and (b). (e,f) SE-EPI signal maps measured using functional T1ρ mapping (as quantified by S0) and a sequence without spin-lock preparation. The maps appear similar.
In Vivo Experiments
All three participants had positive functional T1ρ, S0, and BOLD activation in the visual cortex. Activation statistics for each participant are shown in Table 1. For all participants, the S0 and BOLD activation regions had greater overlap (˜88%) than the T1ρ and BOLD activation regions (˜75%), and S0 had a stronger functional response than T1ρ when considering both the number of activated voxels and the mean t-score of their respective activation regions. The mean functional T1ρ response was approximately 0.47% for all participants.
Table 1.
Functional activation statistics for the three in vivo studies.
| Participant | 1 | 2 | 3 |
|---|---|---|---|
| Total Voxels | 1430 | 859 | 820 |
| T1p: | |||
| Activated Voxels | 388 | 148 | 182 |
| Mean t-Score | 3.8 | 3.3 | 3.3 |
| Mean Response | 0.46% | 0.49% | 0.47% |
| BOLD Overlap | 66.0% | 69.6% | 81.3% |
| S0: | |||
| Activated Voxels | 377 | 254 | 360 |
| Mean t-Score | 4.7 | 3.4 | 4.0 |
| Mean Response | 0.54% | 0.42% | 0.58% |
| BOLD Overlap | 87.0% | 83.1% | 91.4% |
| BOLD: | |||
| Activated Voxels | 578 | 431 | 500 |
| Mean t-Score | 7.1 | 6.5 | 6.1 |
| Mean Response | 0.43% | 0.41% | 0.57% |
Statistics are recorded for the T1ρ and S0 time series using the TSL=50 ms temporal interpolation method. Only positively activated voxels within the visual cortex with a significance threshold of p<0.05 (uncorrected) are included in the statistics. “Total Voxels” is the number of voxels included in the visual cortex mask.
Comparisons of the five processing methods are shown in Fig. 8. On average, temporal interpolation yielded the greatest number of activated voxels and mean t-scores for both T1ρ and S0. T1ρ had greater activation with interpolation of the 50 ms vs. the 10 ms TSL images, and the reverse was true for S0. Sliding window yielded greater activation when combined with temporal interpolation than without.
Fig. 8.
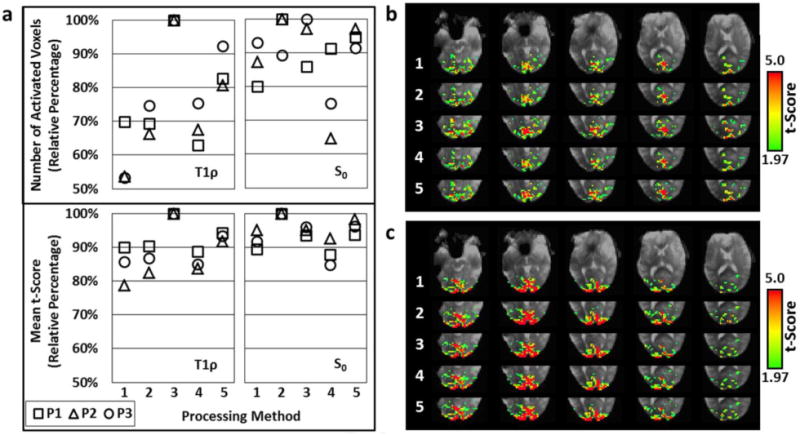
Comparison of the five processing methods shown in Fig. 2 for the in vivo functional T1ρ mapping studies. Both the T1ρ and S0 time series were assessed. (a) Plots of the relative number of positively-activated voxels (p<0.05) and mean t-scores in the visual cortex using each method. Data is shown for each participant (P1 (squares), P2 (triangles), and P3 (circles)). (b) T1ρ and (c) S0 activation maps for Participant 1 (P1) generated using each method with five slices shown. For processing of the T1ρ time series, Method 3 (temporal interpolation of the 50 ms TSL images) provided the greatest activation. For the S0 time series, Method 2 was the best (temporal interpolation of the 10 ms TSL images).
BOLD, S0, and T1ρ activation maps for Participant 1 are shown in Fig. 9a. The S0 and T1ρ maps were generated using the TSL=50 ms temporal interpolation method. The S0 activation pattern has a similar appearance as the BOLD activation pattern, whereas the T1ρ activation pattern appears distinct. Fig. 9b shows maps of the ˜25% of activated T1ρ voxels for each participant that did not overlap the BOLD activation region using the TSL=50 ms temporal interpolation method. Most of this T1ρ-specific activation appears in superior slices and near the surface of the visual cortex.
Fig. 9.
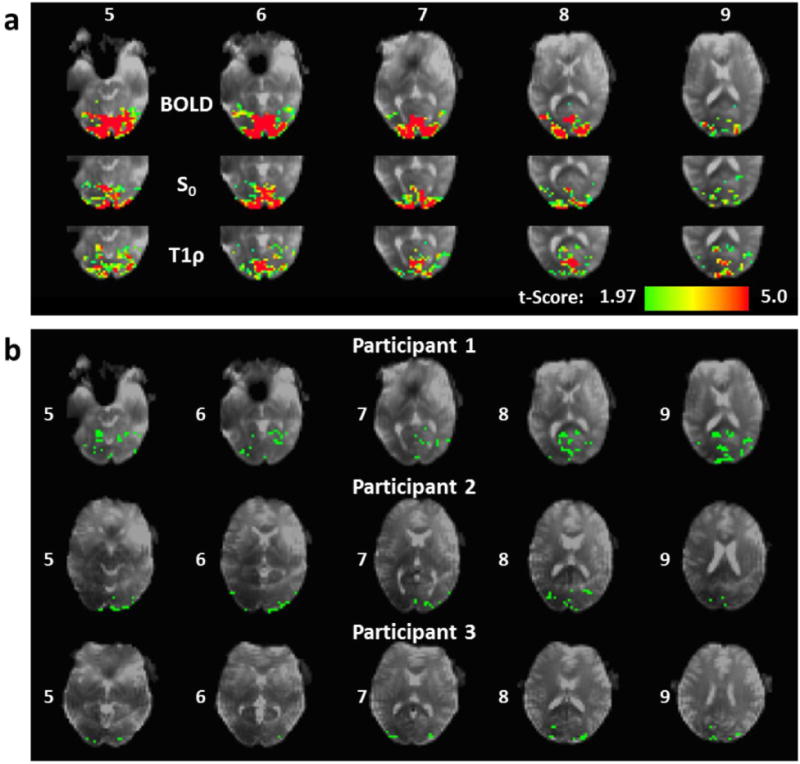
In vivo comparison of the functional T1ρ mapping and BOLD sequence activation regions. (a) BOLD, S0, and T1ρ activation maps for Participant 1. The maps were thresholded with a significance level of p<0.05 (uncorrected). Six consecutive slices are shown with the slice numbers indicated. (b) Maps of T1ρ activation voxels (green) that were unique to the BOLD activation region for all three participants. Only positively activated voxels within the visual cortex are shown. Slices numbers are indicated.
S0 and T1ρ activation statistics vs. number of runs for Participant 1 processed with the TSL=50 ms temporal interpolation method are shown in Fig. 10. The number of activated voxels and mean t-scores increased for both maps as additional runs were performed. The number of T1ρ map activated voxels approximately doubled from 4 to 16 runs, whereas the S0 activation region was more stable. 75% more voxels were activated with T1ρ vs. S0 with 16 runs. The mean T1ρ and S0 responses decreased with additional runs, which is consistent with increased detectability of weaker activations with higher statistical power. The S0 response was stronger than the T1ρ response (0.55% vs. 0.46% at 4 runs and 0.43% vs. 0.37% at 16 runs). At 16 runs, 80% of the S0 map activation voxels overlapped the T1ρ activation region, which is double the 40% overlap at 4 runs. On the other hand, T1ρ map activation voxels only overlapped 50% of the S0 activation region at 16 runs, up from 40% at 4 runs.
Fig. 10.
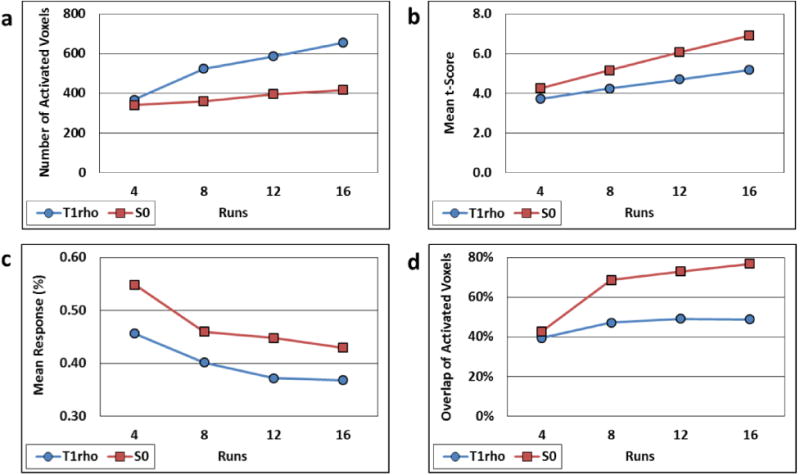
Comparison of in vivo T1ρ (blue circles) and S0 (red squares) map activation statistics derived from different numbers of time series runs for Participant 1. (a-c) Number of activated voxels, mean t-scores, and mean response vs. number of runs, respectively. (d) Percentage of the number of T1ρ-activated voxels that overlap S0-activated voxels (blue circles) and vice versa (red squares).
Fig. 11 shows T1ρ and S0 activation and overlap maps comparing the 4- and 16-run data for Participant 1. As expected, the activation regions became better-defined with more runs, but the boundaries are fairly consistent. The activation patterns have a similar appearance to the data shown in Fig. 9a, which was acquired for the same participant on a different day. After 16 runs, few voxels are unique to S0, whereas T1ρ has a noticeably larger activation region, particularly in the superior slices (e.g., Slices 7-9).
Fig. 11.
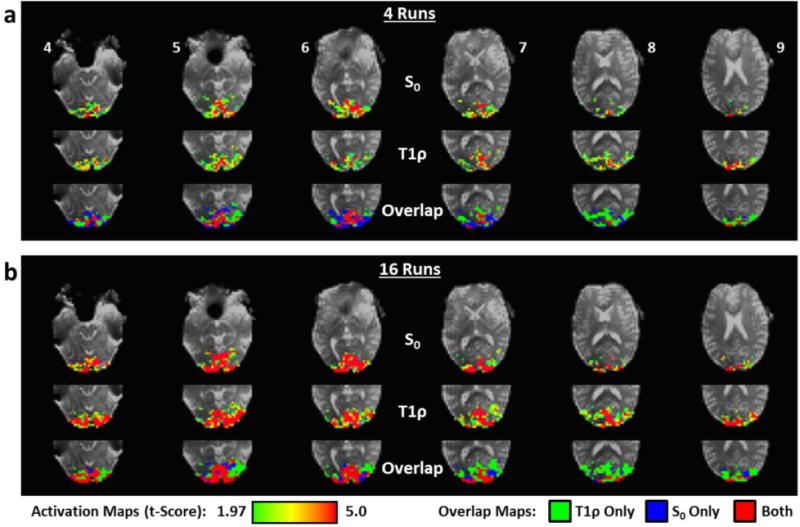
S0 and T1ρ activation t-maps maps for Participant 1 including (a) 4 runs and (b) 16 runs of data. Activation maps were thresholded at a significance level of p<0.05 (uncorrected). The overlap of S0 and T1ρ activation maps is also shown with indication of shared activation voxels (red) and voxels unique to S0 (blue) and T1ρ (green). Only positively activated voxels within the visual cortex were considered in this analysis. The slice numbers are indicated.
Discussion
A modified SLEPI sequence has been described and evaluated for functional T1ρ mapping of the brain. The sensitivity of the sequence to T1ρ dynamics was simulated and confirmed in phantom experiments, and the in vivo studies evaluated the functional T1ρ response to a flashing checkerboard stimulus. The primary advantages of this functional T1ρ mapping sequence are its high temporal resolution (4.0 sec) and volumetric coverage (10 slices), which enable T1ρ dynamics to be probed in vivo using fMRI paradigms. Compared to typical SLEPI imaging parameters, these speed gains are obtained at the expense of SNR (reduced by 40%), slice-specific underestimation of the T1ρ response (reduced by ≤50%), and sensitivity to T1 dynamics. The cost of high temporal resolution can be reduced by acquiring fewer slices.
The in vivo studies suggest that the neural-evoked activities detected by the functional T1ρ mapping sequence vs. BOLD fMRI are different. For all three participants, there was high degree of overlap of the S0 and BOLD activation regions (83-91%), whereas the overlap of the T1ρ and BOLD activation regions was lower (66-81%). The strong similarity between the S0 and BOLD regions supports that S0 effectively captures changes in BOLD contrast, whereas the differences between T1ρ and BOLD regions suggest that the T1ρ is sensitive in part to dynamic processes that are not detectable by BOLD fMRI. These observations are further supported by the 16-run data, which showed that that T1ρ activation is different than S0 activation and, by inference, BOLD activation. Despite a 75% growth of the T1ρ activation region from 4 to 16 runs, its overlap with the S0 activation region only increased 10%. At 16 runs, 50% of the T1ρ activation voxels were unique to the S0 activation region, the majority of which were located superiorly to the S0 activation region. These results have a number of potential implications. First, metabolic sources of T1ρ dynamics may be more subtle than hemodynamic drivers, which may explain why the activation region rapidly increased with more runs. Second, T1ρ may be more sensitive to upstream arterial blood dynamics than BOLD, which may contribute to the more superiorly located activation. Third, the statistical power of the T1ρ activation may be improved by developing an impulse response function that better models the non-BOLD dynamics.
It is hypothesized that the functional T1ρ response is driven by both tissue (e.g., pH and metabolism) and vascular (e.g., CBV) components, but to what extent is unknown. It was shown that, for a typical CBV response (5% initial blood volume fraction and 20% change in CBV [19]), the functional T1ρ response using the sequence described in this work is estimated to be ˜0.24%. This accounts for about half of the 0.47% average functional T1ρ response observed in the in vivo studies. The other half of the response could be due to a larger CBV response, as was assumed in the study by Hulvershorn et al. (8% blood volume fraction and 40% CBV response) [14], or T1ρ-sensitive chemical exchange processes. In work performed at a field strength of 9.4T, others evaluated the T1ρ vs. BOLD response in cat and rat visual cortex gray matter using a flashing checkerboard stimulus [8]. It was estimated that the components of the T1ρ response were 1/3 vascular and 2/3 tissue. The source of the T1ρ tissue response was hypothesized to be due to changes in metabolite concentrations such as glucose. An alternative hypothesis is that neural-evoked acidosis is the source of this tissue component [7]. The sensitivity of the functional T1ρ response to non-hemodynamic effects has further been supported in preliminary studies. One study demonstrated significant functional T1ρ differences in panic disorder that were not seen with BOLD fMRI [20], and another showed the temporal response of T1ρ preceded that of both BOLD and ASL [21]. More investigation is needed in controlled environments to sort out the various contributing factors to the functional T1ρ response.
The utility of functional T1ρ mapping hinges on its ability to measure non-hemodynamic contrast with high spatial and temporal resolution. To this end, the technique will benefit from technical advancements to increase SNR, volumetric coverage, and sensitivity and specificity of the T1ρ response. Experiments that suppress blood effects via saturation pulses or iron oxide nanoparticles can improve the specificity of the T1ρ response to tissue, as recently explored [8]. Sensitivity can be improved by tuning the spin-lock pulse to a particular frequency range (e.g., hydroxyl chemical exchange) or effect (e.g., pH) of interest. Multiband excitation, which simultaneously acquires multiple slices of an EPI acquisition for improved imaging efficiency [22,23], can enable three or more slices to be imaged with every spin-lock preparation. This gain in efficiency could be used to triple the interslice duration (τ) for the same net acquisition time, enabling improved SNR, better fidelity of T1ρ dynamics, and reduced sensitivity to T1 dynamics. This time-savings could also be used to acquire more than 10 slices for increased volumetric coverage. 3D EPI strategies may also enable higher SNR, greater volumetric coverage, and more flexibility in applying preparation pulses [24-26]. SNR may also be improved by moving the spin-lock pulse inside the slice excitation pulse, albeit with the additional confound of T2ρ weighting [11].
This work highlights some practical considerations for performing functional T1ρ mapping. First, to maximize the temporal resolution, the number of TSLs should be minimized.This also has the benefit of reducing the temporal window within which changes in S0 and T1 can confound the T1ρ measurement. Second, when using two TSLs, it was shown that temporal interpolation of the longer TSL images yields the strongest T1ρ response. This is due to the improved T1ρ precision obtained when averaging the longer versus the shorter TSL images [27]. The opposite is true for S0. Combining sliding window and temporal interpolation provides a tradeoff between these two effects. Third, due to the slice-dependent T1ρ response, a sequential slice ordering is preferred to an interleaved ordering to reduce confounding blur between slices during post-processing. Additionally, since the T1ρ maps are more variable for early slices, the latter slices should cover the key region of interest. Consistent anatomical placement of the slices is also important in group studies, since early slices will experience a relatively greater T1ρ response than latter slices. Finally, to reduce T2* (i.e., BOLD) weighting, use of a SE-EPI sequence with a minimal TE is preferred.
The scope of this study was limited to an initial description and evaluation of the functional T1ρ mapping sequence, and further investigation is warranted in three key areas. First, the in vivo portion of the study was limited to three participants and an uncorrected statistical test was used to evaluate activation patterns, which provided a very preliminary assessment of functional T1ρ response. More in vivo studies are needed to validate these results and assess the variability and repeatability of individual responses. Second, sequence parameters were not optimized. Parameters can potentially be traded off to yield a more favorable balance between spatial and temporal resolution, volumetric coverage, spin-lock pulse duration and amplitude, and RF heating. Third, the degree to which the functional T1ρ mapping sequence is sensitive to in vivo pH and metabolism dynamics was not determined. Further work in animal models may better elucidate the contributing factors to the T1ρ response.
In conclusion, a sequence that enables functional measurement of T1ρ dynamics with high temporal resolution at multiple imaging slices has been described. Further work to increase the SNR, volumetric coverage, and sensitivity and specificity of the technique is warranted given its potential to probe non-hemodynamic neural-evoked activity with an fMRI paradigm.
Acknowledgments
JAW was supported by the Department of Veterans Affairs (Merit Award), National Institute of Mental Health (1R01MH085724-01), National Heart, Lung, and Blood Institute (5R01HL113863-01), and a McKnight Neuroscience of Brain Disorders Award.
Footnotes
Publisher's Disclaimer: This is a PDF file of an unedited manuscript that has been accepted for publication. As a service to our customers we are providing this early version of the manuscript. The manuscript will undergo copyediting, typesetting, and review of the resulting proof before it is published in its final citable form. Please note that during the production process errors may be discovered which could affect the content, and all legal disclaimers that apply to the journal pertain.
References
- 1.Kettunen MI, Grohn OH, Silvennoinen MJ, Penttonen M, Kauppinen RA. Effects of intracellular pH, blood, and tissue oxygen tension on T1rho relaxation in rat brain. Magn Reson Med. 2002;48:470–7. doi: 10.1002/mrm.10233. [DOI] [PubMed] [Google Scholar]
- 2.Jin T, Autio J, Obata T, Kim SG. Spin-locking versus chemical exchange saturation transfer MRI for investigating chemical exchange process between water and labile metabolite protons. Magn Reson Med. 2011;65:1448–60. doi: 10.1002/mrm.22721. [DOI] [PMC free article] [PubMed] [Google Scholar]
- 3.Nestrasil I, Michaeli S, Liimatainen T, Rydeen CE, Kotz CM, Nixon JP, Hanson T, Tuite PJ. T1rho and T2rho MRI in the evaluation of Parkinson's disease. J Neurol. 2010;257:964–8. doi: 10.1007/s00415-009-5446-2. [DOI] [PMC free article] [PubMed] [Google Scholar]
- 4.Haris M, Singh A, Cai K, Davatzikos C, Trojanowski JQ, Melhem ER, Clark CM, Borthakur A. T1rho MR imaging in Alzheimer's disease and Parkinson's disease with and without dementia. J Neurol. 2011;258:380–5. doi: 10.1007/s00415-010-5762-6. [DOI] [PMC free article] [PubMed] [Google Scholar]
- 5.Makela HI, Kettunen MI, Grohn OH, Kauppinen RA. Quantitative T1rho and magnetization transfer magnetic resonance imaging of acute cerebral ischemia in the rat. J Cereb Blood Flow Metab. 2002;22:547–58. doi: 10.1097/00004647-200205000-00006. [DOI] [PubMed] [Google Scholar]
- 6.Kettunen MI, Sierra A, Narvainen MJ, Valonen PK, Yla-Herttuala S, Kauppinen RA, Grohn OH. Low spin-lock field T1 relaxation in the rotating frame as a sensitive MR imaging marker for gene therapy treatment response in rat glioma. Radiology. 2007;243:796–803. doi: 10.1148/radiol.2433052077. [DOI] [PubMed] [Google Scholar]
- 7.Magnotta VA, Heo HY, Dlouhy BJ, Dahdaleh NS, Follmer RL, Thedens DR, Welsh MJ, Wemmie JA. Detecting activity-evoked pH changes in human brain. Proc Natl Acad Sci U S A. 2012;109:8270–3. doi: 10.1073/pnas.1205902109. [DOI] [PMC free article] [PubMed] [Google Scholar]
- 8.Jin T, Kim SG. Characterization of non-hemodynamic functional signal measured by spin-lock fMRI. Neuroimage. 2013;78C:385–95. doi: 10.1016/j.neuroimage.2013.04.045. [DOI] [PMC free article] [PubMed] [Google Scholar]
- 9.Duvvuri U, Charagundla SR, Kudchodkar SB, Kaufman JH, Kneeland JB, Rizi R, Leigh JS, Reddy R. Human knee: in vivo T1rho-weighted MR imaging at 1 5 T--preliminary experience. Radiology. 2001;220:822–6. doi: 10.1148/radiol.2203001662. [DOI] [PubMed] [Google Scholar]
- 10.Borthakur A, Wheaton A, Charagundla SR, Shapiro EM, Regatte RR, Akella SV, Kneeland JB, Reddy R. Three-dimensional T1rho-weighted MRI at 1 5 Tesla. J Magn Reson Imaging. 2003;17:730–6. doi: 10.1002/jmri.10296. [DOI] [PubMed] [Google Scholar]
- 11.Wheaton AJ, Borthakur A, Charagundla SR, Reddy R. Pulse sequence for multislice T1rho-weighted MRI. Magn Reson Med. 2004;51:362–9. doi: 10.1002/mrm.10705. [DOI] [PubMed] [Google Scholar]
- 12.Borthakur A, Wheaton AJ, Gougoutas AJ, Akella SV, Regatte RR, Charagundla SR, Reddy R. In vivo measurement of T1rho dispersion in the human brain at 1 5 tesla. J Magn Reson Imaging. 2004;19:403–9. doi: 10.1002/jmri.20016. [DOI] [PubMed] [Google Scholar]
- 13.Borthakur A, Hulvershorn J, Gualtieri E, Wheaton AJ, Charagundla S, Elliott MA, Reddy R. A pulse sequence for rapid in vivo spin-locked MRI. J Magn Reson Imaging. 2006;23:591–6. doi: 10.1002/jmri.20537. [DOI] [PMC free article] [PubMed] [Google Scholar]
- 14.Hulvershorn J, Borthakur A, Bloy L, Gualtieri EE, Reddy R, Leigh JS, Elliott MA. T1rho contrast in functional magnetic resonance imaging. Magn Reson Med. 2005;54:1155–62. doi: 10.1002/mrm.20698. [DOI] [PMC free article] [PubMed] [Google Scholar]
- 15.Charagundla SR, Borthakur A, Leigh JS, Reddy R. Artifacts in T1rho-weighted imaging: correction with a self-compensating spin-locking pulse. J Magn Reson. 2003;162:113–21. doi: 10.1016/s1090-7807(02)00197-0. [DOI] [PubMed] [Google Scholar]
- 16.Stanisz GJ, Odrobina EE, Pun J, Escaravage M, Graham SJ, Bronskill MJ, Henkelman RM. T1, T2 relaxation and magnetization transfer in tissue at 3T. Magn Reson Med. 2005;54:507–12. doi: 10.1002/mrm.20605. [DOI] [PubMed] [Google Scholar]
- 17.Cox RW. AFNI: software for analysis and visualization of functional magnetic resonance neuroimages. Comput Biomed Res. 1996;29:162–73. doi: 10.1006/cbmr.1996.0014. [DOI] [PubMed] [Google Scholar]
- 18.Lu H, Donahue MJ, van Zijl PC. Detrimental effects of BOLD signal in arterial spin labeling fMRI at high field strength. Magn Reson Med. 2006;56:546–52. doi: 10.1002/mrm.20976. [DOI] [PubMed] [Google Scholar]
- 19.Krieger SN, Streicher MN, Trampel R, Turner R. Cerebral blood volume changes during brain activation. J Cereb Blood Flow Metab. 2012;32:1618–31. doi: 10.1038/jcbfm.2012.63. [DOI] [PMC free article] [PubMed] [Google Scholar]
- 20.Magnotta VA, Johnson CP, Follmer R, Wemmie JA. Functional T1rho imaging in panic disorder. Biol Psychiatry. doi: 10.1016/j.biopsych.2013.09.008. epub. [DOI] [PMC free article] [PubMed] [Google Scholar]
- 21.Heo HY, Johnson CP, Thedens DR, Wemmie JA, Magnotta VA. T1rho functional imaging temporal dynamics in the human visual cortex. Proceedings of the 21st Annual Meeting of the International Society for Magnetic Resonance in Medicine; Salt Lake City, UT. ISMRM; 2013. p. 3243. [Google Scholar]
- 22.Moeller S, Yacoub E, Olman CA, Auerbach E, Strupp J, Harel N, Ugurbil K. Multiband multislice GE-EPI at 7 tesla, with 16-fold acceleration using partial parallel imaging with application to high spatial and temporal whole-brain fMRI. Magn Reson Med. 2010;63:1144–53. doi: 10.1002/mrm.22361. [DOI] [PMC free article] [PubMed] [Google Scholar]
- 23.Feinberg DA, Setsompop K. Ultra-fast MRI of the human brain with simultaneous multi-slice imaging. J Magn Reson. 2013;229:90–100. doi: 10.1016/j.jmr.2013.02.002. [DOI] [PMC free article] [PubMed] [Google Scholar]
- 24.Song AW, Wong EC, Hyde JS. Echo-volume imaging. Magn Reson Med. 1994;32:668–71. doi: 10.1002/mrm.1910320518. [DOI] [PubMed] [Google Scholar]
- 25.Mansfield P, Coxon R, Hykin J. Echo-volumar imaging (EVI) of the brain at 3 0 T: first normal volunteer and functional imaging results. J Comput Assist Tomogr. 1995;19:847–52. doi: 10.1097/00004728-199511000-00002. [DOI] [PubMed] [Google Scholar]
- 26.Poser BA, Koopmans PJ, Witzel T, Wald LL, Barth M. Three dimensional echo-planar imaging at 7 Tesla. Neuroimage. 2010;51:261–6. doi: 10.1016/j.neuroimage.2010.01.108. [DOI] [PMC free article] [PubMed] [Google Scholar]
- 27.Johnson CP, Thedens DR, Magnotta VA. Precision-guided sampling schedules for efficient T1rho mapping. J Magn Reson Imaging. doi: 10.1002/jmri.24518. epub. [DOI] [PubMed] [Google Scholar]


