

Abstract
The purpose of this study is to evaluate the utility of high-resolution noninvasive endogenous high-field MRI methods for the longitudinal structural and quantitative assessments of mouse kidney disease using the model of unilateral ureter obstruction (UUO). T1-weighted, T2-weighted and magnetization transfer (MT) imaging protocols were optimized to improve the regional contrast in mouse kidney. Conventional T1 and T2 weighted images were collected in UUO mice on day 0 (~3 hrs), day 1, day 3 and day 6 after injury, on a 7T small animal MRI system. Cortical and medullary thickness, corticomedullary contrast and Magnetization Transfer Ratio (MTR) were assessed longitudinally. Masson trichrome staining was used to histologically assess changes in tissue microstructure. Over the course of UUO progression there were significant (p<0.05) changes in thickness of cortex and outer medulla, regional changes in T2 signal intensity and MTR values. Histological changes included tubular cell death, tubular dilation, urine retention, and interstitial fibrosis, assessed by histology. The MRI measures of renal cortical and medullary atrophy, cortical-medullary differentiation and MTR changes provide an endogenous, non-invasive and quantitative evaluation of renal morphology and tissue composition during UUO progression.
Keywords: MRI, renal models of disease, unilateral ureteral obstruction, magnetization transfer (MT), cortical thickness, cortical-medullary contrast
INTRODUCTION
In vivo MRI techniques have been important in evaluating the functional, structural, and metabolic integrity of the compromised kidney in a wide variety of renal pathologies[1]. The application of non-invasive imaging methods in mice could be useful for the non-invasive and serial evaluation of disease progression, particularly given the importance of mouse models for the biological investigation of renal disease. Numerous studies have used contrast agents to assess renal functional features, such as blood flow, blood volume or glomerular filtration rates [2-5]. Others have explored endogenous contrast mechanisms to assess properties such as oxygen delivery, using blood oxygenation level dependent or microstructural features and bulk water transport using diffusion weighted MRI [6, 7]. The goal of this study was to further optimize and apply endogenous contrast mechanisms, including traditional T1 and T2 weighted imaging, magnetization transfer (MT), in the context of a mouse renal disease model.
Endogenous MRI contrast mechanisms could provide valuable readouts on renal morphology, tissue microstructure and/or composition. For example, renal cortical thickness, which may be assessed using high-resolution T1 or T2 weighted imaging, is a very important index for many renal diseases [8], and has been shown to influence the estimated glomerular filtration rate (eGFR)[9]. The loss of corticomedullary differentiation is another common feature of kidney dysfunction and thus provides a reasonable standard for the optimization of MRI contrast on T1 or T2 weighted imaging. Indeed, changes in the contrast between cortex and medulla have been observed on proton density weighted images that correlate with disease status [10-12].
Magnetization transfer (MT) imaging is an approach that is sensitive to large, immobile macromolecules distributed within tissue and could provide a means to evaluate, for example, apoptosis and fibrosis within the kidney [13-15]. MT experiments utilize off-resonance radiofrequency pulses to saturate macromolecular protons and the acquisition of the free water proton MR signal at a time sufficient for proton exchange between the two proton pools. The decrease in the water signal following exchange indirectly provides information on the macromolecules. MT has been used to detect intestinal fibrosis [16], parenchymal lung disease [17] and apoptotic cell death [18]. In the context of the renal system, MT effects have been investigated in lean and obese rat kidneys [19].
In the context of mouse renal disease models optimization of these imaging methods is required in order to overcome challenges due to the small kidney size, motion artifacts, local magnetic field inhomogeneity, low regional contrast and signal to noise limitations. Thus, in this study we first sought to optimize image acquisition protocols for T1 and T2 weighted and MT imaging. Next, to evaluate the sensitivity of the optimized imaging protocols to assess disease progression, we serially acquired MR data in mice following Unilateral Ureteral Obstruction (UUO).
In infants and children obstructive nephropathy is a primary source of renal impairment [20]. The UUO animal model has enabled the elucidation of the cellular and molecular events involved in obstructive renal injury [21]. Of particular importance to this study, UUO in mice induces serial changes in renal structure and recapitulates key features of tubular damage, apoptosis, and renal fibrosis [22]. This model has been extensively studied using histological methods [23-29] and diffusion weighted imaging has been applied to evaluate changes in fibrosis due to UUO [6]. These prior studies demonstrate the range of pathological features observed during UUO and are invaluable in the biophysical characterization and evaluation of the MRI readouts explored herein.
MATERIALS AND METHODS
Animal model
All procedures were approved by our Institution’s Animal Care and Usage Committee. For unilateral ureteral obstruction, mice were anesthetized with 2% isoflurane and left kidney exposed through the site of a left flank incision. The ureter was obstructed completely near the renal pelvis using a 4-0 silk tie suture at two points. Sham-operated mice underwent the same surgical procedure except for the ureter ligation. 12 UUO mice and 4 sham mice (around 22 grams) were scanned longitudinally. UUO mice were scanned on day 0 (~3 hrs), day 1, day 3 and day 6 following surgery. Sham mice were scanned before surgery and again on day 1 and day 6 following surgery. An additional parallel group of mice were examined on days 0, 1, 3 and 6 for histologic analysis (2 kidneys at each time point).
In vivo Imaging and Histology
MRI studies were performed using a volume coil on a Varian 7T horizontal bore imaging system. Anesthesia was induced and maintained with a 1.5%/98.5% isoflurane/oxygen mixture, and a constant body temperature of 37°C was maintained using heated air flow. All imaging protocols used a field-of-view (FOV) of 25.6×25.6 mm2. Fast imaging technique and respiration gating were applied to minimize motion artifacts. A coherent gradient echo sequence was employed for T1-weighted imaging (TR = 75 ms; TE = 2.25 ms; flip angle = 35°; number of excitations (NEX) = 81, resolution = 0.2×0.2×0.5 mm3), and flip angle was varied for T1 contrast optimization (5°, 15°, 25°, 35°, 45°, 55°, 65°, 75°, and 85°). A fast spin-echo (FSE) sequence (TR = 2000 ms; effective TE = 52 ms; RARE-factor 8, resolution = 0.1×0.1×0.5 mm3) was used to achieve T2 contrast. A navigator echo was employed to reduce motion artifacts. The TE (12, 24, 36, 48, 60, 72, 84, 96, 108, and 120 ms) was systematically varied to optimize T2 contrast.
For MT-weighted MRI, off-resonant radio frequency (RF) irradiation at different frequency offsets was incorporated into a gradient echo sequence. Fifteen off-resonance frequencies spaced from 250 Hz to 20 kHz were applied to determine and optimize the MT contrast. The Magnetization Transfer Ratio (MTR) was calculated from a selected coronal slice using the optimized protocol (TR=24 ms, flip angle=7°, TE=3.3 ms, matrix size=128×128, ST=1 mm, NEX=64). Off-resonant RF irradiation was accomplished by the use of a Gaussian RF pulse at 6000 Hz, duration 12 ms, θsat at 820°. The control image was acquired without MT pulses.
Following the MRI examination kidneys were removed from euthanized mice and fixed overnight in 10% buffered formalin. Paraffin tissue sections were stained with Masson trichrome using standard procedures.
Data analysis
All data were analyzed using MATLAB 2011a (The Mathworks). Images were registered using a rigid registration algorithm with mutual information [30]. Kidneys and regional ROIs were manually segmented with reference to high-resolution anatomic images [31]. The longitudinal relaxation time T1 was estimated for each voxel using the dual-angle approach[32, 33], and the transverse relaxation time T2 was extracted from a monoexponential fit to the signal decay curve for each voxel using a least-squares calculation routine. The ratio of the averaged signal intensity between outer medulla (OM) and cortex (IOM/IC) was calculated at each time point after surgery. Average cortical thickness in every mouse was calculated by measurement in nine locations, from the renal capsule to the edge of the outer strip of OM in the equatorial horizontal slice. The average OM thickness was calculated by measuring the distance from the edge of the inner medulla (IM) and papilla to the edge of outer strip of OM in the same slice[34]. At each location, thickness was determined as the shortest distance from the selected point to another sphere. The averaged thickness evaluation of cortex or OM was calculated as
| (1) |
where(xi, yi) and (xj, yj) are the coordinates of points i and j respectively.
The MTR was defined as
| (2) |
where S0 and Ssat were the signal without and with MT saturation, respectively. For each parameter above, a Student’s t-test was used to compare UUO kidneys to those founding sham mice in the longitudinal study.
RESULTS
Optimization of Imaging Methods
To enable measurements of cortical/medullary thickness and contrast among cortex, outer medulla (OM), and inner medulla and papilla (IM+P) of kidney, optimal acquisition parameters were determined using contrast enhancement curves (Figure 1). The difference in signal intensities between anatomically relevant regions of interests (ROI) was varied by acquiring images over a range of specific MRI parameters such as flip angle, TE, or RF offset. The observed T1 times of cortex, OM and IM+P were 1.2±0.1 s, 1.7±0.3 s, and 1.8±0.3 s, respectively. The measured T1 times of cortex and OM are reasonably longer than those reported for human kidney at 3.0 T (1.1 s and 1.6 s for cortex and OM respectively[35]). Using these T1 times the Ernst angle was estimated to be 20° with a TR=75 ms. The maximum signal was observed around 20° for cortex and OM (S1 and S2 in Fig. 1a). However, to maximize T1 contrast between tissues, full recovery needs to be avoided by using a short TR and large flip angle. The contrast enhancement curve S1-S2 (Fig. 1a) is in agreement with this. With a TR of 75 ms, a flip angle of 34° provided maximal T1 contrast between the cortex and OM on a T1-weighted image (see * in Figure 1a).
Figure 1.

Contrast Optimization. (a) T1-weighted image (top), T1 map (middle), and a comparison of the signal intensity versus flip angle between cortex and outer medulla (bottom). (b) T2-weighted image (top), T2 map (middle), and a comparison of the signal intensity versus echo time (TE) between cortex and outer medulla (bottom). (c) MTC images (top), MTR map (middle), and the influence of irradiation-offset frequency (bottom) on contrast between cortex and inner medulla. 1-cortex, 2-outer medulla (OM), and 3-inner medulla and papilla (IM+P).
A multi-slice fast spin echo imaging sequence was used for T2-weighted imaging and an echo train length of eight was selected as it provided a reasonable balance between T2 blurring artifacts and short scan durations. An effective echo time in the range 40-60 ms yielded optimal T2 contrast between the cortex and medulla (Fig. 1b). The T2 times of cortex, OM, and IM+P were about 38±3 ms, 47±4 ms and 64±6 ms respectively. These values are consistent with those reported for murine kidney at 7T[36]. Optimal T2 contrast was obtained by setting the TE in the range of T2 times of the tissues of murine kidney. For MTC (Fig. 1c), an off-resonance frequency ~6000 Hz yielded the best MT contrast between renal structures.
The optimized T1-weighted, T2-weighted and MTC images of the kidneys in a control mouse at 7T provided sufficient contrast for corticomedullary differentiation (Fig. 1). The T1-weighted images enabled clear visualization of the interlobar arteries and veins within the kidney (Fig. 1a). With high resolution T2-weighted images (0.1 × 0.1 × 0.5 mm3), fine structures such as medullary rays could be resolved (Figure 1b). In MTC image, the inner medulla and papilla exhibited the least degree of saturation, as exhibited by low MTR (Figure 1c).
MRI based regional definition and thickness assessment
Figure 2 shows example images used for the delineation of cortex, outer medulla (OM), inner medulla and papilla (IM+P) in a control kidney. The contrast in the outer strip of outer medulla (OSOM) is similar to that in cortex but visually different than that in the inner strip of the outer medulla (ISOM). However, the presence of blood vessels running between the OSOM and the cortex enabled the delineation of these structures (Fig. 2a). In this study, the cortical thickness measurements do not include the OSOM. The measurements of OM thickness presented herein represent both the OSOM and the inner strip of the outer medulla (ISOM). Representative locations for measuring cortical thickness in the equatorial slice are indicated by crosses in Figure 2b. The cortical and medullary thickness of the left and right kidneys measured across 12 control mice is shown in Fig. 2c. The average thickness of the cortex and outer medulla across mice is 1.2±0.1 mm and 2.0±0.1 [standard deviation across mice], respectively.
Figure 2.
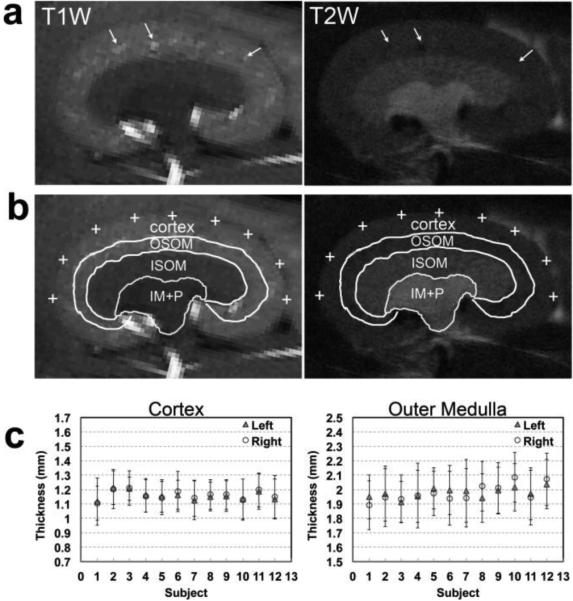
Measurements of cortical and medullary thickness. (a) Representative T1-weighted and T2-weighted images used for ROI delineation. White arrows indicate the presence of vessels in OSOM that were used to differentiate between cortex and OSOM. (b) Example ROIs used to assess cortical and medullary thickness. OSOM: outer strip of outer medulla, ISOM: inner strip of outer medulla, and IM+P: inner medulla and papilla. White crosses indicate the representative locations used to define the outer boundaries of the cortex. (c) Averaged thickness of cortex and outer medulla in the left and right kidneys in control mice (n=12). The standard deviations (error bars) were calculated from the 9 locations.
Anatomic MRI and histologic assessment of UUO disease progression
Figure 3 shows in vivo representative T1-weighted and T2-weighted images of the UUO CL kidneys in a mouse 3 hours and 1, 3 and 6 days after obstruction. Throughout the duration of the study, structural features such as kidney size, cortical and medullary thickness, and features of medullary rays were maintained as evidenced by normal regional differentiation in the CL kidney. In contrast, urine started to collect within the renal pelvis of the UUO kidney 3 hrs after the surgery (Fig. 3a). Generally, the size of the UUO pelvis substantially increased as compared to the CL kidney, accompanied by a decrease in the thickness of the OM and cortex. In the UUO kidney, the medullary rays were normal appearing 3 hrs post surgery (Fig. 3a) but were partially lost by day 1. By day 3, the medullary rays began to globally disappear (Fig. 3c). Interestingly, cortical-medullary contrast was lost on T2-weighted images but was maintained on T1-weighted images. By day 6, the medulla in the UUO kidney was greatly deformed and there was substantial thinning of the OM and cortex (Fig. 3d). Most of the medullary ray structures disappeared at this stage, which made the separation of ISOM and IM more difficult. Note that due to partial volume effects in the IM+P region from urine accumulation and gross morphologic expansion, regional quantification measures in this study focused only on the cortex and OM.
Figure 3.
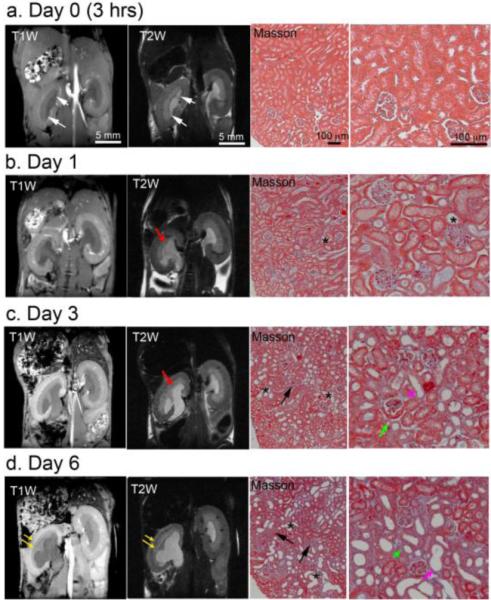
In vivo T1- and T2-weighted images showing the UUO (left) and contralateral (right) kidneys at (a) 3 hrs, (b) 1 day, (c) 3 days and (d) 6 days after surgery. At each time point, representative histological sections (Masson trichrome stain) from UUO kidneys are shown. White arrows indicate the accumulation of urine within the UUO kidney 3 hrs after surgery. Red arrows indicate the loss of the medullary rays. Yellow arrows indicate the thinning of cortex and outer medulla. The tubulointerstitial region substantially increased, as indicated by destructive morphology of renal tubules (*) and fibrosis (black arrows). Tubular atrophy is indicated by green arrow and tubule with denuded basement membranes is indicated by purple arrow.
Serial Masson trichrome staining of UUO kidney cortex tissue revealed typical features of UUO renal disease. Normal features appeared in the histologic sections 3 hrs after surgery (Fig. 3a). Tubular dilation was observed from day 1 (Fig. 3b). Tubular atrophy and tubules with denuded basement membranes were detected on day 3 (Fig. 3c). The tubulointerstitial region expanded drastically after UUO from day 1 to day 6 (Figs. 3b-d), as indicated by destructive morphology of renal tubules (asterisks). Interstitial fibrosis was observable on day 3 and became more pronounced by day 6 (light blue area indicated by black arrow in Fig. 3c-d). The relative volume of kidney occupied by normal tubules also decreased dramatically. Previous histologic analysis of UUO progression revealed increased cell proliferation in the cortex, tubular atrophy and necrosis [6, 23-29, 37].
Characterization of UUO disease using MT imaging
Representative MTR measurements on day 3 and day 6 are shown in Figure 4. On day 3, the MTR values in the OM (0.470 ± 0.021) and cortex (0.502 ± 0.022) were quite similar in the CL kidney, while the IM+P showed much lower MTR (0.373 ± 0.043). In the UUO kidney (Fig. 4a) on day 3, obstructed urine showed very low MTR (0.055 ± 0.084). The MTR in OM (0.431 ± 0.032) and cortex (0.465 ± 0.041) of the UUO kidney were substantially lower than those found in the CL kidney. By day 6 (Fig. 4b), the MTR of the OM and cortex in UUO kidneys decreased to 0.419 ± 0.035 and 0.454 ± 0.023, respectively.
Figure 4.

Representative T1-weighted images (T1W) and MTR maps on (a) day 3 and (b) day 6 after UUO surgery. Regions delineated by arrows are the same as those defined in Figure 1.
Longitudinal comparison of MRI measurements
The mean cortical and OM thicknesses in sham kidneys were 1.2 ± 0.1 and 2.0 ± 0.1 mm, respectively (n=12). In UUO mice, the thicknesses of the cortex and OM in CL kidneys were 1.2 ± 0.1 and 2.0 ± 0.1 respectively (n=12), and they did not show evident changes during disease progression (Fig. 5a). However, in the UUO kidney, OM showed significant thickness variations in as little as 3 hrs (p=0.005) that continued into day 1 (p<0.001) after surgery. By day 6, the OM exhibited regional deformation and shrinking, and the medullary rays within the ISOM disappeared in some regions of UUO kidneys. Only regions with preserved ray structures were considered as ISOM for measurements at this stage. The thicknesses of the OM decreased by 72% on day 6. Evident decreases in cortical thickness were observed on day 1 (p = 0.008), while more significant variations appeared at day 3 (p<0.001). The thicknesses of the cortex and OM decreased by 33% over the course of 6 days following UUO.
Figure 5.

Temporal variations in the (a) cortical and medullary thickness (n=12), (b) T1-weighted and T2-weighted image signal intensity ratios between OM and cortex IOM/IC (n=12), and (c) regional MTR (n=8) of CL and UUO kidneys. * p <0.001 vs sham mice.
The intensity ratio between OM and cortex (IOM/IC) in sham kidneys were 0.758±0.056 and 1.274±0.083 in T1 and T2 weighted images, respectively (n=12). In UUO mice, the signal intensity ratio for T1 and T2 images in the CL kidney remained constant (n=12) over the duration of the experiment (Fig. 5b). However, in the UUO kidney, significant changes in the IOM/IC on T2-weighted images were detected as early as 3 days post surgery (p < 0.001) and decreased by more than 10% over the course of 6 days, as compared to sham kidneys (Fig. 5b). No such change was found in UUO kidneys on T1-weighted images.
The MTR of cortex and OM in sham kidneys were 0.510±0.007 and 0.491±0.010, respectively (n=8). Small to significant changes in MTR of UUO kidneys were observed from day 1 to day 6 after surgery (Fig. 5c). Slight reductions in MTR showed up in cortex (3.5%) and OM (4.0%) in UUO kidney on day 1 (p=0.026 and p=0.105, respectively), while significant decrements in MTR were found in cortex (9.0%) and OM (14.2%) of UUO kidney on day 3 (p<0.001). By day 6, the MTR in cortex and OM in UUO kidney decreased by 9.3% and 16.7%, respectively (p<0.001).
DISCUSSION
In this study, the optimized MRI protocols enhanced tissue contrast and structural delineation within the mouse kidney. The use of T1, T2 and MT-imaging exhibited suitable sensitivity to disease-induced variations in kidney structure and composition. The observed abnormalities in renal MRI features during UUO disease progression were accompanied by notable histologic changes.
Renal cortical thickness
Renal cortical thickness is an important index for many renal diseases. To assess the average thickness of the cortex and OM we sampled 9 regions in the equatorial slice, in which the 2D cutting is perpendicular to the capsule and medullary base. The vessels in the subcortical zone of the OSOM helped delineate the cortex, even though they exhibit similar contrast on anatomic images. While this approach provides a reasonable first estimate we would expect that isotropic ultra-high resolution MRI imaging with automatic segmentation could improve the reliability and reproducibility of such measures. The reported murine renal cortical thickness in literature is variable (1.1-1.7 mm) and depends on the regional contrast provided by different imaging methods used, the cortical definition difference and different approaches for evaluating thickness [38-40]. In our study, the MR-derived cortical thickness (1.2±0.1 mm) agrees well with that measured using histology (1.17±0.1 mm) [38].
In this study, renal deformation and variation of OM thickness provided the most sensitive MRI features of UUO progression, with changes detected as early as 3 hrs after injury. The early decrease in cortical thickness on UUO day 0 could be due to the global stretch. At later time points, the further decrease in cortical thickness of the UUO kidney is likely associated with global renal expansion caused by urine retention in the pelvis and, potentially, cortical tubular atrophy. The decrease in the thickness of the OM of UUO kidney could be related to apoptosis and tubular atrophy in medulla[37]. A more systematic histologic analysis is warranted in order to verify the underlying biophysical basis of the changes observed with MRI. The variation in OM thickness measurements in different region was larger than that of cortex, likely due to the observed severe medullary deformation and partial volume effects resulting from the expansion of the IM+P.
Cortical-medullary contrast
The signal intensity ratio between the OM and cortex on T2-weighted images was sensitive to UUO progression, as early as day 1 after surgery, while that on T1-weighted images was not. In general, the T2 relaxation time is a sensitive marker to changes in water compartmentation (e.g. whether intra- or extracellular) and the biochemical composition of and water exchange between these compartments. The T2 changes observed here are likely a complex interaction between the underlying physiologic, structural and molecular features of the diseased kidney, including dilated proximal tubules, tubules with denuded basement membranes, interstitial expansion, ECM (extracellular matrix) accumulation and fibrosis, and altered hemodynamics in the cortex, and apoptosis, tubular atrophy and epithelial replacement of tubular segments in medulla[37]. Thus, the signal intensity ratios reflect an uneven variation of these features between the cortex and medulla. At the expense of a longer acquisition time, the spatial comparison of quantitative T1 and T2 maps with relevant histological (or mass spectrometry) indices could help separate the biophysical basis for the findings in this study. It is encouraging that these relatively straightforward acquisition and analysis techniques are able to consistently identify abnormalities within renal tissue beyond the expected morphometric changes.
Sensitivity of MTR measurements
Previous studies have revealed that ADC (apparent diffusion coefficient) variations in cortex are associated with changes in cell density and fibrosis in UUO kidneys between days 3 and 7 [6]. The MTR measure used herein provides complementary information on the renal microenvironment, owing to its sensitivity to the macromolecular composition of tissue. During early stages of UUO disease progression (day 0 – day 3), the MTR values in OM and cortex of UUO kidneys decreased, as compared to normal tissue, with a more substantial change in the OM. By day 6 the MTR of the OM continued to decrease but remained constant in the cortex.
The decreased MTR values in OM suggest reduced macromolecular content, which could be related to apoptosis, tubular atrophy and urine retention[37]. Apoptosis produces changes at the molecular and cellular levels, including a breakdown of proteins. In the renal cortex, variations in MTR values potentially reflect the net effect of a host of biological changes including tubular dilation, tubules with denuded basement membranes, expansion of the tubulointerstitial region filled with massive cells, proliferation of myofibroblasts and fibrosis, and cortical tubular atrophy[6, 37]. Tubular dilation, denudation of the basement membrane and tubular atrophy would decrease MTR values while fibrosis would have the opposite effect. In this study, the histologic analysis indicated that tubular dilation and degeneration were present at day 1 after UUO surgery while tubular atrophy and fibrosis increased from day 3 to day 6[6]. While MTR values exhibited a rapid decline initially, the rate of change slowed down from day 3 to day 6, which could reflect the increase contribution of fibrosis.
The observed MTR variations within the kidney during UUO progression depend on the complex contribution of a number of simultaneous biological changes. While MTR has shown a notable sensitivity to UUO progression, this semi-quantitative metric is also sensitive to various experimental parameters, including the radio-frequency (RF) pulse irradiation power, frequency offset and tissue relaxation properties, which reduces the specificity of this method. To reduce these dependences and to potentially increase specificity, quantitative magnetization transfer (qMT) imaging techniques could enable the acquisition of more specific biological readouts such as pool size ratios that better reflect variations in macromolecular content. Establishing the links between the MRI and pathologic findings is a subject of ongoing investigation.
CONCLUSIONS
In this study, non-invasive in vivo imaging methods for high-resolution evaluation of mouse models of renal disease were optimized and validated in a commonly used animal model of obstructive nephropathy. Changes in renal structure, relative signal intensity ratios and MTR measurements were detected early in the course of UUO disease progression at times when histologic abnormalities were also apparent. As these methods leverage endogeneous contrast mechanisms and are easily implemented they should enable the assessment of abnormal renal structure and composition across a wide range of pathologies.
ACKNOWLEDGEMENTS
We thank Mr. Ken Wilkens, Dr. Daniel C. Colvin, Mr. Fuxue Xin, Mr. Jarrod True, and Dr. Mark D. Does in Vanderbilt University Institute of Imaging Science. We also thank Dr. Masayo Hino in Vanderbilt O’Brien Mouse Kidney Physiology and Disease Center. This research is supported by NIH/NIDDK grant DK79341 for Vanderbilt O’Brien Mouse Kidney Physiology and Disease Center.
Footnotes
Publisher's Disclaimer: This is a PDF file of an unedited manuscript that has been accepted for publication. As a service to our customers we are providing this early version of the manuscript. The manuscript will undergo copyediting, typesetting, and review of the resulting proof before it is published in its final citable form. Please note that during the production process errors may be discovered which could affect the content, and all legal disclaimers that apply to the journal pertain.
REFERENCES
- 1.Michaely HJ, Sourbron S, Dietrich O, Attenberger U, Reiser MF, Schoenberg SO. Functional renal MR imaging: an overview. Abdom Imaging. 2007;32(6):758–771. doi: 10.1007/s00261-006-9150-8. [DOI] [PubMed] [Google Scholar]
- 2.Kobayashi H, Saga T, Kawamoto S, Sato N, Hiraga A, Ishimori T, Konishi J, Togashi K, Brechbiel MW. Dynamic micro-MRI of liver micrometastasis with a novel liver macromolecular MR contrast agent DAB-Am64-(1B4M-Gd)64. Acad Radiol. 2002;9(Suppl 2):S452–454. doi: 10.1016/s1076-6332(03)80260-x. [DOI] [PubMed] [Google Scholar]
- 3.Kobayashi H, Jo SK, Kawamoto S, Yasuda H, Hu X, Knopp MV, Brechbiel MW, Choyke PL, Star RA. Polyamine dendrimer-based MRI contrast agents for functional kidney imaging to diagnose acute renal failure. J Magn Reson Imaging. 2004;20(3):512–518. doi: 10.1002/jmri.20147. [DOI] [PubMed] [Google Scholar]
- 4.Dear JW, Kobayashi H, Brechbiel MW, Star RA. Imaging acute renal failure with polyamine dendrimer-based MRI contrast agents. Nephron Clin Pract. 2006;103(2):C45–C49. doi: 10.1159/000090608. [DOI] [PubMed] [Google Scholar]
- 5.Wang F, Jiang RT, Tantawy MN, Borza DB, Takahashi K, Gore JC, Harris RC, Takahashi T, Quarles CC. Repeatability and sensitivity of high resolution blood volume mapping in mouse kidney disease. J Magn Reson Imaging. 2014;39(4):866–871. doi: 10.1002/jmri.24242. [DOI] [PMC free article] [PubMed] [Google Scholar]
- 6.Togao O, Doi S, Kuro-o M, Masaki T, Yorioka N, Takahashi M. Assessment of renal fibrosis with diffusion-weighted MR imaging: study with murine model of unilateral ureteral obstruction. Radiology. 2010;255(3):772–780. doi: 10.1148/radiol.10091735. [DOI] [PMC free article] [PubMed] [Google Scholar]
- 7.Prasad P, Li LP, Halter S, Cabray J, Ye M, Batlle D. Evaluation of renal hypoxia in diabetic mice by BOLD MRI. Invest Radiol. 2010;45(12):819–822. doi: 10.1097/RLI.0b013e3181ec9b02. [DOI] [PMC free article] [PubMed] [Google Scholar]
- 8.Mounier-Vehier C, Lions C, Devos P, Jaboureck O, Willoteaux S, Carre A, Beregi JP. Cortical thickness: An early morphological marker of atherosclerotic renal disease. Kidney Int. 2002;61(2):591–598. doi: 10.1046/j.1523-1755.2002.00167.x. [DOI] [PubMed] [Google Scholar]
- 9.Beland MD, Walle NL, Machan JT, Cronan JJ. Renal Cortical Thickness Measured at Ultrasound: Is It Better Than Renal Length as an Indicator of Renal Function in Chronic Kidney Disease? Am J Roentgenol. 2010;195(2):W146–W149. doi: 10.2214/AJR.09.4104. [DOI] [PubMed] [Google Scholar]
- 10.Lipuma JP. Magnetic-Resonance Imaging of the Kidney. Radiol Clin North Am. 1984;22(4):925–941. [PubMed] [Google Scholar]
- 11.Marotti M, Hricak H, Terrier F, Mcaninch JW, Thuroff JW. Mr in Renal-Disease - Importance of Cortical Medullary Distinction. Magnetic Resonance in Medicine. 1987;5(2):160–172. doi: 10.1002/mrm.1910050207. [DOI] [PubMed] [Google Scholar]
- 12.Farmer THR, Johnson GA, Cofer GP, Maronpot RR, Dixon D, Hedlund LW. Implanted Coil Mr Microscopy of Renal Pathology. Magnetic Resonance in Medicine. 1989;10(3):310–323. doi: 10.1002/mrm.1910100304. [DOI] [PubMed] [Google Scholar]
- 13.Henkelman RM, Stanisz GJ, Graham SJ. Magnetization transfer in MRI: a review. NMR Biomed. 2001;14(2):57–64. doi: 10.1002/nbm.683. [DOI] [PubMed] [Google Scholar]
- 14.Guivel-Scharen V, Sinnwell T, Wolff SD, Balaban RS. Detection of proton chemical exchange between metabolites and water in biological tissues. J Magn Reson. 1998;133(1):36–45. doi: 10.1006/jmre.1998.1440. [DOI] [PubMed] [Google Scholar]
- 15.Wolff SD, Eng J, Balaban RS. Magnetization Transfer Contrast - Method for Improving Contrast in Gradient-Recalled-Echo Images. Radiology. 1991;179(1):133–137. doi: 10.1148/radiology.179.1.2006263. [DOI] [PubMed] [Google Scholar]
- 16.Adler J, Swanson SD, Schmiedlin-Ren P, Higgins PDR, Golembeski CP, Polydorides AD, McKenna BJ, Hussain HK, Verrot TM, Zimmermann EM. Magnetization Transfer Helps Detect Intestinal Fibrosis in an Animal Model of Crohn Disease. Radiology. 2011;259(1):127–135. doi: 10.1148/radiol.10091648. [DOI] [PMC free article] [PubMed] [Google Scholar]
- 17.Kuzo RS, Kormano MJ, Lipton MJ. Magnetization transfer magnetic resonance imaging of parenchymal lung disease. Invest Radiol. 1995;30(2):118–122. doi: 10.1097/00004424-199502000-00011. [DOI] [PubMed] [Google Scholar]
- 18.Bailey C, Desmond KL, Czarnota GJ, Stanisz GJ. Quantitative Magnetization Transfer Studies of Apoptotic Cell Death. Magnetic Resonance in Medicine. 2011;66(1):264–269. doi: 10.1002/mrm.22820. [DOI] [PubMed] [Google Scholar]
- 19.Bosch CS, Ackerman JJH, Tilton RG, Shalwitz RA. Invivo Nmr Imaging and Spectroscopic Investigation of Renal Pathology in Lean and Obese Rat Kidneys. Magnetic Resonance in Medicine. 1993;29(3):335–344. doi: 10.1002/mrm.1910290309. [DOI] [PubMed] [Google Scholar]
- 20.Collins AJ, Foley R, Herzog C, Chavers B, Gilbertson D, Ishani A, Kasiske B, Liu J, Mau LW, McBean M. Excerpts from the United States Renal Data System 2007 annual data report. et al. Am J Kidney Dis. 2008;51(1):S1–320. doi: 10.1053/j.ajkd.2007.11.001. Suppl 1. [DOI] [PubMed] [Google Scholar]
- 21.Chevalier RL, Thornhill BA, Forbes MS, Kiley SC. Mechanisms of renal injury and progression of renal disease in congenital obstructive nephropathy. Pediatr Nephrol. 2010;25(4):687–697. doi: 10.1007/s00467-009-1316-5. [DOI] [PubMed] [Google Scholar]
- 22.Chevalier RL, Forbes MS, Thornhill BA. Ureteral obstruction as a model of renal interstitial fibrosis and obstructive nephropathy. Kidney Int. 2009;75(11):1145–1152. doi: 10.1038/ki.2009.86. [DOI] [PubMed] [Google Scholar]
- 23.Pat B, Yang T, Kong CZ, Watters D, Johnson DW, Gobe G. Activation of ERK in renal fibrosis after unilateral ureteral obstruction: Modulation by antioxidants. Kidney Int. 2005;67(3):931–943. doi: 10.1111/j.1523-1755.2005.00157.x. [DOI] [PubMed] [Google Scholar]
- 24.Cochrane AL, Kett MM, Samuel CS, Campanale NV, Anderson WP, Hume DA, Little MH, Bertram JF, Ricardo SD. Renal structural and functional repair in a mouse model of reversal of ureteral obstruction. Journal of the American Society of Nephrology : JASN. 2005;16(12):3623–3630. doi: 10.1681/ASN.2004090771. [DOI] [PubMed] [Google Scholar]
- 25.Isaka Y, Tsujie M, Ando Y, Nakamura H, Kaneda Y, Imai E, Hori M. Transforming growth factor-beta 1 antisense oligodeoxynucleotides block interstitial fibrosis in unilateral ureteral obstruction. Kidney Int. 2000;58(5):1885–1892. doi: 10.1111/j.1523-1755.2000.00360.x. [DOI] [PubMed] [Google Scholar]
- 26.Heyman SN, Fuchs S, Jaffe R, Shina A, Ellezian L, Brezis M, Rosen S. Renal microcirculation and tissue damage during acute ureteral obstruction in the rat: effect of saline infusion, indomethacin and radiocontrast. Kidney Int. 1997;51(3):653–663. doi: 10.1038/ki.1997.95. [DOI] [PubMed] [Google Scholar]
- 27.Chevalier RL, Forbes MS, Thornhill BA. Ureteral obstruction as a model of renal interstitial fibrosis and obstructive nephropathy. Kidney Int. 2009;75(11):1145–1152. doi: 10.1038/ki.2009.86. [DOI] [PubMed] [Google Scholar]
- 28.Fu P, Liu F, Su S, Wang W, Huang XR, Entman ML, Schwartz RJ, Wei L, Lan HY. Signaling mechanism of renal fibrosis in unilateral ureteral obstructive kidney disease in ROCK1 knockout mice. Journal of the American Society of Nephrology : JASN. 2006;17(11):3105–3114. doi: 10.1681/ASN.2005121366. [DOI] [PubMed] [Google Scholar]
- 29.Puri TS, Shakaib MI, Chang A, Mathew L, Olayinka O, Minto AW, Sarav M, Hack BK, Quigg RJ. Chronic kidney disease induced in mice by reversible unilateral ureteral obstruction is dependent on genetic background. Am J Physiol Renal Physiol. 2010;298(4):F1024–1032. doi: 10.1152/ajprenal.00384.2009. [DOI] [PMC free article] [PubMed] [Google Scholar]
- 30.Pluim JPW, Maintz JBA, Viergever MA. Mutual-information-based registration of medical images: A survey. Ieee T Med Imaging. 2003;22(8):986–1004. doi: 10.1109/TMI.2003.815867. [DOI] [PubMed] [Google Scholar]
- 31.Wang F, Jiang RT, Tantawy MN, Borza DB, Takahashi K, Gore JC, Harris RC, Takahashi T, Quarles CC. Repeatability and sensitivity of high resolution blood volume mapping in mouse kidney disease. J Magn Reson Imaging. 2013 doi: 10.1002/jmri.24242. [DOI] [PMC free article] [PubMed] [Google Scholar]
- 32.Bottomley PA, Ouwerkerk R. The Dual-Angle Method for Fast, Sensitive T-1 Measurement in-Vivo with Low-Angle Adiabatic Pulses. J Magn Reson Ser B. 1994;104(2):159–167. [Google Scholar]
- 33.Smith SA, Edden RA, Farrell JA, Barker PB, Van Zijl PC. Measurement of T1 and T2 in the cervical spinal cord at 3 tesla. Magn Reson Med. 2008;60(1):213–219. doi: 10.1002/mrm.21596. [DOI] [PMC free article] [PubMed] [Google Scholar]
- 34.Moghazi S, Jones E, Schroepple J, Arya K, McClellan W, Hennigar RA, O'Neill WC. Correlation of renal histopathology with sonographic findings. Kidney Int. 2005;67(4):1515–1520. doi: 10.1111/j.1523-1755.2005.00230.x. [DOI] [PubMed] [Google Scholar]
- 35.de Bazelaire CM, Duhamel GD, Rofsky NM, Alsop DC. MR imaging relaxation times of abdominal and pelvic tissues measured in vivo at 3.0 T: preliminary results. Radiology. 2004;230(3):652–659. doi: 10.1148/radiol.2303021331. [DOI] [PubMed] [Google Scholar]
- 36.Hueper K, Rong S, Gutberlet M, Hartung D, Mengel M, Lu X, Haller H, Wacker F, Meier M, Gueler F. T2 Relaxation Time and Apparent Diffusion Coefficient for Noninvasive Assessment of Renal Pathology After Acute Kidney Injury in Mice Comparison With Histopathology. Invest Radiol. 2013;48(12):834–842. doi: 10.1097/RLI.0b013e31829d0414. [DOI] [PubMed] [Google Scholar]
- 37.Cochrane AL, Kett MM, Samuel CS, Campanale NV, Anderson WP, Hume DA, Little MH, Bertram JF, Ricardo SD. Renal structural and functional repair in a mouse model of reversal of ureteral obstruction. J Am Soc Nephrol. 2005;16(12):3623–3630. doi: 10.1681/ASN.2004090771. [DOI] [PubMed] [Google Scholar]
- 38.Lee SJ, Cho SJ, Ju SY, Ryu KH, Sung SH, Park EA. Effect of retinoic acid on renal development in newborn mice treated with an angiogenesis inhibitor. Pediatr Int. 2010;52(3):386–392. doi: 10.1111/j.1442-200X.2009.02959.x. [DOI] [PubMed] [Google Scholar]
- 39.Messow C, Gartner K, Hackbarth H, Kangaloo M, Lunebrink L. Sex differences in kidney morphology and glomerular filtration rate in mice. Contrib Nephrol. 1980;19:51–55. [PubMed] [Google Scholar]
- 40.Zhai XY, Birn H, Jensen KB, Thomsen JS, Andreasen A, Christensen EI. Digital three-dimensional reconstruction and ultrastructure of the mouse proximal tubule. Journal of the American Society of Nephrology : JASN. 2003;14(3):611–619. doi: 10.1097/01.asn.0000051725.00406.0c. [DOI] [PubMed] [Google Scholar]