

Abstract
Background
Frailty has emerged as an important predictor of operative risk among elderly surgical patients. However, the complexity of prospective frailty scores has limited their widespread use. Our goal was to develop two frailty-based surgical risk models employing only routine preoperative data. Our hypothesis was these models could easily integrate into an electronic medical record (EMR) to predict 30-day morbidity and mortality.
Study Design
ACS-NSQIP participant use files from 2005–2010 were reviewed, and patients ≥65 years old who underwent elective lower gastrointestinal surgery were identified. Two multivariate logistic regression models were constructed and internally cross-validated. The first included simple functional data, a comorbidity index based on the Charlson Comorbidity Index, demographics, BMI, and laboratory data (albumin <3.4g/dL, hematocrit<35%, creatinine>2mg/dL). The second model contained only parameters that can directly auto-populate from an EMR: demographics, laboratory data, BMI, and ASA score. To further assess diagnostic accuracy, receiver operating characteristic (ROC) curves were constructed.
Results
76,106 patients met criteria for inclusion. 30-day mortality was seen in 2,853 patients or 3.7% of the study population. 18,436 patients (24.2%) experienced major complication. The c-statistic of the first expanded model was 0.813 for mortality and 0.629 for morbidity. The second simplified model had a c-statistic of 0.795 for mortality and 0.621 for morbidity. Both models were well calibrated per the Hosmer-Lemeshow test.
Conclusions
Our work demonstrates that routine preoperative data can approximate frailty and predict geriatric-specific surgical risk. The models’ predicative power was comparable to that of established prospective frailty scores. Our calculator could be used as a low cost simple screen for high-risk individuals who may require further evaluation or specialized services.
Introduction
Individuals over the age of 65 represent the fastest growing segment of the population,1,2 and account for over 40% of all surgical procedures.3 Although age alone cannot adequately predict operative outcome,4–6 seniors are at high risk of operative morbidity and mortality.7,8 This is particularly true for elderly patients undergoing non-emergent colorectal surgery. Colorectal patients account for the largest number of geriatric postoperative deaths and a significant proportion of all postoperative complications.9 As such, the ability to efficiently and proactively identify these patients is critical for patient counseling, shared decision-making, and resource allocation.
Geriatric medicine has long recognized frailty, a state of decreased physiologic reserve, as essential to the assessment and treatment of community-dwelling seniors.10,11 While frailty is not a condition limited to the elderly, it is a useful way of describing a population that is characterized by multimorbidity. Recently, the surgical literature has adopted this concept, and frailty markers such as weakness, impaired gait or balance, and decreased function have been shown to positively correlate with the risk of postoperative death and complication.12,13 However, the complexity and intensity of formal prospective frailty assessments has prohibited their widespread preoperative use. 14 One practical barrier is the need for specialized testing or evaluation, which is time-consuming, and in many community-based settings is not readily available.14
We hypothesized that we could use routinely collected clinical data to approximate frailty and predict the risk of 30-day postoperative morbidity and mortality among elderly colorectal surgery patients. In this study, we use the American College of Surgeons National Surgical Quality Improvement Program (ACS-NSQIP), a high-fidelity database of perioperative information, to develop and evaluate two geriatric-specific surgical risk scores. The first is a model that closely approximates the modified frailty index (mFI), 15–17 and therefore includes fields that must be manually entered by NSQIP participant institutions (e.g., transfer status, functional level). Though these are simple parameters and do not require a geriatrics consult, they still require input from a trained individual, are subject to input error, and cost $10,000–29,000 per institution.18 The second model employs only routine parameters that can be directly auto-populated from an electronic medical record (EMR). The latter would be a valuable resource for clinicians facing the time and economic constraints of the busy preoperative period. Finally, we compare prognostic ability of both the expanded and simple model with that of an established prospective frailty model.19,20
Methods
Study Population
ACS-NSQIP participant use files from 2005–2010 were obtained with permission from our institutional NSQIP official. Patients ≥65 years of age who underwent elective lower gastrointestinal (GI) surgery were identified by Clinical Classifications Software (CCS) codes.21 The most common lower gastrointestinal procedures were selected for inclusion (CCS: 72, 73, 75, 78, 87, 89, 90, 96, and 99, Table 1). Emergency cases and individuals with an American Society of Anesthesiologists Physical Status (ASA PS) score of 5 were excluded.
Table 1.
Procedures by CCS Code
| CCS Code | Description | Patients, n (%) (n = 76,106) |
|---|---|---|
| 72 | Colostomy | 1,786(2.3%) |
| 73 | Ileostomy or other enterostomy | 5,718 (7.5%) |
| 75 | Small bowel resection | 4,464 (5.9%) |
| 78 | Colorectal resection | 38,298 (50.3%) |
| 87 | Laparoscopy | 2,487 (3.3%) |
| 89 | Exploratory laparotomy | 2,760 (3.6%) |
| 90 | Excision or lysis of peritoneal adhesions | 1,837 (2.4%) |
| 96 | Other or lower GI therapeutic procedures | 9,614 (12.6%) |
| 99 | Other or GI therapeutic procedures | 9,142 (12.0%) |
NSQIP is a large national database, designed to measure and improve hospital-based surgical care.22 Its methodology has been previously described.22–24 In brief, the NSQIP dataset includes standardized data on patient demographics, preoperative comorbidities, labs, intraoperative variables, and 30-day postoperative outcomes for adult patients undergoing surgery. Data is collected and abstracted by trained Surgical Clinical Reviewers at each NSQIP site, and audited to ensure validity. 18
Approximating Frailty
Our retrospective models included markers representative of frailty and its underlying physiologic dysregulation. Specifically, we quantified and operationalized the domains outlined in Robinson’s prospective frailty index (impaired cognition, poor nutrition, decreased physical function, chronic disease burden, and geriatric syndromes).19,20 The models’ predictive power was further enhanced by the addition of laboratory markers relating to frailty’s pathophysiology of chronic inflammation and sarcopenia (albumin, hematocrit, and creatinine).25
Expanded Risk Prediction Model: Independent Variables
Demographic variables included age, sex, and race. The preoperative frailty characteristics assessed were: poor nutrition and inflammation as captured by a serum albumin of <3.4 g/dL;20,26 muscle mass and chronic renal insufficiency as defined by a serum creatinine of >2mg/dL; 27,28 and anemia, defined as a hematocrit of less than 35%.20,29 The geriatric syndrome of cognitive dysfunction20 was captured by the NSQIP variable for impaired sensorium (IMPSENS). Functional disability was assessed by FNSTATUS2. Patients dependent in >1 activity of daily living (ADL) were coded as “partially dependent,” while those requiring total assistance for all ADLs were coded as “totally dependent.” Transfer status (TRANSTGRP) was also employed as a surrogate measure of fall risk and weakness. Patients were transferred from one of three locations: an inpatient unit or outside hospital (acute care facility), a nursing home or chronic care unit (chronic care facility), or admitted directly from home. Physical health and fitness was described by the American Society of Anesthesiologists Physical Status score (ASACLAS). This score ranges from 1 (healthy) to 5 (moribund). 30
Lastly, a comorbidity index was created by translating the previously published Canadian Study of Health and Aging Frailty Index (CSHA-FI)31 and Charlson Comorbidity Index (CCI)32 to the NSQIP dataset. The modified frailty index 15,33 and an adapted CCI34–36 have been shown to have similar efficacy and predictive power as their original indices. The comorbidity index was calculated for each patient by dividing the number of variables present by the total number assessed (n/12). These included a history of diabetes mellitus (DIABETES); chronic obstructive pulmonary disease (HXCOPD); congestive heart failure (HXCHF); myocardial infarction (HXMI); percutaneous coronary intervention, stenting or angina (PRVPCI or HXANGINA); hypertension requiring medication (HYPERMED); peripheral vascular disease (HXPVD or RESTPAIN); transient ischemic attack or cerebrovascular accident (HXTIA or CVANO); cerebrovascular accident with neurological deficit (CVA); esophageal varices (ESOVAR); ascites (ASCITES); or disseminated cancer (DISCANCR).
Electronic Risk Prediction Model: Independent Variables
This simplified frailty model included only variables universal to EMRs. These high-fidelity predictors have the potential to be auto-populated into an electronic risk assessment tool, and do not require additional evaluation or interview. As above, demographic information included age, sex, and race. Preoperative frailty characteristics included serum albumin <3.4g/dL, hematocrit <35%, a serum creatinine of >2mg/dL, and ASA PS score.
Outcomes
The primary outcome variables were 30-day mortality and major postoperative morbidity. Major postoperative morbidity was defined to parallel that evaluated by Robinson et al.19,20 and included: cardiac arrest, myocardial infarction, pneumonia, pulmonary embolism, reintubation, renal insufficiency, cerebral vascular accident, coma >24 hours, deep wound surgical site infection, superficial surgical site infection, urinary tract infection, sepsis, deep vein thrombosis, and reoperation.
Statistical Analysis
Percentages were used to describe demographic data and the proportion of observed complications. The mean and standard deviation was reported for age; the median and range was reported for preoperative laboratory values and body mass index (BMI). Multivariate logistic regression models were constructed via forward stepwise selection using the hypothesis driven variables specified. Goodness of fit was evaluated by the Hosmer-Lemeshow test.37 We then preformed an internal n-1 cross-validation.38 Specifically, the cross-validated predicted probability was calculated by fitting the model on n-1 subsamples and retaining one observation for validation. The resultant model was then used to compute the predicted probability for the retained observation. Receiver Operating Characteristic (ROC) curves were constructed for the original and cross-validated models. Statistical significance was defined as a p value <0.05. All analyses were done using SAS version 9.3 (SAS Institute Inc., Cary, NC).
Results
Demographics
A total of 248,748 ACS-NSQIP participant use files were reviewed, and of these, 76,106 met age and CCS criteria for inclusion (Figure 1). Demographics and baseline preoperative characteristics are reported in Tables 2 and 3. Of the total cohort, 46.3% were male and 81.0% were Caucasian. The mean age was 74.35 ± 6.50 years. In order to protect patient identity, the NSQIP dataset codes patients >89 years old as 89. Table 1 reports the distribution of surgical procedures within the study population. Colorectal resection was the most common procedure performed (n=38,298 or 50.3%), followed by “other or lower GI therapeutic procedures” and “other or GI therapeutic procedures” (n=9,614 or 12.6% and 9,142 or 12.0% respectively). The most common diagnoses or indication for surgery was colorectal cancer or other malignancy (n= 21,769 or 28.6% and 20,622 or 27.1% respectively). See Figure 2.
Figure 1.

Study design and patient outcomes. A total of 248,748 ACS NSQIP participant use files from 2005 to 2010 were reviewed. Of these, 76–106 were ≥65 years old and met CCS code criteria for inclusion. During the review period, major complications were seen in 18.436 patients, and 1,928 (10.5%) of this subgroup went on to experience 30-day mortality. Overall, 30-day mortality was seen in 2,853 patients or 3.7% of the total study cohort.
Table 2.
Patient Demographics and Baseline Characteristics
| Variable | Total (n = 76,106) | Major morbidity (n = 18,436) | 30-d mortality (n = 2,853) |
|---|---|---|---|
| Demographics | |||
| Age, y, mean ± SD | 74.35 ± 6.50 | 74.68±6.54 | 76.89±6.68 |
| Male, n (%) | 35,243 (46.3) | 9,025 (48.9) | 1,489 (52.2) |
| Race, n (%)* | |||
| White | 61,624 (81.0) | 14,752 (80.0) | 2,289 (80.2) |
| Black | 5,783 (7.6) | 1,639 (8.9) | 257 (9.0) |
| Asian or Hawaiian | 1,888 (2.5) | 384 (2.1) | 49 (1.7) |
| Other | 6,811 (9.0) | 1,661 (9.0) | 258 (9.0) |
| Preoperative variables | |||
| BMI, kg/m2, median (range) | 26.5 (8.4–170.6) | 26.6 (10.0–89.4) | 25.60 (8.4–85.3) |
| ASA Class, n (%) | |||
| I | 568 (0.8) | 73 (0.4) | 7 (0.2) |
| II | 23,886 (31.4) | 3,983 (21.6) | 204 (7.2) |
| III | 45,107 (59.3) | 11,730 (63.6) | 1,660 (58.2) |
| IV | 6,473 (8.5) | 2,633 (14.3) | 980 (34.3) |
| Null | 49 (0.6) | 13 (0.0) | 1 (0.0) |
| Transfer status, n (%) | |||
| Acute care facility | 2,233 (2.9) | 919 (5.0) | 284 (10.0) |
| Chronic care facility | 1,673 (2.2) | 636 (3.4) | 206 (7.2) |
| Home | 71,942 (94.5) | 16,786 (91.0) | 2,342 (82.0) |
| Null | 258 (0.3) | 95 (0.5) | 21 (0.7) |
| Impaired sensorium, n (%) | 589 (0.8) | 283 (1.5) | 143 (5.0) |
| Weight loss, n (%) | 5,661 (7.4) | 1,762 (9.6) | 446 (15.6) |
| Functional status, n (%) | |||
| Independent in ADL | 68,365 (89.8) | 15,191 (82.2) | 1,712 (60.0) |
| Dependent in >1 ADL | 7,731 (10.2) | 3,240 (17.7) | 1,139 (39.9) |
| Null | 1 (0.0) | - | - |
| Hematocrit, %, median (range) | 37 (8.0–58.9) | 36 (8.4–58.5) | 33 (11.2–53.0) |
| Albumin, g/dL, median (range) | 3.7 (1.0–9.8) | 3.5 (1.0–9.7) | 2.9 (1.0–8.5) |
| Creatinine, mg/dL, median (range) | 0.9 (0.1–15.0) | 0.9 (0.1–15.0) | 1.0 (0.1–15.0) |
Racial categories may include Hispanic ethnicity.
ADL, activities of daily living; ASA, American Society of Anesthesiologists; BMI, body mass index.
Table 3.
Baseline Patient Characteristics and Comorbidity
| Variable | Total (n = 76,106) | Major morbidity (n = 18,436) | 30-d mortality (n = 2,853) |
|---|---|---|---|
| Myocardial infarction | 669 (0.9%) | 275 (1.5%) | 89 (3.1%) |
| Congestive heart failure | 1,161 (1.5%) | 487 (2.6 %) | 228 (8.0%) |
| Previous PCI | 6,892 (9.1%) | 2,026 (11.0%) | 398 (14.0%) |
| Previous PCS | 7,190 (9.5%) | 2,085 (11.3%) | 470 (16.5%) |
| Angina | 671 (0.9%) | 242 (1.3%) | 57 (2.0%) |
| Hypertension on medication | 51,531 (67.7%) | 13,054 (70.8%) | 2,144 (75.1%) |
| COPD | 6,314 (8.3%) | 2,301 (12.5%) | 554 (19.4%) |
| Diabetes | |||
| Insulin | 5,364 (7.1%) | 1,701 (9.2%) | 353 (12.4%) |
| Oral | 10,158 (13.3%) | 2,523 (13.7%) | 412 (14.4%) |
| Peripheral vascular disease | 1,783 (2.3%) | 648 (3.5%) | 166 (5.8%) |
| Rest pain/gangrene | 135 (0.2%) | 61 (0.3%) | 22 (0.8%) |
| Transient ischemic attack | 3,287 (4.3%) | 915 (5.0%) | 168 (5.9%) |
| CVA without deficit | 2,506 (3.3%) | 722 (3.9%) | 161 (5.6%) |
| CVA with deficit | 2,512 (3.3%) | 833 (4.5%) | 188 (6.6%) |
| Esophageal varices | 130 (0.2%) | 42 (0.2%) | 22 (0.8%) |
| Ascites | 1586 (2.1%) | 580 (3.1%) | 330 (11.6%) |
| Disseminated cancer | 5,435 (7.1%) | 1,512 (8.2%) | 493 (17.3%) |
CVA, cerebrovascular accident; PCI, percutaneous coronary intervention; PCS, previous cardiac surgery.
Figure 2.
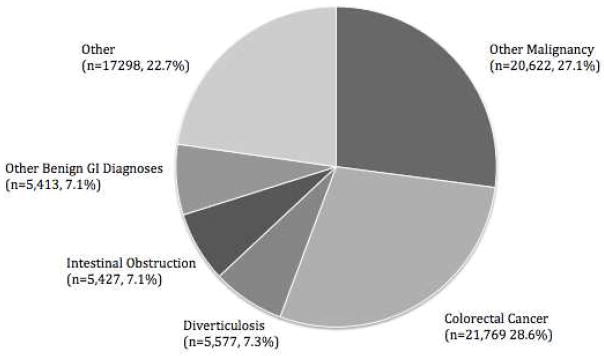
Diagnoses by CCS code. GI, gastronintestinal.
Outcomes
Thirty-day mortality was seen in 2,853 patients or 3.7% of the study population. Major complications were seen in 18,436 patients or 24.2% of the total cohort. The frequency of specific postoperative complications is reported in Figure 1. The most common major complication was superficial surgical site infection (n=5,171), followed by reoperation and sepsis (n = 4,852 and 3,866 respectively). 1,928 or 10.5% of patients with major morbidity went on to experience 30-day mortality.
Expanded Risk Prediction Model
The results of the expanded frailty risk models are reported in Table 4. Impairments in either cognition or function were highly associated with adverse perioperative outcome. Patients with total dependence in ADL were 3.661 times more likely to die (95% Confidence Interval [CI]: 3.172, 4.226; p<0.001) and 2.078 times more likely to have a major complication (95% CI: 1.866, 2.314; p<0.001). Impaired sensorium was associated with 1.511-increased odds of death (95% CI: 1.215, 1.878; p<0.001) and 1.205 increased odds of major morbidity (95% CI: 1.013, 1.434; p=0.035). Additionally, patients with low preoperative albumin were 2.299 times more likely to die within 30 days (95% CI: 2.078, 2.542; p<0.001) and were 1.340 times as likely to experience major complication (95% CI: 1.280, 1.402; p<0.001).
Table 4.
Multivariate Logistic Regression: Expanded Frailty Model
| Mortality | Major Morbidity | |||
|---|---|---|---|---|
| Variable | Odds Ratio (95% CI) | p Value | Odds Ratio (95% CI) | p Value |
| Age | 1.036 (1.030, 1.043) | <0.001 | - | - |
| Female | 0.820 (0.757, 0.890) | <0.001 | 0.884 (0.854, 0.915) | <0.001 |
| Race* | ||||
| African American | 0.836 (0.724, 0.964) | 0.014 | 1.098 (1.031, 1.168) | 0.003 |
| Asian or Hawaiian | 0.791 (0.587, 1.067) | 0.125 | 0.899 (0.801, 1.010) | 0.074 |
| BMI, kg/m2 | ||||
| 10–18 | 1.402 (1.159, 1.697) | <0.001 | 1.000 (0.898, 1.114) | 0.996 |
| 25–35 | 0.805 (0.731, 0.887) | <0.001 | 1.029 (0.987, 1.073) | 0.182 |
| 30–35 | 0.755 (0.667, 0.856) | <0.001 | 1.116 (1.061, 1.175) | <0.001 |
| >35 | 0.727 (0.626, 0.844) | <0.001 | 1.301 (1.225, 1.382) | <0.001 |
| ASA Class | ||||
| II | 0.636 (0.296, 1.370) | 0.248 | 1.315 (1.025, 1.689) | 0.032 |
| III | 1.515 (0.710, 3.231) | 0.282 | 1.900 (1.481, 2.438) | <0.001 |
| IV | 3.026 (1.413, 6.483) | 0.004 | 2.605 (2.081, 3.362) | <0.001 |
| Transfer status | ||||
| Acute care facility | 1.262 (1.088, 1.465) | 0.002 | 1.320 (1.204, 1.448) | <0.001 |
| Chronic care facility | 0.865 (0.728, 1.027) | 0.097 | 0.982 (0.879, 1.096) | 0.740 |
| Functional status | ||||
| Partially dependent | 1.950 (1.753, 2.170) | <0.001 | 1.534 (1.443, 1.631) | <0.001 |
| Totally dependent | 3.661 (3.172, 4.226) | <0.001 | 2.078 (1.866, 2.314) | <0.001 |
| Impaired sensorium | 1.511 (1.215, 1.878) | 0.002 | 1.205 (1.013, 1.434) | 0.035 |
| Hematocrit | ||||
| <25% | 1.369 (1.080, 1.735) | 0.010 | 1.264 (1.100, 1.453) | 0.001 |
| 25–35% | 1.232 (1.125, 1.348) | <0.001 | 1.106 (1.063, 1.150) | <0.001 |
| Albumin <3.4 g/dL | 2.299 (2.078, 2.542) | <0.001 | 1.340 (1.280, 1.402) | <0.001 |
| Creatinine >2 mg/dL | 1.490 (1.302, 1.706) | <0.001 | - | - |
| Comorbidity index† | ||||
| 0–0.1 | 1.294 (1.114, 1.504) | <0.001 | 1.022 (0.973, 1.074) | 0.382 |
| 0.1–0.2 | 1.804 (1.552, 2.096) | <0.001 | 1.118 (1.060, 1.180) | <0.001 |
| 0.2–0.3 | 2.237 (1.902, 2.632) | <0.001 | 1.213 (1.136, 1.296) | <0.001 |
| 0.3–0.4 | 2.680 (2.202, 3.260) | <0.001 | 1.404 (1.272, 1.549) | <0.001 |
| 0.4–0.5 | 3.545 (2.717, 4.626) | <0.001 | 1.444 (1.207, 1.728) | <0.001 |
| >0.5 | 3.448 (2.090, 5.686) | <0.001 | 1.176 (0.796, 1.738) | 0.416 |
Racial categories may include Hispanic ethnicity
Comorbidity Index = n/12 or the number of variables present, divided by the total number of comorbidities assessed (see Table 3).
BMI, body mass index; ASA, American Society of Anesthesiologists.
The 30-day risk of death and major complication was positively correlated with the level of preoperative comorbidity. Patients with ASA PS class of IV had a 3.026-fold increased risk of mortality (95% CI: 1.413, 6.483; p<0.001) and a 2.605-fold increased risk of morbidity (95% CI: 2.081, 3.362; p<0.001). Patients with a comorbidity index of ≥0.3 (≥3 preoperative comorbidities) were 2.680 times more likely to die (95% CI: 2.202, 3.260; p<0.001) and 1.404 times more likely to have major postoperative complication (95% CI: 1.272, 1.549; p<0.001).
The c-statistic for mortality was 0.813, and per the Hosmer-Lemeshow test, had good fit (p=0.367). The cross-validated c-statistic was 0.810. The model for major morbidity was well calibrated (Hosmer-Lemeshow p=0.455) with a c-statistic of 0.629 and 0.627 for the original and cross-validated ROC curves respectively.
Electronic Risk Prediction Model
The results of this simplified “auto-populated” prediction model are reported in Table 5. As above in the expanded model, preoperative comorbidity and serum albumin significantly predicted perioperative morbidity and mortality. Patients with ASA PS class IV had a 5.884-increased risk of mortality (95% CI: 2.768, 12.507, p<0.001) and a 3.281-increased risk of mortality (95% CI: 2.548, 4.225, p<0.001). Low preoperative albumin was associated with a 2.902-fold increased risk of death (95% CI: 2.636, 3.195; p<0.001) and a 1.499-fold increased risk of postoperative complication (95% CI: 1.434, 1.567; p<0.001).
Table 5.
Multivariate Logistic Regression: Auto-Populated Electronic Frailty Model
| Mortality | Major morbidity | |||
|---|---|---|---|---|
| Variable | Odds Ratio (95% CI) | p Value | Odds Ratio (95% CI) | p Value |
| Age | 1.040 (1.034, 1.046) | <0.001 | 1.003 (1.000, 1.006) | 0.0244 |
| Female | 0.793 (0.733, 0.859) | <0.001 | 0.877 (0.847, 0.907) | <0.001 |
| Race* | ||||
| African American | 0.903 (0.786, 1.038) | 0.151 | 1.116 (1.049, 1.187) | <0.001 |
| Asian or Hawaiian | 0.778 (0.579, 1.046) | 0.096 | 0.893 (0.795, 1.002) | 0.055 |
| BMI, kg/m2 | ||||
| 10–18 | 1.414 (1.172, 1.705) | <0.001 | 1.022 (0.918, 1.136) | 0.694 |
| 25–35 | 0.863 (0.784, 0.949) | 0.002 | 1.043 (1.000, 1.087) | 0.0473 |
| 30–35 | 0.855 (0.757, 0.966) | 0.012 | 1.146 (1.089, 1.206) | <0.001 |
| >35 | 0.894 (0.774, 1.032) | 0.127 | 1.367 (1.287, 1.452) | <0.001 |
| ASA Class | ||||
| II | 0.654 (0.305, 1.401) | 0.275 | 1.308 (1.020, 1.678) | 0.034 |
| III | 1.995 (0.941, 4.227) | 0.072 | 2.019 (1.576, 2.587) | <0.001 |
| IV | 5.884 (2.768, 12.507) | <0.001 | 3.281 (2.548, 4.225) | <0.001 |
| Hematocrit | ||||
| <25% | 1.686 (1.343, 2.116) | <0.001 | 1.376 (1.200, 1.578) | <0.001 |
| 25–35% | 1.394 (1.276, 1.522) | <0.001 | 1.162 (1.117, 1.208) | <0.001 |
| Albumin <3.4 g/dL | 2.902 (2.636, 3.195) | <0.001 | 1.499 (1.434, 1.567) | <0.001 |
| Creatinine >2 mg/dL | 1.747 (1.534, 1.989) | <0.001 | 1.087 (1.000, 1.180) | 0.100 |
Racial categories may include Hispanic ethnicity
BMI, body mass index; ASA, American Society of Anesthesiologists.
The predictive power of the electronically streamlined model was similar to the expanded frailty model above (Figure 3). The c-statistic for mortality was 0.795 and the model had good fit (Hosmer-Lemeshow p=0.202). The cross-validated c-statistic was 0.793. The model for major morbidity had a c-statistic of 0.621 (cross-validated = 0.620), and per the Hosmer-Lemeshow test also had good fit (p=0.601).
Figure 3.
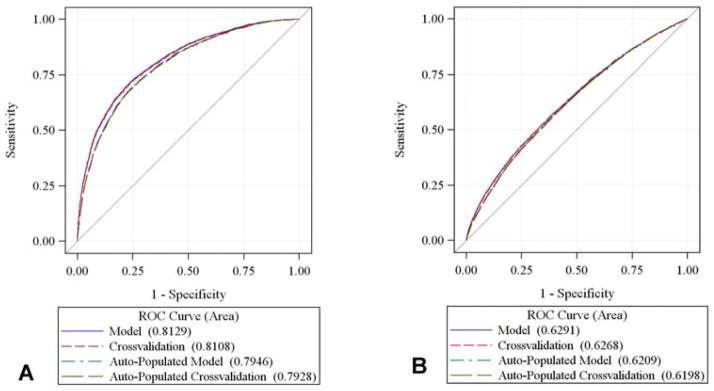
ROC curves. The area under the curve (AUC) is compared with that of the null hypothesis (AUC = 0.5, diagonal line). The AUC or c-statistic for the original and cross-validated models were not dissimilar. For the auto-populated model, the AUC for (A) 30-day mortality was 0.795, and (B) 0.623 for major morbidity.
Discussion
In this study we developed and evaluated two risk models that use only routine preoperative data to approximate a measure of frailty. One model included NSQIP variables which require entry by trained personnel, while the other included only those variables that could auto-populate from a EMR. Both of these models predicted perioperative death with similar accuracy to that of an established prospective frailty risk score (c-statistic = 0.813 and 0.795 vs 0.846).19 Our ability to forecast major postoperative morbidity was somewhat less predictive as compared to Robinson’s prospective score (c-statistic = 0.629 vs 0.702). However, it should be noted that Robinson’s model accounted for only 7% more variance in the outcome.
This difference could be related to the high prevalence of superficial surgical site infection (SSI) and reoperation observed in our study (54.4% of all complications). It is possible that frailty may not fully explain these outcomes; rather they reflect known risk factors for infection such surgical or antiseptic technique, antimicrobial prophylaxis, ASA PS, and obesity.39–41 SSI was included in our definition of major morbidity so as to parallel the outcomes assessed by both Robinson and the ACS-NSQIP risk calculator. Furthermore, there is substantial evidence to suggest that SSI is associated with significant morbidity and mortality (5-fold increased risk of death, longer postoperative hospitalization, and considerable financial costs).42,43 Nevertheless, there remains a subset of patients who experience only SSI, and none of the other major complications. Therefore, we created a morbidity model that excluded patients who had SSI as their only complication (data not shown). The predictors, odds ratios, and c-statistics were similar to the models presented in our manuscript. This suggests that SSI is collinear with other postoperative complication and our morbidity model is robust.
It is notable that the odds of mortality were highest among patients with a BMI <18, many of whom are likely cachectic. This supports prior frailty literature establishing a link between sarcopenia and mortality, and is consistent with the high proportion (>55%) of cancer patients included in our study.25,44 In contrast, we found that the odds of major complications increased with BMI >30. Other studies using the NSQIP dataset have replicated these findings in a variety of surgical subpopulations including abdominal, breast and lumbar surgery. 45–47
Our work builds on three existing models: the mFI, the ACS-NSQIP surgical risk calculator, and the above Robinson score. We integrate and expand on their findings to construct a frailty-based tool that predicts patient-specific operative risk. The mFI defines frailty as a sum of comorbidities and disabilities, and maps 11 predictors from the CSHA-FI to existing NSQIP variables.15 A recent study of 58,448 colectomy patients demonstrated that patients identified as frail by the mFI were at increased risk for 30-day Clavien class IV or class V complications (Odds Ratio [OR] 14.4, p=0.001).16 The ACS-NSQIP surgical risk calculator is a web-based tool that estimates patient-specific postoperative risk. This universal tool requires physicians to manually enter 21 preoperative demographics and comorbidities. While this can be cumbersome in the immediate preoperative period, a recent study by Bilimoria et al. found it highly predictive of 30-day mortality (c-statistic=0.944) and morbidity (c-statistic=0.816).48
Nevertheless there are several key distinctions between our work and the studies discussed above. First, both of our models are geriatric-specific and were developed in a high-risk elderly surgical population. Additionally, in contrast to the mFI and ACS-NSQIP risk calculator, which rely heavily on detailed past medical history, the EMR version of our model excludes comorbidities and requires minimal patient-provider interaction. This is notable as a recent study by Gibby et al. found that 15% of outpatient preanesthetic EMRs are missing the patient’s history and physical.49 Our work demonstrates that it is possible to have a high-fidelity predictive model based on a “bare bones” medical assessment.
This study has five main limitations. First, the NSQIP dataset captures a relatively narrow patient population. Only 10% of all US hospitals participate in ACS-NSQIP, the majority of them large academic centers.18 Additionally, the study was restricted to elderly colorectal surgical patients, and included a predominantly Caucasian sample. As such, it is unclear if our results would be generalizable to community-hospitals, younger patients, or other surgical populations. Second, because of NSQIP’s structure, the model cannot account for clustering or variations in outcome by hospital center or surgeon. Nor can it fully assess slowness or endurance, domains included in the more traditional definition of phenotypic frailty.10 Third, similar to most frailty studies, we did not add the indication for surgery into our model. Although we did eliminate emergency procedures, future analyses could consider the impact of preoperative diagnosis. Fourth, prior research suggests that there is a non-linear relationship between frailty and the number of physiologic systems impaired.50 As such, the measures and biomarkers included in our retrospective models may not be sensitive enough to capture the risk of complication for individuals who are “pre”-frail. Finally, this study is retrospective in design, and therefore merits prospective validation.
Future prospective studies are necessary to evaluate whether the EMR risk model is appropriate for screening other high-risk procedures and patient populations. Increasingly, patients and providers are able to choose between more and less invasive procedures eg. transaortic catheter valve replacement vs. aortic valve replacement. In this scenario, our EMR model could be immediately available for preoperative consultation and decision-making. Additional research is necessary to determine whether the availability of this patient-specific information changes postoperative outcomes as compared to the standard to care.
In conclusion, frailty has emerged as an important predictor of postoperative risk. However, the complexity of formal prospective frailty scores may restrict their use to larger academic medical centers. As the greatest number of elderly patients have surgery at smaller community hospitals,9 the creation of an economical, timely, and widely accessible preoperative frailty risk score is imperative. We have developed two simple geriatric-specific models that predict 30-day postoperative mortality with similar accuracy to that of formal geriatric evaluation. These models have the potential to extend geriatric risk-stratification to resource-poor settings, guide patient counseling, and ultimately inform the design of interventions to improve operative outcomes.
Acknowledgments
Support: This research is supported by NIH GEMSSTAR1 R03 AG040624-01, NIH R01 AG029656-01A1, NIA K08AG043548-01, the American Geriatrics Society Jahnigan Scholar Program, and the Foundation for Anesthesia Education and Research (FAER).
Abbreviations
- ACS-NSQIP
American College of Surgeons National Surgical Quality Improvement Program
- ADL
activities of daily living
- ASA PS
American Society of Anesthesiologists Physical Status
- AUC
area under the curve
- BMI
body mass index
- CCI
Charlson Comorbidity Index
- CCS
Clinical Classifications Software
- CHSA-FI
Canadian Study of Health and Aging Frailty Index
- CI
confidence interval
- COPD
Chronic Obstructive Pulmonary Disease
- CVA
cerebrovascular accident
- EMR
electronic medical record
- GI
gastrointestinal
- mFI
Modified Frailty Index
- OR
odds ratio
- PCI
percutaneous coronary intervention
- PCS
prior cardiac surgery
- ROC
receiver operating characteristic
- SSI
superficial surgical site infection
Footnotes
Disclosure Information: Nothing to disclose.
Disclosures outside the article: Dr Deiner has received pay as an expert witness and received pay for meeting expenses unrelated to the content of this article.
Publisher's Disclaimer: This is a PDF file of an unedited manuscript that has been accepted for publication. As a service to our customers we are providing this early version of the manuscript. The manuscript will undergo copyediting, typesetting, and review of the resulting proof before it is published in its final citable form. Please note that during the production process errors may be discovered which could affect the content, and all legal disclaimers that apply to the journal pertain.
References
- 1.US Census Bureau Population Division. Annual Estimates of Resident Population by Sex, Age, Race, and Hispanic Origin for the United States: April 1, 2010 to July 1, 2012. Washington DC: Government Printing Office; 2013. [Google Scholar]
- 2.US Census Bureau Population Division. Percent Distribution of the Projected Population by Selected Age Groups and Sex for the United States: 2015 to 2060 (NP2012-T3L) Washington DC: Government Printing Office; 2013. [Google Scholar]
- 3.National Center for Health Statistics. National Hospital Discharge Survey, 2010. Hyatsville Maryland: Public Health Service; 2010. [Google Scholar]
- 4.El-Haddawi F, Abu-Zidan FM, Jones W. Factors affecting surgical outcome in the elderly at Auckland Hospital. ANZ J Surg. 2002;72:537–541. doi: 10.1046/j.1445-2197.2002.02484.x. [DOI] [PubMed] [Google Scholar]
- 5.Fleisher LA, Beckman JA, Brown KA, et al. ACC/AHA 2007 Guidelines on Perioperative Cardiovascular Evaluation and Care for Noncardiac Surgery: Executive Summary: A Report of the American College of Cardiology/American Heart Association Task Force on Practice Guidelines (Writing Committee to Revise the 2002 Guidelines on Perioperative Cardiovascular Evaluation for Noncardiac Surgery): Developed in Collaboration With the American Society of Echocardiography, American Society of Nuclear Cardiology, Heart Rhythm Society, Society of Cardiovascular Anesthesiologists, Society for Cardiovascular Angiography and Interventions, Society for Vascular Medicine and Biology, and Society for Vascular Surgery. Circulation. 2007;116:1971–1996. doi: 10.1161/CIRCULATIONAHA.107.185700. [DOI] [PubMed] [Google Scholar]
- 6.Sundermann SH, Dademasch A, Seifert B, et al. Frailty is a predictor of short- and mid-term mortality after elective cardiac surgery independently of age. Interact Cardiovasc Thorac Surg. 2014 Feb 3; doi: 10.1093/icvts/ivu006. [DOI] [PubMed] [Google Scholar]
- 7.Deiner S, Silverstein JH. Anesthesia for geriatric patients. Minerva Anestesiol. 2011;77:180–189. [PubMed] [Google Scholar]
- 8.Ronning B, Wyller TB, Jordhoy MS, et al. Frailty indicators and functional status in older patients after colorectal cancer surgery. J Geriatr Oncol. 2014;5:26–32. doi: 10.1016/j.jgo.2013.08.001. [DOI] [PubMed] [Google Scholar]
- 9.Deiner S, Westlake BWT, Dutton RP. Patterns of surgical care and complications in the elderly. J Am Geriatr Soc. 2014 doi: 10.1111/jgs.12794. In press. [DOI] [PMC free article] [PubMed] [Google Scholar]
- 10.Fried LP, Tangen CM, Walston J, et al. Frailty in older adults: evidence for a phenotype. J Gerontol A Biol Sci Med Sci. 2001;56:M146–156. doi: 10.1093/gerona/56.3.m146. [DOI] [PubMed] [Google Scholar]
- 11.Winograd CH, Gerety MB, Chung M, et al. Screening for frailty: criteria and predictors of outcomes. J Am Geriatr Soc. 1991;39:778–784. doi: 10.1111/j.1532-5415.1991.tb02700.x. [DOI] [PubMed] [Google Scholar]
- 12.Makary MA, Segev DL, Pronovost PJ, et al. Frailty as a predictor of surgical outcomes in older patients. J Am Coll Surg. 2010;210:901–908. doi: 10.1016/j.jamcollsurg.2010.01.028. [DOI] [PubMed] [Google Scholar]
- 13.Amrock LG, SD The implication of frailty on preoperative risk assessment. Curr Opin Anasethesiol. doi: 10.1097/ACO.0000000000000065. In Press. [DOI] [PMC free article] [PubMed] [Google Scholar]
- 14.Theou O, Brothers TD, Mitnitski A, Rockwood K. Operationalization of frailty using eight commonly used scales and comparison of their ability to predict all-cause mortality. J Am Geriatr Soc. 2013;61:1537–1551. doi: 10.1111/jgs.12420. [DOI] [PubMed] [Google Scholar]
- 15.Farhat JS, Velanovich V, Falvo AJ, et al. Are the frail destined to fail? Frailty index as predictor of surgical morbidity and mortality in the elderly. J Trauma Acute Care Surg. 2012;72:1526–1530. doi: 10.1097/TA.0b013e3182542fab. discussion 1530–1521. [DOI] [PubMed] [Google Scholar]
- 16.Obeid NM, Azuh O, Reddy S, et al. Predictors of critical care-related complications in colectomy patients using the National Surgical Quality Improvement Program: exploring frailty and aggressive laparoscopic approaches. J Trauma Acute Care Surg. 2012;72:878–883. doi: 10.1097/TA.0b013e31824d0f70. [DOI] [PubMed] [Google Scholar]
- 17.Keller DS, Bankwitz B, Nobel T, Delaney CP. Using frailty to predict who will fail early discharge after laparoscopic colorectal surgery with an established recovery pathway. Dis Colon Rectum. 2014;57:337–342. doi: 10.1097/01.dcr.0000442661.76345.f5. [DOI] [PubMed] [Google Scholar]
- 18.American College of Surgeons National Surgical Quality Improvement Program ACoSNSQI. [Accessed November 18, 2013]; http://www.acsnsqip.org.
- 19.Robinson TN, Eiseman B, Wallace JI, et al. Redefining geriatric preoperative assessment using frailty, disability and co-morbidity. Ann Surg. 2009;250:449–455. doi: 10.1097/SLA.0b013e3181b45598. [DOI] [PubMed] [Google Scholar]
- 20.Robinson TN, Wu DS, Pointer L, et al. Simple frailty score predicts postoperative complications across surgical specialties. Am J Surg. 2013;206:544–550. doi: 10.1016/j.amjsurg.2013.03.012. [DOI] [PMC free article] [PubMed] [Google Scholar]
- 21.Elixhauser ASC, Palmer L. Clinical Classifications Software (CCS) 2014 http://www.hcup-us.ahrq.gov/toolssoftware/ccs/ccs.jsp.
- 22.Khuri SF. The NSQIP: a new frontier in surgery. Surgery Nov. 2005;138(5):837–843. doi: 10.1016/j.surg.2005.08.016. [DOI] [PubMed] [Google Scholar]
- 23.Shiloach M, Frencher SK, Jr, Steeger JE, et al. Toward robust information: data quality and inter-rater reliability in the American College of Surgeons National Surgical Quality Improvement Program. J Am Coll Surg. 2010;210:6–16. doi: 10.1016/j.jamcollsurg.2009.09.031. [DOI] [PubMed] [Google Scholar]
- 24.Cohen ME, Ko CY, Bilimoria KY, et al. Optimizing ACS NSQIP modeling for evaluation of surgical quality and risk: patient risk adjustment, procedure mix adjustment, shrinkage adjustment, and surgical focus. J Am Coll Surg. 2013;217:336–346. e331. doi: 10.1016/j.jamcollsurg.2013.02.027. [DOI] [PubMed] [Google Scholar]
- 25.Walston J, Hadley EC, Ferrucci L, et al. Research agenda for frailty in older adults: toward a better understanding of physiology and etiology: summary from the American Geriatrics Society/National Institute on Aging Research Conference on Frailty in Older Adults. J Am Geriatr Soc. 2006;54:991–1001. doi: 10.1111/j.1532-5415.2006.00745.x. [DOI] [PubMed] [Google Scholar]
- 26.Don BR, Kaysen G. Serum albumin: relationship to inflammation and nutrition. Semin Dial. 2004;17:432–437. doi: 10.1111/j.0894-0959.2004.17603.x. [DOI] [PubMed] [Google Scholar]
- 27.Dalrymple LS, Katz R, Rifkin DE, et al. Kidney function and prevalent and incident frailty. Clin J Am Soc Nephrol. 2013;8:2091–2099. doi: 10.2215/CJN.02870313. [DOI] [PMC free article] [PubMed] [Google Scholar]
- 28.Shlipak MG, Stehman-Breen C, Fried LF, et al. The presence of frailty in elderly persons with chronic renal insufficiency. Am J Kidney Dis. 2004;43:861–867. doi: 10.1053/j.ajkd.2003.12.049. [DOI] [PubMed] [Google Scholar]
- 29.Chaves PH, Semba RD, Leng SX, et al. Impact of anemia and cardiovascular disease on frailty status of community-dwelling older women: the Women’s Health and Aging Studies I and II. J Gerontol A Biol Sci Med Sci. 2005;60:729–735. doi: 10.1093/gerona/60.6.729. [DOI] [PubMed] [Google Scholar]
- 30.Saklad M. Grading of patients for surgical procedures. Anesthesiology. 1941;2:281–284. [Google Scholar]
- 31.Rockwood K, Song X, MacKnight C, et al. A global clinical measure of fitness and frailty in elderly people. CMAJ. 2005;173:489–495. doi: 10.1503/cmaj.050051. [DOI] [PMC free article] [PubMed] [Google Scholar]
- 32.Charlson ME, Pompei P, Ales KL, MacKenzie CR. A new method of classifying prognostic comorbidity in longitudinal studies: development and validation. J Chronic Dis. 1987;40:373–383. doi: 10.1016/0021-9681(87)90171-8. [DOI] [PubMed] [Google Scholar]
- 33.Rockwood K, Andrew M, Mitnitski A. A comparison of two approaches to measuring frailty in elderly people. J Gerontol A Biol Sci Med Sci. 2007;62:738–743. doi: 10.1093/gerona/62.7.738. [DOI] [PubMed] [Google Scholar]
- 34.Ehlert BA, Durham CA, Parker FM, et al. Impact of operative indication and surgical complexity on outcomes after thoracic endovascular aortic repair at National Surgical Quality Improvement Program Centers. J Vasc Surg. 2011;54:1629–1636. doi: 10.1016/j.jvs.2011.05.116. [DOI] [PubMed] [Google Scholar]
- 35.D’Hoore W, Bouckaert A, Tilquin C. Practical considerations on the use of the Charlson comorbidity index with administrative data bases. J Clin Epidemiol. 1996;49:1429–1433. doi: 10.1016/s0895-4356(96)00271-5. [DOI] [PubMed] [Google Scholar]
- 36.Quan H, Li B, Couris CM, et al. Updating and validating the Charlson comorbidity index and score for risk adjustment in hospital discharge abstracts using data from 6 countries. Am J Epidemiol. 2011;173:676–682. doi: 10.1093/aje/kwq433. [DOI] [PubMed] [Google Scholar]
- 37.Lemeshow S, Hosmer DW., Jr A review of goodness of fit statistics for use in the development of logistic regression models. Am J Epidemiol. 1982;115:92–106. doi: 10.1093/oxfordjournals.aje.a113284. [DOI] [PubMed] [Google Scholar]
- 38.Steyerberg EW, Harrell FE, Jr, Borsboom GJ, et al. Internal validation of predictive models: efficiency of some procedures for logistic regression analysis. J Clin Epidemiol. 2001;54:774–781. doi: 10.1016/s0895-4356(01)00341-9. [DOI] [PubMed] [Google Scholar]
- 39.Alexander JW, Solomkin JS, Edwards MJ. Updated recommendations for control of surgical site infections. Ann Surg. 2011;253:1082–1093. doi: 10.1097/SLA.0b013e31821175f8. [DOI] [PubMed] [Google Scholar]
- 40.Fry DE. The prevention of surgical site infection in elective colon surgery. Scientifica (Cairo) 2013;2013:896297. doi: 10.1155/2013/896297. [DOI] [PMC free article] [PubMed] [Google Scholar]
- 41.Khan M, Rooh ul M, Zarin M, et al. Influence of ASA score and Charlson Comorbidity Index on the surgical site infection rates. J Coll Physicians Surg Pak. 2010;20:506–509. [PubMed] [Google Scholar]
- 42.Kaye KS, Anderson DJ, Sloane R, et al. The effect of surgical site infection on older operative patients. J Am Geriatr Soc. 2009;57:46–54. doi: 10.1111/j.1532-5415.2008.02053.x. [DOI] [PMC free article] [PubMed] [Google Scholar]
- 43.McGarry SA, Engemann JJ, Schmader K, et al. Surgical-site infection due to Staphylococcus aureus among elderly patients: mortality, duration of hospitalization, and cost. Infect Control Hosp Epidemiol. 2004;25:461–467. doi: 10.1086/502422. [DOI] [PubMed] [Google Scholar]
- 44.Tsai S. Importance of lean body mass in the oncologic patient. Nutr Clin Pract. 2012;27:593–598. doi: 10.1177/0884533612457949. [DOI] [PubMed] [Google Scholar]
- 45.Fischer JP, Nelson JA, Kovach SJ, et al. Impact of obesity on outcomes in breast reconstruction: analysis of 15,937 patients from the ACS-NSQIP datasets. J Am Coll Surg. 2013;217:656–664. doi: 10.1016/j.jamcollsurg.2013.03.031. [DOI] [PubMed] [Google Scholar]
- 46.Marquez-Lara A, Nandyala SV, Sankaaranrayanan S, et al. Body mass index as a predictor of complications and mortality following lumbar spine surgery. Spine. 2014 Jan 29; doi: 10.1097/BRS.0000000000000232. [DOI] [PubMed] [Google Scholar]
- 47.Nelson JA, Fischer JP, Cleveland EC, et al. Abdominal wall reconstruction in the obese: an assessment of complications from the National Surgical Quality Improvement Program datasets. Am J Surg. 2014 Jan 4; doi: 10.1016/j.amjsurg.2013.08.047. [DOI] [PubMed] [Google Scholar]
- 48.Bilimoria KY, Liu Y, Paruch JL, et al. Development and evaluation of the universal ACS NSQIP surgical risk calculator: a decision aid and informed consent tool for patients and surgeons. J Am Coll Surg. 2013;217:833–842. e831–833. doi: 10.1016/j.jamcollsurg.2013.07.385. [DOI] [PMC free article] [PubMed] [Google Scholar]
- 49.Gibby GL, Schwab WK. Availability of records in an outpatient preanesthetic evaluation clinic. J Clin Monit Comput. 1998;14:385–391. doi: 10.1023/a:1009971521520. [DOI] [PubMed] [Google Scholar]
- 50.Fried LP, Xue QL, Cappola AR, et al. Nonlinear multisystem physiological dysregulation associated with frailty in older women: implications for etiology and treatment. J Gerontol A Biol Sci Med Sci. 2009;64:1049–1057. doi: 10.1093/gerona/glp076. [DOI] [PMC free article] [PubMed] [Google Scholar]