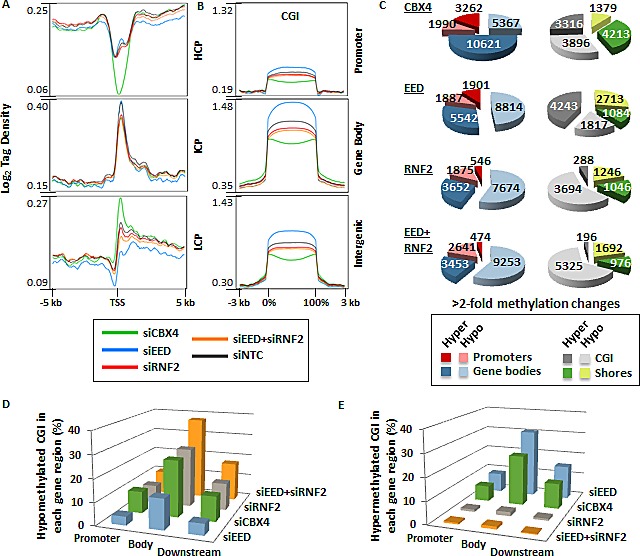
Figure 4. Impact of PRC1 and PRC2 depletion on DNA methylation patterns.

(A) Tag density plots of methylation from −5 to +5 kb across gene promoters at high CpG density loci (HCP), intermediate CpG density loci (ICP), and low CpG density loci (LCP) as defined in [43]. (B) Tag density plots of methylation across CGI located in promoters, gene bodies, and intergenic regions. (C) Pie charts for genes with >2-fold decreased and increased 5mC in promoters, gene bodies, CGI, and CGI shores. (D-E) Bar graphs illustrate the proportion of CGI in promoters, gene bodies, and downstream of genes that become hypomethylated (D) or hypermethylated (E) in each siRNA depletion.
