

Abstract
Corporate voluntary pledges to improve the health of Americans have not been held to either explicit measurable outcomes or a framework for independent evaluation. The Healthy Weight Commitment Foundation (HWCF), whose members include 16 of the nation’s leading consumer packaged goods (CPG) food and beverage manufacturers, voluntarily pledged to collectively sell 1 trillion fewer calories in the U.S. marketplace by 2012 (against a 2007 baseline), and sell 1.5 trillion fewer calories by 2015. This paper presents the findings of an independent evaluation of the 2012 HWCF marketplace pledge, conducted in 2013. The 16 HWCF companies collectively sold approximately 6.4 trillion fewer calories (−10.6%) in 2012 than in the baseline year of 2007. Taking into account population changes over the 5-year period of 2007–2012, CPG caloric sales from brands included in the HWCF pledge declined by an average of 78 kcals/capita/day. CPG caloric sales from non-HWCF national brands during the same period declined by 11 kcals/capita/day, but there was little change in calories from private label products. Thus, the total reduction in CPG caloric sales between 2007 and 2012 was 87 kcals/capita/day. This independent evaluation is the first to evaluate food industry compliance with its calorie reduction pledges and to assess how sales from the CPG food and beverage sector are changing. An accompanying paper investigates the extent to which the HWCF pledge affected household-level changes in CPG calories purchased, controlling for important economic and sociodemographic factors affecting household food purchases over this period.
Introduction
Reducing the prevalence and health consequences of overweight and obesity nationwide is a clear national public health and economic priority. Many researchers stress the need for change and leadership by national and global food companies.1,2 Some scholars argue that there is a need to return to traditional food and local markets,3–6 whereas others promote the need for changes in the formulation and marketing of the consumer packaged goods (CPG) food and beverage sector, which accounts for nearly two thirds of the calories Americans consume,7 especially calories from saturated fats and added sugars.8–12
In response, CPG food and beverage companies have begun making some pledges. For example, the American Beverage Association and the Alliance for a Healthier Generation implemented new national school beverage guidelines to reduce the sales to and youth consumption of calories from sugar-sweetened beverages during the school day.13,14 Other voluntary pledges have been made to reduce advertising to children by the nation’s largest food and beverage companies.15,16 Many scholars have attempted to delineate if, and how, such voluntary efforts might reduce children’s caloric intake and excess weight gain; however, these evaluations have either not been independently conducted (without industry funding) or have not tracked actual changes in sales, purchases, or diets.17–21 Skepticism about the motivation and outcomes of these pledges19,22–28 underscores the need for objective, independent evaluations, as well as the role of third parties to support such work.
In this context, an independent evaluation of the voluntary Healthy Weight Commitment Foundation (HWCF) marketplace pledge is unique. The HWCF is a national, multi-year effort designed to help reduce obesity—especially childhood obesity—by 2015. In the marketplace, HWCF’s focus is on —reducing or controlling calories while preserving or enhancing the overall nutrition of healthier product options.”29 Using 2007 as a baseline year, 16 HWCF food-manufacturing companies pledged to collectively sell 1.5 trillion fewer calories from the marketplace by 2015, with an interim goal of 1 trillion calories by 2012.29 The 1.5 trillion target was based on the estimated HWCF share (25% of total energy consumed in the U.S.) of the published estimates of the calorie gap needed to prevent excessive weight gain among the nation’s children and adolescents aged 2–18 years,30 assuming that both dietary/caloric intake and physical activity/energy expenditure should have an equal role in reducing obesity. The Robert Wood Johnson Foundation (RWJF) stepped forward to fund a rigorous, independent evaluation of the HWCF marketplace pledge to assess its impact on the numbers of calories sold and purchased in the U.S., and consumed by the nation’s children and adolescents.29
This paper provides the results of the independent evaluation of the HWCF marketplace pledge based on measured CPG food and beverages sales conducted in 2013. The authors of this paper have no ties with the HWCF or any of its members, and were funded by RWJF to conduct this work. This paper seeks to answer the following questions:
What was the HWCF companies’ collective change in total calorie sales between 2007 and 2012 (and hence did they meet the pledge they made)?
Which food and beverage categories were major sources of the reductions or increases in calories sold?
An accompanying paper31 addresses a third question: was the HWCF marketplace pledge associated with changes in the CPG calories purchased by U.S. households with children aged 2–18 years, controlling for key sociodemographic and economic factors affecting food purchases?
To ensure the highest scientific integrity and quality, an independent Evaluation Advisory Committee of eminent scholars provided scientific review and advice along the way.7 A critical dimension of all work is reproducibility in decisions regarding the methods and metrics used.
The Healthy Weight Commitment Foundation Marketplace Pledge
The sixteen companies who joined the HWCF marketplace pledge are: Bumble Bee Foods, LLC, Campbell Soup Company, ConAgra Foods, General Mills, Inc., Kellogg Company, Kraft Foods, Inc. (now split into Kraft Foods and Mondelēz International), Mars, Incorporated, McCormick & Company, Inc., Nestlé USA, PepsiCo, Inc., Post Foods/Ralston Foods, LLC, Hillshire Brands (previously Sara Lee Corporation), The Coca-Cola Company, The Hershey Company, The J.M. Smucker Company, and Unilever.
The HWCF marketplace pledge includes all HWCF companies’ products that are sold as packaged or processed products with a barcode or Universal Product Code (UPC) that can be scanned or audited. This includes products sold through vending and in stores (grocery/food stores, drug stores, mass merchandisers, and convenience stores). Excluded products consist of:
jointly manufactured or distributed products by HWCF and non-HWCF companies;
product lines and brands acquired from or sold to non-HWCF companies after 2007;
HWCF companies’ products that are sold as store-brand/generic/private-label (PL) products (e.g., Walmart’s Great Value™, Kroger’s Simple Truth™);
HWCF companies’ products that are sold through food service venues (e.g., cafeterias, concessions); and
HWCF component ingredients that go into producing food-service products (e.g., cola syrups) and that are not individually packaged for direct sale to consumers.
Data Sources
For reproducibility of findings, this study used existing publically or commercially available data that was not reliant on propriety data from the 16 participating companies. A detailed review of these sources is provided elsewhere.32
Nielsen Scantrack data from 2007 and 2012 were used to track the total caloric sales in the U.S., and caloric sales from three mutually exclusive brand categories: HWCF brands, non-HWCF national brands, and private labels ([PLs], also known as store or generic brands, produced by HWCF or non-HWCF companies, but controlled by retailers). The Scantrack data contains information on the weekly dollar sales, and units sold of all UPC transactions at participating grocery, drug, and mass-merchandisers in 2007 and 2012. These are point of sale data and do not include information about the individuals or households that products were sold to.32 Sampling limitations and representativeness are offset by using the Nielsen Homescan data.
Nielsen Homescan data from 2007 and 2012 were used to track total caloric purchases and caloric purchases by U.S. households from each of the three brand categories. The Homescan data contain detailed UPC-level information about household food purchases brought into the home, and cover all UPC transactions from all outlet channels, including grocery, drug, mass-merchandise, club, supercenter, and convenience stores. The data are collected daily by providing scanning equipment to a nationally representative sample of over 60,000 households in 2007 and 2012.33–35
Nutrition Facts Label (NFL) data are the information provided in the familiar rectangular box in a standard format on labels of foods and beverages. Label information on macronutrients, other vitamins and minerals, and ingredients36 from each UPC are from several commercial sources.7
Methods
Linking Nielsen Scantrack (Sales) and Homescan (Purchase) Data to NFL Data
To determine total caloric sales, NFL data were linked with Nielsen Scantrack UPCs, as well as Nielsen Homescan UPCs (for adjusting the Scantrack data). This linking strategy reliably accounted for 95.1% of the total volume sales in 2007 and 97.2% of 2012 volume sales from Scantrack, of which HWCF products were reliably matched for 99.2%–99.5% by volume (Appendix A). Mutually exclusive food (51) and beverage (11) categories were used for examining key calorie sources (Appendix B). The food and beverage categories were based on Nielsen-developed modules that reflect product placement in stores and are not nutritionally based. Future analyses looking at the effects of the decline in calorie sales on children’s diets will base categorizations on U.S. Department of Agriculture (USDA)-defined food and beverage groups.37
Identifying HWCF Products Included in the Pledge in 2007 and 2012
To distinguish the mutually exclusive proportion of calories from HWCF companies, non-HWCF companies, and PL, all foods and beverages were classified according to our best understanding of brands and product lines. This included identifying brands/product lines manufactured and sold by each of the 16 companies annually during the period from 2007 to 2012 to determine when sales, purchases/acquisitions or mergers, introductions/product launches, or discontinuations of brands/product lines by each of the HWCF companies occurred. New brands/products lines that were introduced or launched since 2007 were included. However, for the purpose of identifying HWCF products over time, any sales, acquisitions, or mergers that involved a change in either ownership or HWCF status were reflected in the data in the year following the transaction. In addition, products that were licensed, distributed, or produced (jointly or fully) by other manufacturers or brand divisions owned by other companies were excluded. Certain product lines were partially owned by HWCF companies, so only items for which any HWCF company was a majority owner were included. Lastly, because the HWCF pledge excluded products acquired from or sold to non-HWCF companies after 2007, these were not classified as HWCF in the 2007 and 2012 data for the evaluation. Consequently, the 2007 unadjusted results presented here are different from the results presented in the baseline manuscript.7 Table 1 provides descriptions and examples of how brands or products were classified as HWCF in this evaluation and the proportion of volume and calories they represent.
Table 1.
Description and examples of how UPCs/brands are classified as HWCF for the 2012 HWCF evaluation
| Transactions between January 2008–December 2012 | 2007 UPCs | 2012 UPCs | UPCs included (✓) and excluded (✘) as HWCF in 2012 evaluation | |||||
|---|---|---|---|---|---|---|---|---|
|
| ||||||||
| Number of unique UPCs | % of total volume sales | % of total caloric sales | Number of unique UPCs | % of total volume sales | % of total caloric sales | 2007 | 2012 | |
| No change in UPC or brand A | 18,808 | 33.0% | 33.3% | 18,808 | 20.4% | 20.1% | ✓ | ✓ |
| HWCF company sold licensing, distribution, or manufacturing rights of brand B to non-HWCF company; HWCF company begins jointly manufacturing or distributing brand B with non-HWCF company (e.g., Unilever sold Bertolli Olive Oils to Grupo SOS in 2008; Sara Lee sold Sara Lee Bakery Group products to Grupo Bimbo in 2010) | 1,017 | 0.7% | 0.6% | 1,017 | 0.4% | 0.6% | ✘ (Based on exclusion criteria) | ✘ (Based on exclusion criteria) |
| HWCF company bought brand C from non-HWCF company (e.g., Campbell’s Soup Co acquired Wolfgang Puck Soups from Country Gourmet Foods in 2008; Kraft acquired Cadbury in 2010) | 1,542 | 1.5% | 0.5% | 1,542 | 0.9% | 0.4% | ✘ (Not owned by HWCF in 2007) | ✘ (Based on exclusion criteria) |
| HWCF company discontinued UPC or brand D | 12,045 | 2.2% | 2.1% | N/A | N/A | N/A | ✓ | ✘ (No longer owned by HWCF) |
| HWCF company introduced new UPC or brand E | N/A | N/A | N/A | 19,638 | 12.3% | 12.8% | ✘ (did not exist in 2007) | ✓ |
|
| ||||||||
| Total owned by HWCF | 33,412 | 37.5% | 36.5% | 41,005 | 33.9% | 33.9% | 30,853 unique UPCs; 35.2% of volume sales; 35.4% of caloric sales | 38,446 unique UPCs; 32.7% of volume sales; 32.9 % of caloric sales |
|
| ||||||||
| Total owned by other brands categories (non- HWCF national brands and private labels) | 365,552 | 62.5% | 63.5% | 476,978 | 66.1% | 66.0% | 368,111 unique UPCs; 64.8% of volume sales; 64.6% of caloric sales | 479,537 unique UPCs; 67.3% of volume sales; 67.1% of caloric sales |
Note: Products included in the baseline paper for the year 2007 (Slining et al., 2012) will be different from those used for year 2007 in the interim (2012) evaluation.
Calculations based in part on data reported by Nielsen through its Scantrack and Homescan Services for the food and beverage categories for the U.S. market and food, drug, and mass merchandisers (for 2007 and 2012) and convenience store channels (for 2012 only). Copyright © 2013, The Nielsen Company.
HWCF, Healthy Weight Commitment Foundation, N/A, not applicable; UPC, Universal Product Code
Adjusting Sales (Scantrack) Using Purchase (Homescan) Data
A simple aggregate of calories sold as captured in Scantrack will underestimate national sales because the sample does not include Walmart, club stores, convenience, and smaller stores that can represent a substantial proportion of sales.32 Using nationally representative Homescan data for the same years, food category-brand-outlet–specific proportions of purchases from stores that are not included in the Scantrack sales projections were estimated to adjust Scantrack and more fully capture calories sold. The adjusted 2007 and 2012 Scantrack estimates provide the basis for total caloric shares of HWCF products sold compared to non-HWCF and PL products in this evaluation. The results are presented both in terms of absolute values for the total US, as well as by per capita per day in order to account for population changes and allow for interpretability. All analyses were conducted using SAS, version 9.3 (SAS Institute Inc., Cary NC).
Results
Total Calories Sold by Brand Category in 2007 and 2012 in the U.S
Figure 1 shows the total CPG caloric sales by aggregate HWCF brands, non-HWCF brands, and PL brands in 2007 and 2012 using Scantrack data only compared to Scantrack adjusted for missing stores using the same years from Homescan. Based on the adjusted Scantrack values, of the 170.5 trillion calories sold from packaged foods and beverages in 2007, 60.4 trillion calories (or 35.5%) were from the 16 HWCF companies. Non-HWCF brands account for another 40.7%, and PL products account for the remaining 23.9%. By 2012, these values were 32.3%, 42.3% and 25.4%, respectively. Total calories sold by the HWCF companies fell from 60.4 trillion in 2007 to 54 trillion in 2012—a decrease of 6.4 trillion calories (or −10.6%) over the 5-year pledge period (Figure 1).
Figure 1.
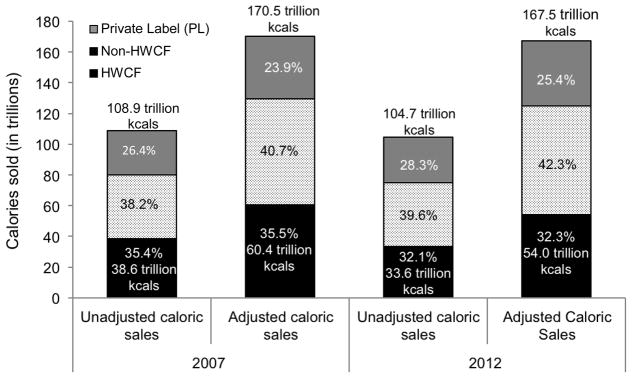
2007 and 2012 total annual calories sold (in trillions), unadjusted and adjusted
Source: Calculations based in part on data reported by Nielsen through its Scantrack and Homescan Services for the food and beverage categories for the U.S. market and food, drug, mass merchandisers (in 2007 and 2012) and convenience store channels (in 2012 only). Copyright © 2013, The Nielsen Company.
Changes in Average Daily per Capita Calories Sold by Brand Category and Food/Beverage Category
It is important to take into account population changes over this period, and Table 2 and Figure 2 present the average daily per capita CPG-adjusted calories sold in the U.S. in 2007 and 2012 for HWCF, non-HWCF, and PL brands. Table 2 also presents the sources of CPG calories sold in 51 distinct food, and 11 distinct beverage categories. Once population growth was taken into account, total CPG caloric sales (all brands) fell from 1,547 to 1,460 kcals/capita/day between 2007 and 2012. These changes were due to an average decline of 78 kcals (/capita/day) from brands included in the HWCF pledge, an average decline of 11 kcals from non-HWCF brands, and an average increase of 1 kcal from PL brands. Reductions from HWCF brands came primarily from: sweets and snacks (−21 kcals), grain products (−17 kcals) such as ready-to-eat (RTE) cereal and granolas, fats and oils, sauces and condiments (−15 kcals), and beverages (−14 kcals), particularly carbonated soft drinks (−7 kcals), and shelf-stable fruit and vegetable drinks/juices (−5 kcals). There were similar reductions in beverage calories from PL brands (−14 kcals), but calories from PL foods rose by 15 kcals/capita/day.
Table 2.
Average daily CPG calories solda in the U.S. by brand category, 2007 and 2012
| Average daily calories (kcals/capita/day) | Scantrack 2007 adjusted using Homescan 2007 | Scantrack 2012 adjusted using Homescan 2012 | 2007–2012 change |
|---|---|---|---|
| All CPG Foods and Beverages, all brands | 1,547 | 1,460 | −87 |
|
| |||
| Brands included in HWCF pledge | 549 | 471 | −78 |
| CPG foods only from HWCF brandsb | 475 | 412 | −63 |
| Dairy products excluding milk | 31 | 26 | −4 |
| Cheese | 17 | 13 | −4 |
| Yogurt | 4 | 3 | −1 |
| Frozen/refrigerated dairy-based toppings/condiments | 2 | 2 | 0 |
| Shelf-stable creamers, evaporated/condensed milks | 7 | 8 | 1 |
| Meat, poultry, fish, and mixtures | 18 | 16 | −2 |
| Refrigerated seafood | 0 | 0 | 0 |
| Frozen seafood | 0 | 0 | 0 |
| Frozen/fresh meat and poultry | 0 | 0 | 0 |
| Canned seafood and poultry | 1 | 0 | 0 |
| Canned processed meats | 1 | 1 | 0 |
| Refrigerated processed meats | 16 | 14 | −2 |
| Other protein sources | 0 | ||
| Fresh eggs | 0 | 0 | 0 |
| Nuts and seeds | 8 | 5 | −3 |
| Grain products, no RTE desserts | 116 | 99 | −17 |
| Cereals (requires cooking) | 6 | 5 | −1 |
| RTE cereals and granola | 39 | 33 | −6 |
| Boxed, dry pasta and rice | 1 | 1 | 0 |
| Fresh/frozen pasta | 0 | 0 | 0 |
| Boxed, pasta and rice dinners | 11 | 10 | −1 |
| Shelf-stable Mexican-style products | 1 | 1 | 0 |
| Dry baking mixes | 13 | 12 | −1 |
| Flours | 10 | 8 | −2 |
| RTE breads | 4 | 3 | −1 |
| Frozen baked goods | 2 | 2 | 0 |
| Refrigerated/frozen dough products | 10 | 8 | −2 |
| Frozen/refrigerated breakfast products | 5 | 5 | 0 |
| RTE sandwiches | 3 | 3 | 0 |
| Frozen/refrigerated pizza and appetizers | 9 | 8 | −1 |
| Fruits and vegetables | 6 | 5 | −1 |
| Fresh and frozen fruit | 0 | 0 | 0 |
| Canned/dried fruit | 2 | 2 | 0 |
| Canned/dried vegetables and legumes | 3 | 2 | −1 |
| Fresh and frozen vegetables | 1 | 1 | 0 |
| Fats, oils, sauces, and condiments | 70 | 54 | −15 |
| Fats and oils | 42 | 32 | −10 |
| Condiments, dressings, and sauces | 28 | 23 | −5 |
| Sweets and snacks | 196 | 175 | −21 |
| RTE cereal bars and toaster pastries | 13 | 12 | −1 |
| RTE grain-based desserts | 0 | 0 | 0 |
| Cookies | 20 | 17 | −4 |
| Crackers | 23 | 21 | −2 |
| Shelf-stable snacks | 57 | 52 | −5 |
| Spreads and dips | 0 | 0 | 0 |
| Candy and gum | 45 | 39 | −6 |
| Frozen/refrigerated pudding and ice cream | 15 | 12 | −4 |
| Shelf-stable pudding and gelatin | 2 | 2 | −1 |
| Shelf-stable dessert toppings | 2 | 2 | 0 |
| Sweeteners | 1 | 1 | 0 |
| Nut and fruit spreads | 15 | 16 | 1 |
| Other | 9 | 8 | 0 |
| Baby food | 0 | 0 | 0 |
| Baking supplies | 8 | 8 | −1 |
| Spices, seasoning, & extracts | 0 | 0 | 0 |
| Mixed dishes and soups | 23 | 24 | 1 |
| Frozen entrees | 10 | 14 | 3 |
| RTE, prepared dishes | 2 | 2 | 0 |
| Canned mixed dishes | 4 | 4 | −1 |
| Shelf-stable soups and stews | 6 | 5 | −1 |
| CPG beverages only from HWCF brandsb | 74 | 59 | −14 |
| Fresh plain milk | 0 | 0 | 0 |
| Refrigerated sweetened dairy drinks | 0 | 0 | 0 |
| Shelf-stable milks, milk substitutes, and milk-based powders | 0 | 1 | 0 |
| Shelf-stable fruit and vegetable drinks and juice | 23 | 18 | −5 |
| Frozen fruit drinks and juice | 1 | 0 | 0 |
| Beverage powder and concentrates | 5 | 4 | 0 |
| Carbonated soft drinks | 39 | 32 | −7 |
| Tea (bags, loose, RTD) | 3 | 3 | 0 |
| Coffee (grounds, beans, RTD) | 1 | 0 | 0 |
| Water and ice† | 1 | 0 | 0 |
| Alcohol | 0 | 0 | 0 |
|
| |||
| National brands not included in HWCF pledge | 629 | 618 | −11 |
| CPG foods only from non-HWCF national brands | 508 | 500 | −8 |
| CPG beverages only from non-HWCF national brands | 122 | 118 | −3 |
|
| |||
| Private labels/store brands | 370 | 371 | 1 |
| CPG foods only from private labels/store brands | 294 | 308 | 15 |
| CPG beverages only from private labels/store brands | 76 | 63 | −14 |
Source: Calculations based in part on data reported by Nielsen through its Scantrack and Homescan Services for the food and beverage categories for the U.S. market and food, drug, and mass merchandisers (for 2007 and 2012) and convenience store channels (for 2012 only). Copyright © 2013, The Nielsen Company.
Note: Unable to report SEs, as these values were based on total sales divided by the U.S. population at each year. The U.S. population in 2007 was 301,579,985; the U.S. population in 2012 was 313,933,954 (U.S. Census Bureau).
Commercial sales and purchase data (Nielsen Scantrack and Homescan) do not include sales or purchases from vending.
Sales at the UPC level are classified into 51 mutually exclusive food and 11 mutually exclusive beverage commercial categories based on Nielsen modules.
CPG, consumer packaged goods; HWCF, Healthy Weight Commitment Foundation; RTD, ready-to-drink; RTE, ready-to-eat; UPC, Universal Product Code.
Figure 2.

Changes in food and beverage calories sold per capita per day (adjusted) from 2007 to 2012 in total and by brand category
Source: Calculations based in part on data reported by Nielsen through its Scantrack and Homescan Services for the food and beverage categories for the U.S. market and food, drug, mass merchandisers (in 2007 and 2012) and convenience store channels (in 2012 only). Copyright © 2013, The Nielsen Company.
HWCF, Healthy Weight Commitment Foundation
Appendix C presents the results for adjusted calories sold in 2007 and 2012 for the full list of food and beverage categories ranked by contribution to total adjusted calories sold in 2007, as well as the proportion of calories that are attributed to HWCF products within each food category in 2007 and 2012. In 2007, the top sources of kcals (/capita/day) from CPG food categories included shelf-stable snacks (95 kcals), RTE breads (85 kcals), candy and gum (78 kcals), RTE cereals and granola (51 kcals), cheese (50 kcals), refrigerated processed meats (49 kcals), and cookies (43 kcals). HWCF products accounted for >50% of calories from these top food categories: shelf-stable snacks (59.9%), candy and gum (57.8%), and RTE cereals and granola (77.2%). Among beverage groups, the top sources of average daily calories per capita for 2007 included all fresh plain milk (80 kcals), carbonated soft drinks (65 kcals), and shelf-stable fruit and vegetable drinks and juice (51 kcals). HWCF caloric shares in the beverage groups were most pronounced for carbonated soft drinks (60.2%) and beverage powders and concentrates (68.7%).
By 2012, there were shifts in both the key sources of calories sold, and in the caloric share of HWCF brands for select categories. Food calories fell by 56 kcals (/capita/day). Food categories whose sales increased by >10% with noticeable absolute increases in calories sold in 2012 compared to 2007 included: frozen/refrigerated dairy–based toppings/condiments (+104.2%, +13 kcals) where there was a significant shift in the caloric shares from national brands (HWCF and non-HWCF) to PLs, and fresh and frozen fruit (+54.2%, +5 kcals). Meanwhile, food categories that had >10% decrease in calories sold in 2012 compared to 2007 included: candy and gum (−10.8%, −8 kcals), RTE cereals/granola (−13.6%, −7 kcals), and fresh/frozen vegetables (−14.4%, −5 kcals). However, there were no notable changes in the caloric shares by brand.
Overall, average daily per capita beverages caloric sales fell by 31 kcals (−7.7%) between 2007 and 2012, with both HWCF and PL brands reducing their share, while non-HWCF brands increased their caloric share. Alcohol was the only beverage category that had a noticeable increase in relative (+17.5%) and absolute (+6 kcals) calories sold, virtually all of which belonged to non-HWCF brands (99%). Meanwhile, beverage categories that had >10% decrease in calories sold in 2012 compared to 2007 also had the largest absolute declines in calories sold. These included: plain fresh milk (−15.1%, −15 kcals), shelf-stable fruit and vegetable drinks/juice (−19.4%, −12 kcals), and carbonated soft drinks (−10.9%, −9 kcals).
Discussion
The 16 HWCF companies collectively met and substantially exceeded both their interim 2012 goal of selling 1 trillion fewer calories, and their overall 2015 goal of selling 1.5 trillion fewer calories from the U.S. marketplace. Taking into account population changes over the 5-year period of 2007–2012, it is estimated that these reductions resulted in an average decline of 78 kcals/capita/day from brands included in the HWCF pledge, which compared favorably to an average decline of 11 kcals from non-HWCF brands, and an average increase of 1 kcal from PL brands. Across all three brand categories, calories sold from CPG foods fell by 56 kcals and calories sold from beverages fell by 31 kcals—for an aggregate total sales reduction of 87 kcal/capita/day. Reductions from HWCF brands came primarily from sweets and snacks (−21 kcals), grain products (−17 kcals), and beverages (−14 kcals).
The decline in calories sold from canned/dried vegetables and legumes, fresh/frozen vegetables, and canned/dried fruit, along with an increase in calories purchased from fresh/frozen fruit is in line with earlier research on trends in fruit and vegetable consumption.38–40 It might also suggest a shift towards buying more loose/unpackaged fruits from the fresh section of stores, at farmer’s markets, or away-from-home venues. Meanwhile, the findings on increased calories from alcohol sold are consistent with data from the USDA showing that both at-home and away-from-home alcoholic beverage expenditures rose between 2007 and 2012.41
The estimated reduction of 78 kcals/capita/day from HWCF products between 2007 and 2012 could be explained by a number of mechanisms, including (but not limited to): HWCF companies creating, marketing, and selling lower-calorie reformulations of existing products or creating new products; HWCF companies reducing package sizes or increasing price per volume or weight, thereby reducing sales without necessarily affecting revenue; loss of market share by HWCF products; selling off relatively higher caloric product lines or brands to non-HWCF companies; and acquiring relatively low caloric product lines from non-HWCF companies. It is challenging to disentangle whether and how much each of these possible mechanisms may have contributed to the noted reductions, but Table 1 provides an indication of what may have happened. The caloric sales of HWCF products remaining as HWCF throughout 2007–2012 fell sharply from 33.3% to 20.1%, as did their volume sales (albeit by less), indicating the collective decline in calories from these “stable” products was due to both loss of market share (in terms of volume, but not necessarily revenue) and some reformulations toward less energy-dense products.42 However, the reductions from “stable” products were somewhat compensated by sales of new products (+12.8% in caloric sales and +12.3% in volume sales), despite a slight decline of 2.1% caloric and 2.2% volume sales from discontinued products. With regard to HWCF selling off (buying) relatively higher (lower) caloric product lines or brands to (from) non-HWCF companies, these were excluded from the evaluation (Table 1). Were this not the case, the inclusion of brands/product lines that were sold from HWCF between 2007 and 2012 accounted for 0.6% of caloric sales or 1.02 trillion calories in 2007, and brands/product lines that were purchased by HWCF companies accounted for 0.4% of caloric sales or 0.67 trillion calories in 2012. Therefore, the net change in HWCF product sales between 2007 and 2012 would have been a reduction of another 0.35 trillion calories.
Additionally, the overall decline in calories sold by 87 kcals/capita/day could be due to factors such as consumers choosing healthier options overall, economic factors such as rising food prices, or the Great Recession that began at the end of 2007 and had lingering effects on purchasing behavior.43 Responses to changing economic conditions may have contributed to both reductions found in the sales of HWCF products and to the increases found in the sales of PL products, which are generally less costly. Because this paper only looks at sales at the aggregate national level, it is unable to answer questions about who changed their CPG purchases, how they have changed, or what the HWCF pledge meant with regard to the diets of children in the U.S. The accompanying paper31 seeks to examine whether and to what extent the HWCF pledge made a difference to CPG food and beverage purchases among U.S. households with children. Indeed, although this evaluation shows that the absolute caloric sales from HWCF companies declined considerably following their pledge, findings from the accompanying paper suggest that after accounting for sociodemographic and economic factors, the initial pre-pledge trajectory in caloric purchases from HWCF companies was not sustained, whereas non-HWCF companies outperformed their own pre-pledge trajectories in the post-pledge period.31
A critical test of the HWCF changes is ultimately how they affect the dietary intake of Americans, particularly children. Future analyses using National Health and Nutrition Examination Survey (NHANES) 2011–2012 will allow us to assess the associations between the HWCF efforts and measured changes in U.S. diets, particularly those of children in lower income and racial/ethnic populations at greatest risk for childhood obesity. This is particularly important given the large waste component,44 which suggests that the reductions in calories consumed may not be as large as those found in the reductions in calories sold or purchased, particularly from foods.45 Additionally, because this current evaluation focuses on the CPG sector, non-CPG sources (i.e., away-from-home eating) are not well represented in this study. Nonetheless, our results on the top caloric sales among CPG products corroborate other NHANES intake analyses demonstrating top caloric contributors as full-fat milk, sugar-sweetened beverages, grain-based desserts, pizza, breads and rolls, tortilla/corn dishes, savory snacks sweet snacks/candy, pasta/noodle dishes, meats and processed meat products, and RTE cereals.38,46 Moreover, because the HWCF pledge only refers to changes in calories sold, this evaluation does not look at other measures of nutritional concern. Changes in intakes of solid fats, added sugars, refined carbohydrates, and sodium were not specially examined, but their levels are still too high in the U.S.46,47 Similarly, different types of foods and beverages may affect satiety, blood glucose, and related physiologic responses differently despite having equal caloric value.48,49 Thus, it is important that future research focus on changes in other key macro- and micro-nutrients, as well as food types (e.g., cruciferous vegetables, whole versus refined grains).50,51
New studies indicate that industry efforts to reduce excess calories sold through product reformulation, changes in portion size, and marketing do not need to be at odds with profits and may actually lead to improved corporate bottom lines. Financial analyst reports are finding a growing business case for expanding industry’s “health and wellness” portfolio via reformulations and new product lines.52 A 2011 study funded by RWJF found that between 2006 and 2011, leading CPG companies (mostly members of the HWCF) that grew their lower-calorie or “better for you” foods and beverages enjoyed superior sales and operating profit growth.53,54 A recent HWCF-funded study found that lower calorie products are driving 82% of sales growth for HWCF companies specifically.54 These results should encourage other manufacturers and retailers to follow suit.
The complex nature of this evaluation effort and the limitations in available data sources led to several limitations. Foremost are the quality and the comprehensiveness of the NFL data. Both the ±20% labeling measurement buffer allowed between what is on the NFL and what is found during enforcement analyses36 and limitations in current legal reporting rules reduce data precision. Moreover, owing to the lack of complete NFL data, the caloric information for 4.9% of the volume sales in 2007 and 2.8% of the volume sales in 2012 were based on higher-level averages and were not product or brand specific. However, because our ability to match NFL data was higher for HWCF products compared to the other brand categories (Appendix A), we do not think this affected the estimate of the 6.4 trillion calorie reduction from HWCF products. In addition, this evaluation was unable to account for vending sales in 2007 or 2012 because vending data were not available in a format that allowed for linking with NFL data. However, in looking at NHANES 2007–2010, calories from food or beverages obtained from vending comprised <0.5% of calories on average. Therefore, we do not believe this omission would have affected the results.
In summary, between 2007 and 2012, the 16 HWCF food and beverage manufacturers met and exceeded their 2012 pledge, selling 6.4 trillion fewer calories from the marketplace in total, which translates to a reduction of 78 kcals/capita/day. There were some concurrent reductions by non-HWCF national brands, but greater reductions are needed. Meanwhile, absolute caloric sales from retailers’ PL products essentially did not change. PL/store brand products belonging to retailers represent an important and growing sector of the CPG food supply that also need to rise to the challenge of improving the quality of the food supply and contribute toward a collective effort to reduce the nation’s obesity rates in a sustainable manner. Follow-up studies are needed to assess the maintenance or expansion of these changes going forward.
Supplementary Material
Acknowledgments
The work presented in this paper was supported by funds from the Robert Wood Johnson Foundation (RWJF) for the Healthy Weight Commitment Foundation Evaluation project (grant nos. 67506, 68793, and 70017) and the Carolina Population Center (grant no. 5R24 HD050924). We thank current and past team members Izabela Annis, Phil Bardsley, Kuo-Ping Li and Donna Miles for exceptional data management and programming support; Gregory Bricker, Jessica Davis, Bridget Hollingsworth, Jiyoung Kang, Julie Wandell and Emily Ford Yoon for excellent research assistance; Frances L. Dancy for administrative assistance; and Tom Swasey for graphics assistance. We also thank and recognize RWJF staff members C. Tracy Orleans, James Marks, and Elaine Arkin for their extensive advice and guidance during the development of the methods for this evaluation, along with members of our Evaluation Advisory Committee: Steve Gortmaker (co-chair), Frank Chaloupka, Lisa Powell, Jennifer Seymour, Anna-Maria Siega-Riz, Mary Story, Jay Variyam, and Y. Claire Wang.
Shu Wen Ng, Meghan M. Slining, and Barry M. Popkin are funded by grants from NIH and RWJF. Shu Wen Ng and Meghan M. Slining have not consulted with or been a part of any conflicting relationship with the 16 HWCF companies evaluated in this project. Barry M. Popkin has been a co-investigator of one RCT funded by Nestle’s Water USA but has never consulted for them. He has a gift from Kraft and Gerber Foods to co-fund the dietary intake portion of the National Nutrition and Health Survey 2011–2012 conducted in Mexico by the National Institute of Public Health, Mexico.
Footnotes
Publisher's Disclaimer: This is a PDF file of an unedited manuscript that has been accepted for publication. As a service to our customers we are providing this early version of the manuscript. The manuscript will undergo copyediting, typesetting, and review of the resulting proof before it is published in its final citable form. Please note that during the production process errors may be discovered which could affect the content, and all legal disclaimers that apply to the journal pertain.
References
- 1.Yach D. Food industry: friend or foe? Obes Rev. 2014;15(1):2–5. doi: 10.1111/obr.12125. [DOI] [PubMed] [Google Scholar]
- 2.Wansink B, Peters J. The food industry role in obesity prevention. In: Kumanyika S, Brownson RC, editors. Handbook of obesity prevention. Berlin: Springer; 2007. [Google Scholar]
- 3.Nestle M. What to eat. New York: North Point Press; 2007. [Google Scholar]
- 4.Monteiro C. The big issue is ultra-processing. J World Public Health Nutr Assoc. 2010;1(6) [Google Scholar]
- 5.Monteiro CA, Gomes FS, Cannon G. The snack attack. Am J Public Health. 2010;100(6):975–81. doi: 10.2105/AJPH.2009.187666. [DOI] [PMC free article] [PubMed] [Google Scholar]
- 6.Monteiro CA, Levy RB, Claro RM, et al. Increasing consumption of ultra-processed foods and likely impact on human health: evidence from Brazil. Public Health Nutr. 2011;14(1):5–13. doi: 10.1017/S1368980010003241. [DOI] [PubMed] [Google Scholar]
- 7.Slining MM, Ng SW, Popkin B. An approach for evaluating food companies’ calorie-reduction pledge to improve the U.S. diet. Am J Prev Med. 2013;44(2):174–84. doi: 10.1016/j.amepre.2012.09.064. [DOI] [PMC free article] [PubMed] [Google Scholar]
- 8.U.K. Department of Health. Guide to creating a front of pack (FoP) nutrition label for pre-packed products sold through retail outlets. London: U.K Department of Health; 2013. [Google Scholar]
- 9.Hawley KL, Roberto CA, Bragg MA, et al. The science on front-of-package food labels. Public Health Nutr. 2013;16(03):430–9. doi: 10.1017/S1368980012000754. [DOI] [PMC free article] [PubMed] [Google Scholar]
- 10.Wartella EA, Lichtenstein AH, Boon CS, editors. Examination of front-of-package nutrition rating systems and symbols: phase 1 report. Washington DC: National Academy Press; 2010. [PubMed] [Google Scholar]
- 11.IOM Committee. Examination of front-of-package nutrition rating systems and symbols: phase I report. Washington DC: IOM; 2010. [PubMed] [Google Scholar]
- 12.Roodenburg A, Popkin B, Seidell J. Development of international criteria for a front of package nutrient profiling system: International Choices Programme. Eur J Clin Nutr. 2011;65(11):1190–200. doi: 10.1038/ejcn.2011.101. [DOI] [PMC free article] [PubMed] [Google Scholar]
- 13.William J. Clinton Foundation. Alliance for a Healthier Generation—Clinton Foundation and American Heart Association—and Industry Leaders Set Healthy School Beverage Guidelines for U.S. Schools. clintonfoundation.org/050306-nr-cf-hs-hk-usa-pr-healthy-school-beverage-guidelines-set-for-united-states-schools.htm.
- 14.American Beverage Association. Alliance school beverage guidelines final progress report. Washington DC: American Beverage Association; 2010. [Google Scholar]
- 15.Children’s Food and Beverage Advertising Initiative. bbb.org/us/childrens-food-and-beverage-advertising-initiative/
- 16.Children’s Food and Beverage Advertising Initiative. CFBAI’s category-specific uniform nutrition criteria. Arlington VA: Better Business Bureau; 2013. bbb.org/us/storage/16/documents/cfbai/CFBAI%20Uniform%20Nutrition%20Criteria%20Fact%20Sheet%20-FINAL.pdf. [Google Scholar]
- 17.Austin JE. Strategic collaboration between nonprofits and business. Nonprofit and Voluntary Sector Q. 2000;29(1S):S69–S97. [Google Scholar]
- 18.Buse K, Harmer AM. Seven habits of highly effective global public-private health partnerships: practice and potential. Soc Sci Med. 2007;64(2):259–71. doi: 10.1016/j.socscimed.2006.09.001. [DOI] [PubMed] [Google Scholar]
- 19.Kraak VI, Harrigan PB, Lawrence M, et al. Balancing the benefits and risks of public–private partnerships to address the global double burden of malnutrition. Public Health Nutr. 2011;15(3):503–17. doi: 10.1017/S1368980011002060. [DOI] [PubMed] [Google Scholar]
- 20.Kraak VI, Story M. A public health perspective on healthy lifestyles and public–private partnerships for global childhood obesity prevention. JADA. 2010;110(2):192–200. doi: 10.1016/j.jada.2009.10.036. [DOI] [PubMed] [Google Scholar]
- 21.Kraak VI, Story M, Wartella EA, et al. Industry progress to market a healthful diet to American children and adolescents. Am J Prev Med. 2011;41(3):322–33. doi: 10.1016/j.amepre.2011.05.029. [DOI] [PubMed] [Google Scholar]
- 22.Sharma LL, Teret SP, Brownell KD. The food industry and self-regulation: standards to promote success and to avoid public health failures. Am J Public Health. 2010;100(2):240–6. doi: 10.2105/AJPH.2009.160960. [DOI] [PMC free article] [PubMed] [Google Scholar]
- 23.Brownell KD, Warner KE. The perils of ignoring history: Big Tobacco played dirty and millions died. How similar is Big Food? Milbank Q. 2009;87(1):259–94. doi: 10.1111/j.1468-0009.2009.00555.x. [DOI] [PMC free article] [PubMed] [Google Scholar]
- 24.Koplan JP, Liverman CT, Kraak VI. Preventing childhood obesity: health in the balance: executive summary. JADA. 2005;105(1):131–8. doi: 10.1016/j.jada.2004.11.023. [DOI] [PubMed] [Google Scholar]
- 25.Brownell KD, Koplan JP. Front-of-package nutrition labeling—an abuse of trust by the food industry? N Eng J Med. 2011;364(25):2373–5. doi: 10.1056/NEJMp1101033. [DOI] [PubMed] [Google Scholar]
- 26.Koplan JP, Brownell KD. Response of the food and beverage industry to the obesity threat. JAMA. 2010;304(13):1487–8. doi: 10.1001/jama.2010.1436. [DOI] [PubMed] [Google Scholar]
- 27.Ludwig DS, Nestle M. Can the food industry play a constructive role in the obesity epidemic? JAMA. 2008;300(15):1808–11. doi: 10.1001/jama.300.15.1808. [DOI] [PubMed] [Google Scholar]
- 28.Ludwig DS. Technology, diet, and the burden of chronic disease. JAMA. 2011;305(13):1352–3. doi: 10.1001/jama.2011.380. [DOI] [PubMed] [Google Scholar]
- 29.Healthy Weight Commitment Foundation. Food and Beverage Manufacturers Pledging to Reduce Annual Calories By 1.5 Trillion By 2015. healthyweightcommit.org/news/Reduce_Annual_Calories/
- 30.Wang YC, Gortmaker SL, Sobol AM, et al. Estimating the energy gap among U.S. children: a counterfactual approach. Pediatrics. 2006;118(6):e1721–33. doi: 10.1542/peds.2006-0682. [DOI] [PubMed] [Google Scholar]
- 31.Ng SW, Popkin BM. The Healthy Weight Commitment Foundation Marketplace Pledge: calories purchased by U.S. households with children, 2000–2012. Chapel Hill NC: University of North Carolina; 2014. [DOI] [PMC free article] [PubMed] [Google Scholar]
- 32.Ng SW, Popkin BM. Monitoring foods and nutrients sold and consumed in the U.S. : dynamics and challenges. J Acad Nutr Diet. 2012;112(1):41–5. e4. doi: 10.1016/j.jada.2011.09.015. [DOI] [PMC free article] [PubMed] [Google Scholar]
- 33.Zhen C, Taylor JL, Muth MK, et al. Understanding differences in self-reported expenditures between household scanner data and diary survey data: a comparison of Homescan and Consumer Expenditure Survey. Rev Agr Econ. 2009;31(3):470–92. [Google Scholar]
- 34.Einav L, Leibtag E, Nevo A. On the accuracy of Nielsen Homescan data. Washington DC: U.S. Department of Agriculture; 2008. [Google Scholar]
- 35.Einav L, Leibtag E, Nevo A. Recording discrepancies in Nielsen Homescan data: are they present and do they matter? Quantitative Marketing Econ. 2010;8(2):207–39. [Google Scholar]
- 36.National Archives and Records Administration. 21 CFR 101.9. Washington DC: National Archives and Records Administration; 1993. [Google Scholar]
- 37.Slining M, Yoon EF, Davis J, Hollingsworth B, Miles D, Ng SW. Complexities of monitoring food and nutrition from factory to fork: the University of North Carolina at Chapel Hill Crosswalk Approach. Chapel Hill NC: University of North Carolina; 2013. [Google Scholar]
- 38.Slining MM, Mathias KC, Popkin BM. Trends in food and beverage sources among U.S. children and adolescents: 1989–2010. J Acad Nutr Diet. 2013;113(12):1683–94. doi: 10.1016/j.jand.2013.06.001. [DOI] [PMC free article] [PubMed] [Google Scholar]
- 39.CDC. State-specific trends in fruit and vegetable consumption among adults—U.S 2000–2009. MMWR Morb Mortal Wkly Rep. 2010;59(35):1125–30. [PubMed] [Google Scholar]
- 40.CDC. State-indicator report on fruits and vegetables 2013. Atlanta GA: National Center for Chronic Disease Prevention and Health Promotion; 2013. [Google Scholar]
- 41.Economic Research Service. Food Expenditures Table 4—Alcoholic beverages: Total. expenditures.ers.usda.gov/datafiles/Food_Expenditures/Food_Expenditures/table4.xls.
- 42.Kleiman S, Ng SW, Popkin B. Drinking to our health: can beverage companies cut calories while maintaining profits? Obes Rev. 2011;13(3):258–74. doi: 10.1111/j.1467-789X.2011.00949.x. [DOI] [PMC free article] [PubMed] [Google Scholar]
- 43.Ng SW, Slining MM, Popkin BM. Turning point for U.S. diets? Recessionary effects or behavioral shifts in foods purchased and consumed. Am J Clin Nutr. 2014;99(3):609–16. doi: 10.3945/ajcn.113.072892. [DOI] [PMC free article] [PubMed] [Google Scholar]
- 44.Hall KD, Guo J, Dore M, et al. The progressive increase of food waste in America and its environmental impact. PLoS One. 2009;4(11):e7940. doi: 10.1371/journal.pone.0007940. [DOI] [PMC free article] [PubMed] [Google Scholar]
- 45.Parfitt J, Barthel M, Macnaughton S. Food waste within food supply chains: quantification and potential for change to 2050. Philos Trans R Soc Lond B Biol Sci. 2010;365(1554):3065–81. doi: 10.1098/rstb.2010.0126. [DOI] [PMC free article] [PubMed] [Google Scholar]
- 46.Slining MM, Popkin BM. Trends in intakes and sources of solid fats and added sugars among U.S. children and adolescents: 1994–2010. Pediatr Obes. 2013;8(4):307–24. doi: 10.1111/j.2047-6310.2013.00156.x. [DOI] [PMC free article] [PubMed] [Google Scholar]
- 47.Reedy J, Krebs-Smith SM. Dietary sources of energy, solid fats, and added sugars among children and adolescents in the U. S J Am Diet Assoc. 2010;110(10):1477–84. doi: 10.1016/j.jada.2010.07.010. [DOI] [PMC free article] [PubMed] [Google Scholar]
- 48.Ebbeling CB, Swain JF, Feldman HA, et al. Effects of dietary composition on energy expenditure during weight-loss maintenance. JAMA. 2012;307(24):2627–34. doi: 10.1001/jama.2012.6607. [DOI] [PMC free article] [PubMed] [Google Scholar]
- 49.Prentice A. Are all calories equal? In: Cottrell R, editor. Weight control. Dordrecht: Springer Netherlands; 1995. [Google Scholar]
- 50.Mourao DM, Bressan J, Campbell WW, et al. Effects of food form on appetite and energy intake in lean and obese young adults. Int J Obes (Lond) 2007;31(11):1688–95. doi: 10.1038/sj.ijo.0803667. [DOI] [PubMed] [Google Scholar]
- 51.Lennerz BS, Alsop DC, Holsen LM, et al. Effects of dietary glycemic index on brain regions related to reward and craving in men. Am J Clin Nutr. 2013;98(3):641–7. doi: 10.3945/ajcn.113.064113. [DOI] [PMC free article] [PubMed] [Google Scholar]
- 52.Bank of America/Merrill Lynch. Globesity—the global fight against obesity. Charlotte NC: Bank of America/Merrill Lynch; 2012. [Google Scholar]
- 53.Obesity Solutions Initiative. Better-for-you foods: it’s just good business. Washington DC: Hudson Institute; 2011. www.hudson.org/files/documents/BFY%20Foods%20Executive%20Summary.pdf. [Google Scholar]
- 54.Cardello H, Wolfson J. Lower-calorie foods and beverages drive Healthy Weight Commitment Foundation Companies’ sales growth. 2013 www.healthyweightcommit.org/images/uploads/LowerCalHealthyWeightCommitment--May2013.pdf.
Associated Data
This section collects any data citations, data availability statements, or supplementary materials included in this article.