Abstract
Although the reversible wettability transition between hydrophobic and hydrophilic graphene under ultraviolet (UV) irradiation has been observed, the mechanism for this phenomenon remains unclear. In this work, experimental and theoretical investigations demonstrate that the H2O molecules are split into hydrogen and hydroxyl radicals, which are then captured by the graphene surface through chemical binding in an ambient environment under UV irradiation. The dissociative adsorption of H2O molecules induces the wettability transition in graphene from hydrophobic to hydrophilic. Our discovery may hold promise for the potential application of graphene in water splitting.
Graphene, which is a two-dimensional sheet of sp2-hybridised carbon atoms, is considered to be the next-generation electronic material due to its unique characteristics, such as high conductivity1, optical transparency2,3, and ultrahigh mechanical strength4. Graphene has been investigated for applications in smaller and faster electronic devices, more efficient batteries, and stronger materials, among others. In addition, the exceptional surface properties of graphene hold promise for applications in biomaterials, medical instruments, microfluidic devices, sensors and energy devices5,6. For example, a large hydrophilic electrode surface allows reactants to maximise the reaction surface area in aqueous systems for better electrocatalysis. The surface properties are governed by both chemical composition and geometrical structure, which can also significantly affect the performance of nanomaterials7. Both experimental observations8 and theoretical studies9 have revealed that graphene is a strongly hydrophobic material, which limits its applications in contact deposition in solution and may contaminate the nanoelectromechanical systems10. In addition, materials with controllable wetting properties are widely used in advanced multifunctional systems, such as biomaterials and microfluidic devices10,11. In particular, the wettability of graphene is essential for its utilisation in hybrid organic systems12.
Recent studies have suggested that there is a transition between the hydrophobic and hydrophilic states of graphene. Using density functional theory (DFT) calculations, Jiang et al.13 demonstrated that graphene can undergo a reversible transition in the presence of an external electric field. The energy barrier for the dissociative adsorption of H2O on graphene is then reduced, thereby inducing the wettability transition in graphene from hydrophobic to hydrophilic. In addition, remarkable surface wettability and a reversible transition from hydrophobic to hydrophilic graphene have been achieved using a periodic alternation of ultraviolet (UV) irradiation and air storage14. Graphene became hydrophilic after exposure to UV irradiation for 12 hours. When the graphene sample was annealed at 50°C in air, the graphene returned to the hydrophobic state. These results suggested that the hydrophilicity may be induced by the dissociative adsorption of oxygen gas from the atmosphere during UV irradiation14. However, there is no clear evidence to support this hypothesis. On the other hand, DFT calculations showed that the dissociative adsorption of H2O molecules from air can also induce the hydrophobic to hydrophilic transition in graphene. In addition, UV irradiation can also act as a controllable, effective and reversible method, which eliminates the chemical doping drawbacks from the corresponding lithographic process and provides an advanced strategy for tuning the electric properties of graphene15. Similar to plasma treatment, UV irradiation can usually induce defects in graphene16. This elimination of drawbacks from chemically doping graphene and induced defects in graphene may also affect the wettability of graphene. Therefore, the mechanism for the hydrophobic to hydrophilic transition in graphene under UV irradiation is still unclear.
In this work, we present a systematic study of the mechanism for the reversible hydrophobic to hydrophilic transition in graphene via periodic alternation of UV irradiation and vacuum storage. UV irradiation was performed for different durations to investigate the radiation effects. The change in the wettability of the graphene surface was determined by optical contact angle measurements, and Raman spectroscopy was used to determine the type of adsorbent and the change in concentration of the adsorbate after different irradiation durations. Furthermore, the dissociative adsorptions of H2O and O2 molecules on graphene were studied using DFT calculations. Different concentrations of adsorbates corresponding to different irradiation times were considered in the calculations. The calculated Raman spectra were compared with the experimental results. Based on these systematic studies, we present a mechanism for the wettability transition in graphene between hydrophobic and hydrophilic states under UV irradiation. These results may be important for the application of graphene in water splitting.
Results
The reversible wettability transition in graphene under UV irradiation and air storage
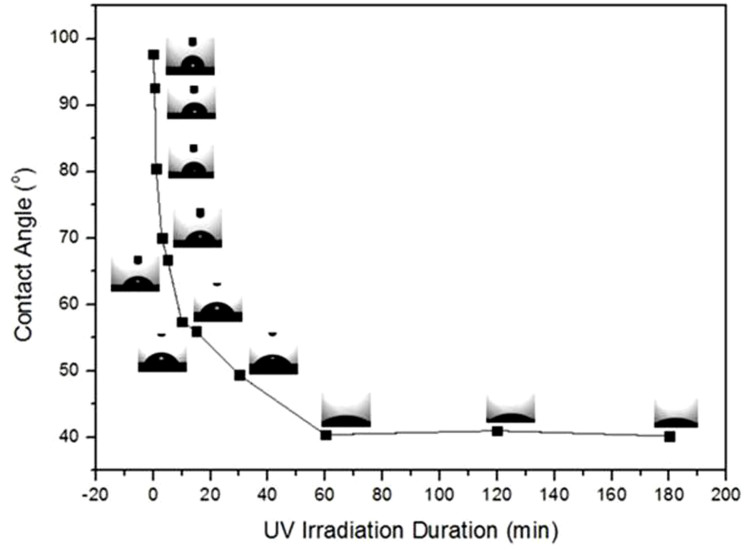
It is known that pristine graphene is hydrophobic and that it can be reversibly changed to the hydrophilic state using periodic UV irradiation and air storage14. Using similar methodology, the hydrophilic transition in graphene was achieved through UV irradiation in this work. Figure 1 shows the irradiation duration-dependent contact angle (CA) of water on graphene in ambient environment, which was measured with an optical contact angle meter. Each data point is an average result measured from three freshly cleaned UV-treated graphene samples. As shown in this figure, the CA gradually decreases from 97.7 to 39.2° for graphene exposed to UV irradiation from 0 to 180 min. There are three stages for the observed CA transition: (1) the CA decreases sharply from 97.7 to 47.9° with irradiation up to 15 min; (2) the CA clearly decreases from 47.9 to 41.2° under irradiation from 15 and 60 min; and (3) beyond 60 min, the difference is within the measurement error. Therefore, the hydrophobic state can be changed to the hydrophilic state under UV irradiation within an hour.
Figure 1. The contact angles of graphene with different durations of UV irradiation inambient environment.
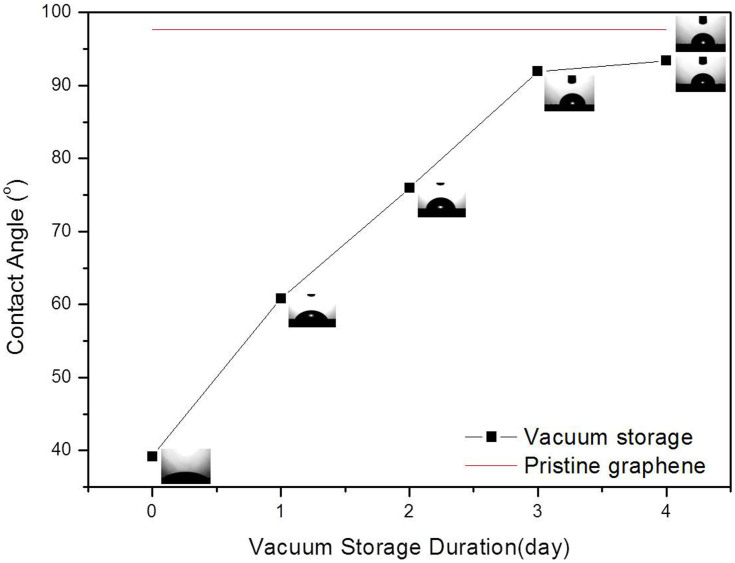
Then, the graphene samples irradiated for 60 min were stored under vacuum, and the CAs of graphene stored for different durations were investigated, as shown in Figure 2. As shown, the CA gradually increases from 39.2 to 93.4° with 4 days of storage, which is very similar to the CA of the un-irradiated graphene of 97.7°. The CA of the irradiated graphene could be restored to the initial level of 97.7° if prolonged air storage time was used. Consequently, the hydrophilic graphene can transition back to hydrophobic graphene by removing the UV radiation source and storage in vacuum. The reversible wettability transition in graphene can be experimentally controlled with periodic UV irradiation and vacuum storage, similar to a previous report14.
Figure 2. The contact angles of graphene irradiated for 1 hour with different storage times in vacuum.
Note that the un-irradiated graphene is measured after drying at 120°C for 2 hours.
The wettability transition in graphene with UV irradiation under different conditions
These experimental results raise questions as to why the reversible wettability transition in graphene can be achieved with UV irradiation and vacuum storage. Comparing the data in Figures 1 and 2, it can be clearly observed that the transition from hydrophobic to hydrophilic states under UV irradiation (1 hour) is considerably faster than that of the reverse transition induced by vacuum storage (4 days). This result suggests that the transition is caused by chemical adsorption on graphene rather than physical adsorption when irradiation, as the physically adsorbed molecules can be easily desorbed within a much shorter time. In addition, the UV irradiation should not have an evident effect on the physical adsorption, i.e., the time required for the transition from the hydrophobic to hydrophilic state under irradiation should be similar to that for the reverse transition in vacuum storage. Similar phenomena were also reported by other research groups in graphene14 and carbon nanotube (CNT) systems16. Although there was a lack of evidence, the authors claimed that the phenomenon was related to the chemisorption of O2 molecules induced by UV irradiation, thus resulting in hydrophilic groups on the surface and leading to the physical adsorption of water molecules at these groups. Once the UV source was removed and the graphene films were exposed to air, O2 molecules would gradually replace the physically adsorbed water molecules and adsorb on the surface, causing the hydrophobicity of the surface to be restored14. However, DFT calculations revealed that the chemical adsorption of water molecules in air would also induce the wettability transition in graphene13.
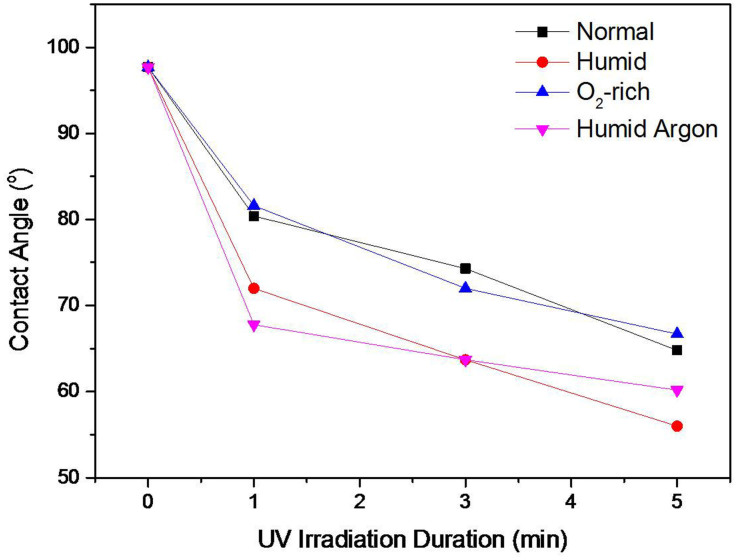
To determine whether the wettability transition in graphene is associated with H2O or O2 dissociative adsorption under UV irradiation, the CAs of UV-irradiated graphene samples were measured in high humidity and O2-rich environments, respectively. To increase the humidity of the air, 2 cups containing 150 ml of hot water (95°C) were placed in the UV chamber. An O2-rich environment can be achieved by purging oxygen gas into the UV chamber with a continuous flow. Figure 3 shows the change in the CAs of the graphene samples irradiated by UV for 5 min in the ambient, humid and oxygen-rich environments. This figure clearly demonstrates that the reduction in the CA of graphene in the humid environment is much more pronounced than that of the samples in the ambient environment. However, the samples in the oxygen-rich environment showed similar CA reduction behaviour to those in the ambient environment. In addition, in order to exclude the effect of ozone formed from O2 during irradiation, the graphene samples were irradiated in an Ar atmosphere with high humidity. The CA results are also shown in Figure 3, where similar reduction behaviour to that in humid air atmosphere was observed. Therefore, the effect of ozone on the wettability change of the graphene samples could be ignored. These results indicate that the concentration of H2O in the environment does have a significant effect on the wettability of UV-irradiated graphene, whereas the concentration of O2 does not.
Figure 3. The contact angles of UV-treated graphene under different conditions.
DFT calculations of H2O and O2 dissociative adsorption on grapheme
Previous studies have suggested that the typical thermodynamically stable graphene defects are mono-vacancies, multi-vacancies and pentagon-heptagon pairs17. Additionally, edges and grain boundaries (lines of pentagon-heptagon pairs) also exist in graphene18. Therefore, our DFT studies considered both pristine graphene and graphene with defects, e.g., mono and divacancy defects, grain boundaries (modelled as periodical pentagon-heptagon pairs in a row), and edges. All the structures contain a 18 Å vacuum layer to minimise the non-physical interlayer interactions19. As discussed in our previous work20, it is known that the effect of the graphene supercell size on the chemical reaction barrier is not evident. Therefore, 3 × 3 supercells were used for the investigation.
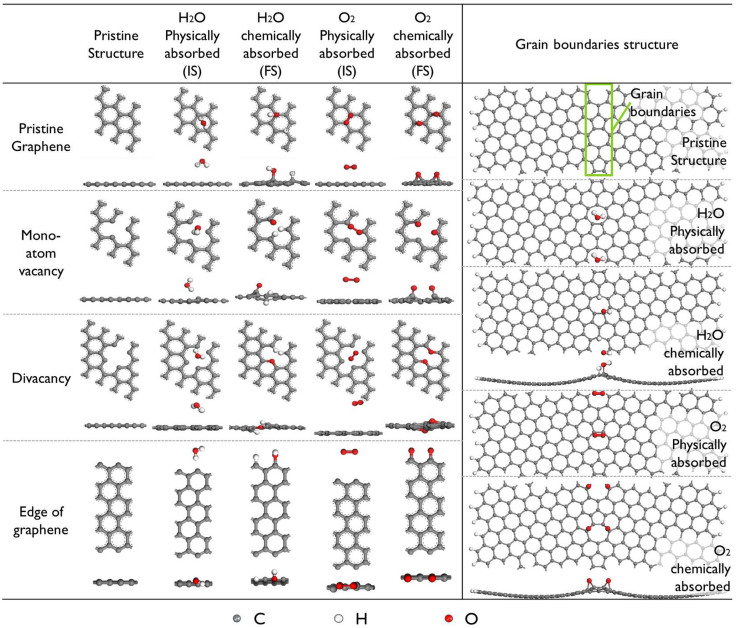
For pristine graphene with a physically adsorbed H2O or O2 molecule, it is found that the H2O molecule tends to occupy the site above the center of a C ring, whereas the O2 molecule occupies the top sites of C atoms. As shown in Figure 4, the relaxed H2O molecule prefers to adsorb atop the hollow site of a C ring with two O–H bonds pointing down, whereas the O2 molecule is located at the bridge site of graphene with an O = O bond parallel to the graphene surface. These two configurations are taken as the reactants for the chemical reactions of H2O and O2 dissociative adsorption on graphene, respectively. After their dissociation and adsorption, the H+ and OH− bind with two face-by-face C atoms, whereas the O atoms relax to the bridge sites of C–C bonds, with each O atom binding with two C atoms. All possible adsorption positions for H2O or O2 were also considered for graphene containing defects. The most stable structures obtained after structure relaxation are shown in Figure 4. It is found that the adsorption position and orientation change when the defects are present. The obtained structures agree well with those in previous studies13,21,22,23. For example, for the case of a mono-atom vacancy, the physisorbed H2O molecule was atop of the hollow site of the vacancy, while the chemisorbed H2O molecule would be separated into two H atoms and one O atom attached to the three C atoms at the vacancy, which is consistent with a previously reported result21.
Figure 4. Atomic structures of a H2O or an O2 molecule adsorbed on graphene with different types of defects.
The reaction barrier is an important factor for determining the possibility of a chemical reaction. To determine the possibilities for the dissociative adsorption of H2O and O2 molecules on pristine graphene and on graphene with different types of defects, the dissociative adsorptions of H2O and O2 on pristine graphene and on graphene with a mono-atom vacancy defect, a divacancy defect, grain boundaries and edges were calculated. To investigate the energy minimum reaction pathway for the dissociative adsorption of H2O and O2 molecules on graphene, the linear synchronous transit/quadratic synchronous transit (LST/QST)24 and nudged elastic band (NEB)25 tools in the Dmol3 module in Materials Studio software package were used. These methodologies have been well verified to be capable of determining the structure of the transition state and the minimum energy pathway for small molecules dissociation and adsorption on graphene20.
To determine the effects of van der Waals interactions and the different functional groups in the calculations, the dissociative adsorption of a H2O molecule on pristine graphene was calculated using DFT-D corrected Generalised Gradient Approximation/Perdew-Wang 91 (GGA/PW91) (van der Waals interactions are considered with DFT-D correction), normal GGA/PW91 and Local-Density Approximation/Plane Wave Approach (LDA/PWA) functionals, and the results are presented in Figure s1 (Supplementary). The difference in the energy barrier between the results of the normal GGA/PW91 and the DFT-D corrected GGA/PW91 is very slight. Therefore, although van der Waals interactions for water physically adsorbed on graphene are required to be considered in the calculations for the physical adsorption of water, their effects on the LST/QST and NEB calculations are not significant. For the calculation using the LDA/PWA functional, the energy barrier is slightly lower than that using the GGA/PW91 functional, which would not exert a significant influence on the energy barrier calculation. On the other hand, the GGA functional has been extensively used to determine reaction energy barriers13,26,27,28. In addition, we are interested in the reaction energy barrier for the dissociative adsorption of H2O on graphene relative to that of O2 in this work; thus, the results would be not affected when using the same functional in the calculations. Therefore, the GGA/PW91 functional was used in this work.
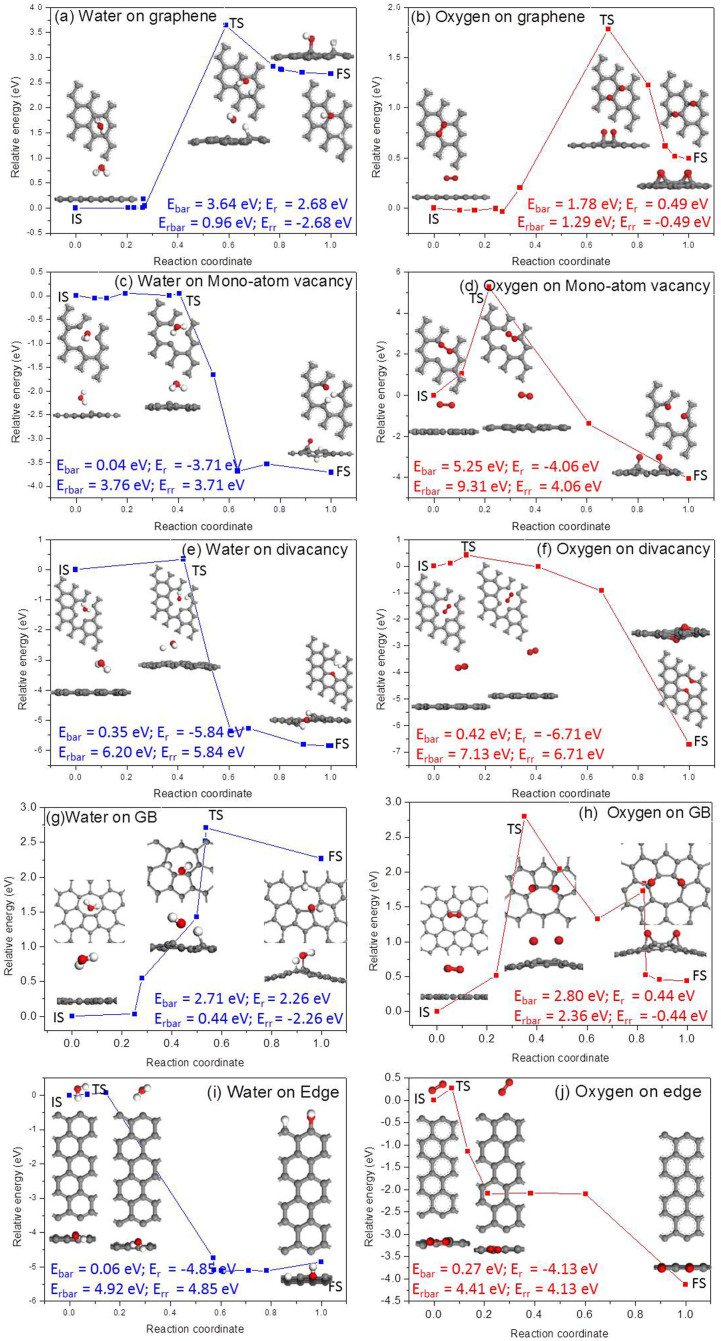
Utilising LST/QST and NBE calculations, the reaction pathways for the dissociative adsorption of a H2O and an O2 molecule on pristine graphene were calculated, and the results are shown in Figures 5(a) and 5(b), respectively. In these figures, the corresponding initial structure (IS), transition structure (TS), final structure (FS), dissociative adsorption reaction barrier (Ebar = ETS − EIS) and dissociative adsorption reaction energy (Er = EFS − EIS) are also presented. In a similar manner, the reverse reaction energy barrier (Erbar = ETS − EFS) and reverse reaction energy (Err = EIS − EFS) can also be calculated. As shown in Figure 5(a), the Ebar for the dissociative adsorption of a H2O molecule is 3.64 eV and the Er is 2.68 eV. For the reverse reaction, Erbar = 0.96 eV and Err = −2.68 eV. In general, only a chemical reaction with an energy barrier of less than 0.75 eV typically occurs under ambient conditions29. The dissociative adsorption of H2O molecules is an endothermic reaction with a high energy barrier, indicating that this reaction is very difficult under ambient conditions.
Figure 5. The reaction pathways for the dissociative adsorption of a H2O and an O2 molecule on graphene.
Pristine graphene (a) and (b); graphene with mono-atom vacancy (c) and (d); divacancy (e) and (f); edge (g) and (h); grain boundary (i) and (j).
However, the reverse reaction may occur under such conditions because of the relatively low energy barrier Erbar and because it is an exothermic reaction. A similar situation can also be found in the case of the dissociative adsorption of O2 on graphene, as shown in Figure 5(b), where Ebar = 1.78 eV, Er = 0.49 eV, Erbar = 1.29 eV, and Err = −0.49 eV. Comparing the Ebar and Er in these two reactions, as shown in Figures 5 (a) and (b), the dissociative adsorption of O2 is easier than that of H2O. Figures 5(c) to (j) show the corresponding reaction pathways for graphene with typical defects, such as mono-vacancies [Figures 5(c) and 5(d)], divacancies [Figures 5(e) and 5(f)], grain boundaries [Figures 5(g) and 5(h)] and edges [Figures 5(i) and 5(j)]. These results demonstrate that the Ebar for the dissociative adsorption of a H2O molecule on graphene with any type of defect is lower than that of an O2 molecule. Similar results can be found for the reverse reactions, in which the Erbar for the case of H2O is lower than that of O2 if any type of defect is present in graphene. Hence, in the case of graphene with defects, H2O is easier to be dissociatively adsorbed, as well as desorbed than O2. In addition, Erbar is normally higher than Ebar, except for the case of grain boundaries, which means that the reverse wettability transition in graphene from hydrophilic to hydrophobic would require a longer time.
Experimental and calculated Raman spectra
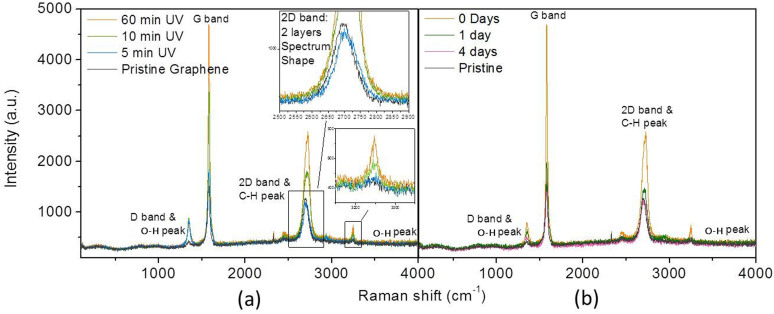
Raman spectroscopy is a powerful tool for studying graphene-based materials30. The Raman spectra of graphene-based materials include three characteristic peaks: D, G and 2D bands31. The D band located at ~1350 cm−1 only appears in the spectra of samples that contain sp2 carbon with defects, such as edges of graphene32. The G band is usually located at ~1580 cm−1. The shift of the G band is useful for investigating doping and structural defects. The 2D band located at ~2700 cm−1 is the most prominent feature in the Raman spectrum of graphene, and its shape is sensitive to the number of layers; thus, the layers of graphene can be distinguished through the Raman peak at ~2700 cm−1 32.
Figure 6(a) shows the Raman spectra for graphene with 0, 5, 30, and 60 min of UV irradiation, whereas Figure 6(b) presents the Raman spectra of UV-treated graphene after vacuum storage for different numbers of days. In Figure 6(a), four representative modes in the range from ~350 to 4000 cm−1 are observed and identified as the D (~1350 cm−1)33, G (~1580 cm−1)34, and 2D (~2720 cm−1) bands, and the peak at ~3250 cm−1 is attributed to an O–H bond35,36. The peak at ~3250 cm−1 is ocassionally considered to be the D+D′ peak37, which is induced by the nature of defect-containing graphene. However, the peak ~3250 cm−1 in Figure 6(a) is not obvious for pristine graphene, and its intensity increases significantly after irradiation. Thus, this peak should be associated with new vibrations resulting from the adsorbates under UV irradiation. Compared with previously reported results32, the shape of the 2D peak of pristine graphene perfectly matches with the spectrum of 2-layer graphene rather than that of 5-layer graphene. Therefore, it can be recognised that the graphene used in this work is a few-layer graphene and that the number of layers is less than 5. In addition, as shown in Figure 6(a), the intensities of the Raman D, G, and 2D bands of graphene and the characteristic intensity of the peak at ~3250 cm−1 significantly increase with the duration of UV irradiation. After storage of the UV-treated graphene film under vacuum for 4 days, the four peaks decreased and returned almost to the original state of graphene before UV radiation, as shown in Figure 6 (b).
Figure 6. Experimental Raman spectrum of graphene.
(a) With various UV treatment durations, and (b) various days of vacuum storage.
To determine the vibrations that contribute to the peaks, the Raman spectra of graphene with both H2O and O2 dissociatively adsorbed were also calculated by DFT. The final structures (FS) of water and oxygen dissociatively adsorbed on pristine graphene, illustrated in Figure 4, were taken for the Raman spectra calculation. To understand the effects of van der Waals interactions on the calculated Raman spectra, the Raman spectra of pristine graphene with an adsorbed H2O molecule were calculated using the GGA/PW91 and DFT-D corrected GGA/PW91 (considering van der Waals interactions) functionals, and the results are shown in Figure 2s (Supplementary). It is observed that the two Raman spectra are identical, indicating that van der Waals interactions do not affect the Raman spectra. From the calculated Raman spectra, the vibration details of each main peak can be visualised, and they can provide additional evidence for analysing the experimental results.
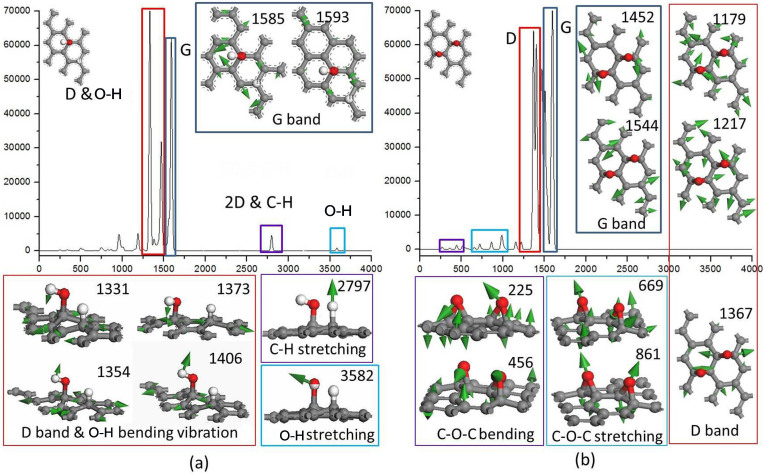
Figure 7(a) shows the Raman spectrum of a 3 × 3 graphene with a dissociatively adsorbed H2O molecule. As shown, new peaks appear compared with that of pristine graphene in Figure 3s (Supplementary). As indicated in the bottom of Figure 7(a), the vibrations of hydroxyl (bands from 1249 to 1406 cm−1) and C–C bonds (bands from 1331 to 1406 cm−1) are assigned as the D band. The peaks at ~2797 and ~3583 cm−1 correspond to the stretching of C–H and O–H bonds, respectively. The calculated Raman spectrum of graphene with a dissociatively adsorbed O2 molecule is shown in Figure 7(b). In addition to the G band at ~1507 cm−1 and the D band at ~1367 cm−1, the main peaks from 225 to 456 cm−1 correspond to the bending vibration of epoxy and C–C bonds, as indicated in the bottom of Figure 7(b). The stretching vibrations of epoxy groups and C–C bonds near the O atoms contribute to the peaks from 669 cm−1 to 861 cm−1. The experimental and calculated Raman spectra will be compared in the discussion section.
Figure 7. Calculated Raman spectra of graphene.
(a) With water, and (b) with oxygen dissociatively adsorbed.
Discussion
As shown in Figure 5, although the splitting and adsorption of water on pristine graphene is more difficult compared to that of oxygen, water is easier to be dissociatively adsorbed on graphene containing typical defects. Moreover, it is believed that UV radiation, similar to plasma treatment, usually induces defects in graphene16, which would facilitate the dissociative adsorption of H2O and induce the wettability transition in graphene from hydrophobic to hydrophilic. This also agrees with our experimental results. Furthermore, it is found that graphene can be gradually restored to the hydrophobic state with vacuum storage for 4 days, which can be considered as the reverse reaction calculated in Figure 5. In the reverse reactions, as mentioned above, H+ and OH− are much easier to desorb from graphene with a lower Erbar compared with the case of O2 on graphene with and without defects. Therefore, we believe that the reversible wettability transition in graphene observed in the experiment is induced by the dissociative adsorption of H2O rather than O2.
As shown in Figure 6(a), the intensities of the four Raman peaks increased after irradiation, which indicates that new vibration modes were induced by UV irradiation, especially around 1350 and 3250 cm−1, where the peaks for graphene without irradiation are not evident. It is known that the peaks at ~1500 cm−1 can be referred to the G band, which is a typical vibration mode of graphite-like materials and caused by optical E2g phonons at the Brillion zone centre. With UV irradiation, as shown by the calculated Raman spectra in Figure 7, the dissociative adsorption of both water and oxygen could increase the intensity of the G band at ~1500 cm−1 compared with the G band of graphene without any adsorption, as shown in Figure 3s (Supplementary). Therefore, the increase in the G band intensity in Figure 6(a) is believed to be a result of new vibrations induced by the adsorbates.
It is known that critical factors, such as dopants, doping concentration, number of graphene layers, and defects, can induce shifts in the Raman peaks31. In the DFT calculation above, the pristine graphene was modeled as an ideal single layer of graphene without any defects, which is unobtainable in experiments. Therefore, it is understandable that there would be a slight difference in Raman spectra from the experiments and DFT calculations, as shown in Figure 6 and Figure 7. Comparing the experimental Raman spectrum in Figure 6(a) with the calculated Raman spectrum of graphene with dissociatively adsorbed H2O in Figure 7(a), the locations of the four main peaks (D, G, 2D and O–H bands) agree with each other within reasonable difference. Therefore, it is concluded that (1) the bending vibration of the hydroxyl group contributes to the band at ~1350 cm−1, (2) the stretching vibration of C–H contributes to the band at ~2720 cm−1, and (3) the stretching vibration of the hydroxyl group contributes to the band at ~3250 cm−1. In addition, the stretching vibration of the hydroxyl group is from 3100 to 3650 cm−1 38, and the peaks at ~3250 cm−1 shown in Figure 6(a) can be attributed to the O–H stretching vibration. When comparing Figure 6(a) with the calculated Raman spectrum of graphene with dissociatively adsorbed O2 in Figure 7(b), there is no peak between 225 and 861 cm−1 in the experimental Raman spectrum in Figure 6(a). These bands in Figure 7(b) correspond to the bending vibrations of epoxy and C–C bonds and the stretching vibrations of epoxy and C–C bonds near the O atoms. In addition, the dissociative adsorption of O2 molecules cannot induce the intensity increase for peaks around 2720 cm−1 and 3250 cm−1 observed in Figure 6(a).
Therefore, based on the evidence from the measurement of the wettability transition in graphene with UV irradiation under different conditions, from the energy barrier calculation of H2O and O2 molecules dissociatively adsorbed on graphene, and from the comparison of the experimental and calculated Raman spectra, it can be concluded that the H2O rather than the O2 is dissociatively adsorbed on graphene under UV irradiation in air, thus inducing the wettability transition in graphene from the hydrophobic to hydrophilic state due to the presence of the hydrophilic hydroxyl group. In contrast, during vacuum storage, the H+ and OH− desorb from graphene and gradually combine to form H2O molecules. This process is consistent with the decrease in the intensity of the peaks in the Raman spectra in Figure 6(b).
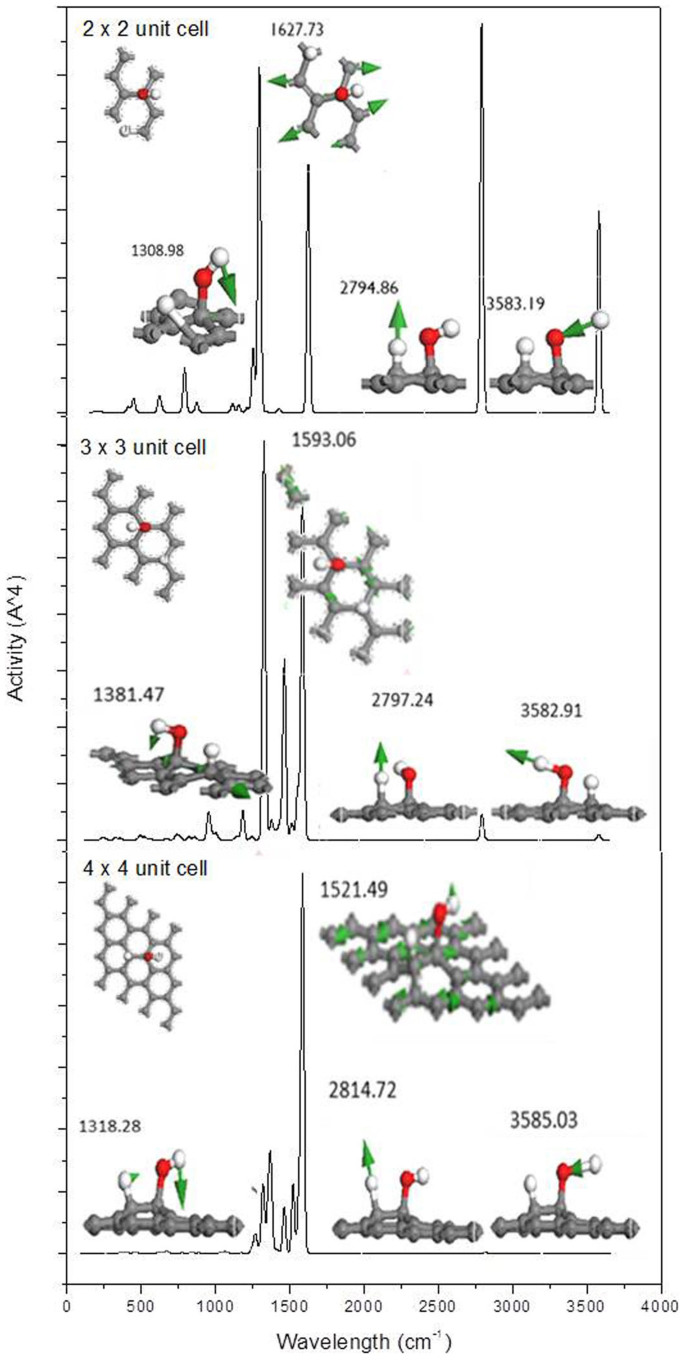
As shown in Figure 6(a), the intensities of all peaks increase with the duration of UV irradiation, and the contact angle also gradually decreases with the duration of UV irradiation, as shown in Figure 1. It is hypothesised that this phenomenon is associated with more H2O molecules being dissociatively adsorbed on graphene, i.e., the concentration of adsorbate is continuously increasing during the irradiation until it reaches saturation after 1 h. In addition, as shown in Figure 6(b), the intensities of the characteristic Raman peaks decrease with time of vacuum storage. This behaviour is associated with desorption of H+ and OH− from graphene. The desorption process increases the CA of water on graphene, thus returning graphene to the hydrophobic state. This result is consistent with the data shown in Figure 2. To better understand the effect of the adsorbate concentration, different sized calculation supercells with an adsorbed H2O molecule, as shown in the inset of Figure 8, are proposed to investigate the effect of the adsorbate concentration on the Raman spectra.
Figure 8. Calculated Raman spectra of graphene in different sized supercells with a H2O molecule dissociatively adsorbed.
Figure 8 shows the corresponding calculated Raman spectra of a H2O molecule dissociatively adsorbed on graphene with different sizes. Note that the peaks in the Raman spectra are normalised to show the relative intensity of each peak in the different sized systems. When the supercell size decreases, i.e., the concentration of H2O increases, the intensities of the peaks at ~2795 and 3580 cm−1, which are induced by the stretching of C–H and O–H bonds, respectively, increases. This result agrees with the experimental result in Figure 6(a), in which the intensity of the main peaks increases. For the peak at ~1310 cm−1, which is mainly induced by the bending of the O–H bond as shown in the right side of each panel, the weight of the band near this frequency increases as the H2O concentration increases. However, the G band appears to decrease when the concentration of H2O on graphene increases, which is in contrast to the experimental results presented in Figure 6(a). As mentioned above, the peaks in the Raman spectra are normalised in Figure 8. It is known that the G band is mainly attributed to the vibration of the sp2 C–C bond, which is not considerably influenced by the increase in the absorbate concentration. However, the intensities of the peaks related to the vibrations of O–H and C–H bonds increase remarkably. The intensity of the G band relatively decreases after normalisation. Note that the positions of the D band, O–H vibration, G band, 2D band and C–H vibration shift when the concentration of H2O increases, as shown in Figure 8. It is understandable that this shift is induced by the intermolecular interaction of H+ and OH− groups on graphene, especially when the concentration is high. Therefore, H2O molecules are dissociatively adsorbed on graphene gradually with UV radiation until saturation is reached. Moreover, according to the literature, defects plays an important role in the hydrophilicity of graphene39. To understand the effects of the defect concentration on the graphene wettability transition, the energy barrier for the dissociative adsorption of one water molecule on graphene with various defect concentrations was calculated, as shown in Figure 4s (supplementary). In this calculation, the defect concentration was manipulated by changing the size of the supercells that contain a mono-atom vacancy. The results indicate that the energy barrier decreases as the concentration of defects increases, indicating that the water molecules would be easier to be dissociatively adsorbed on graphene with higher defect concentrations.
In addition, the conductivity of graphene is expected to change under UV irradiation due to the chemical bonding between H2O and the graphene surface. To understand this change, the band structures of pristine graphene and of graphene with a dissociatively adsorbed H2O molecule with different sized supercells are shown in Figure 5s (Supplementary). The results indicate that the band gap of graphene is open after the dissociative adsorption of H2O and that the gap increases as the size of the supercell decreases. Thus, it is expected that the conductivity of the graphene sample would be reduced with irradiation until H2O on graphene is saturated. The detailed results will be shown in our next work.
In conclusion, the transitions of graphene sheets under UV irradiation have been investigated experimentally and by DFT calculations. It is found that UV irradiation can act as a switch to enable the transition of graphene films from hydrophobic to hydrophilic via the dissociative adsorption of H2O on the graphene surface. In addition, the transition is reversible and controllable. With UV treatment for 60 min, the graphene can become hydrophilic and return to hydrophobic with storage in vacuum for 4 days. This work elucidates the transition mechanism for graphene, which is induced by the chemically dissociative adsorption of H2O molecules in air rather than O2 molecules. These results may provide new insights into the fundamental principles of water splitting with graphene-based materials.
Methods
Experimental details
Graphene films were purchased from the Graphene Supermarket [https://graphene-supermarket.com/], and they were grown on polycrystalline nickel substrates (10 mm × 10 mm, 1 mm thick) using the chemical vapour deposition (CVD) method. The nickel substrates were deposited by ebeam and recrystallised as they were heated to 1000°C during CVD growth. To investigate the effects of the UV irradiation duration, the graphene samples on Ni substrate were dried for 2 hours at 100 °C and were placed in the 3 L UV chamber (Table top UV/Ozone surface processor, SSP16-110), then were exposed to UV light with a 254 nm wavelength at room temperature for 30 s and 1, 3, 5, 10, 15, 30, 60, 120, and 180 min. Note that it has been reported that the UV irradiation wavelength has little effect on the wetting properties of materials40. To achieve an O2-rich environment, high purity (99.9%) oxygen gas was purged into the UV chamber with at a continuous flow 1 L/min for 10 minutes prior UV irradiation. To investigate the effects of humidity, 2 cups containing 150 mL of distilled water at 95°C were placed in the UV chamber, and a 5 min standing time was applied before irradiation to equilibrate the humidity in the chamber. To avoid the influence of ozone during irradiation, this irradiation process was repeated under Ar atmosphere, where high purity (99.9%) Ar flow rate was maintained at 1 L/min for 3 hours prior UV irradiation. To investigate the change in hydrophilicity without UV irradiation and to avoid contamination during storage, the graphene samples treated for 60 min were stored in the vacuum chamber of the UV/Ozone surface processor at room temperature (approximately 25°C) for 1, 2, 3 and 4 days because we found that after 60 min of UV irradiation, the hydrophilicity level of graphene films remains stable.
The wettability of graphene was tested immediately after irradiation using an optical contact angle meter (Rame–Hart 100-00 goniometry) at room temperature using the sessile drop technique. For each UV-treated condition, the contact angles of three different graphene samples were measured. To characterise the chemical structure change of graphene, Raman spectra were investigated immediately after irradiation or after vacuum storage using Renishaw inVia Raman Microscope with an excitation laser with a 514.5 nm wavelength and scanned in the range of 100–4000 cm−1 with a 50 × 50 μm objective.
Computational Methodology
All geometry optimisation calculations were performed using spin-polarised DFT implemented in the CASTEP module of the Materials Studio package41,42,43, which is based on the plane-wave pseudopotential method. The generalised gradient approximation (GGA) functions with the PW91 correction was employed as the exchange-correlation functional. For the Raman spectra calculations, the calculation qualities were set to be ultra-fine without spin polarisation. The Broyden–Fletcher–Goldfarb–Shanno (BFGS) method was set as the algorithm with the use offline search to solve unconstrained nonlinear optimisation problems. Norm-conserving pseudopotentials were used in the electronic options. The cut-off energy was 750 eV, and the maximal allowed displacement was 0.01 eV/Å.
The LST/QST and NEB calculations were performed using the Dmol3 module of the Materials Studio package with fine calculation quality, and the GGA with PW91 functional was employed to describe the exchange and correlation effects44. Double numerical plus polarisation (DNP) was used as the basis set. To understand the effect of van der Waals force, the DFT-D method within the Grimme scheme is used to consider the van der Waals forces45. The convergence tolerance of energy of 10−5 Hartree was taken (1 Hartree = 27.21 eV), and the maximal allowed force and displacement were 0.002 Hartree/Å and 0.005 Å, respectively.
Author Contributions
Z.X. carried out the experiments and simulations, analysed the experimental data and wrote the paper; Z.A. conceived, designed and guided the research and co-wrote the paper; D.C. guided the experiments; A.Y. did the experiment of graphene under Ar protection; C.L. and S.L. supervised and directed the project. All authors discussed the results and commented on the manuscript.
Supplementary Material
Supplementary Information
Acknowledgments
Financial support from the Chancellor's Postdoctoral Research Fellowship Program from the University of Technology, Sydney, and from ALNGRA13071 from ANSTO is acknowledged. Xin Cheng, Cheng Jiang and Fei Han are acknowledged for their assistance in the optical contact angle measurements. This research was supported by the National Computational Infrastructure (NCI) through the merit allocation scheme and used NCI resources and facilities in Canberra, Australia.
References
- Zhu Y. F., Dai Q. Q., Zhao M. & Jiang Q. Physicochemical insight into gap openings in graphene. Sci. Rep. 3, 1524; 10.1038/srep01524 (2013). [DOI] [PMC free article] [PubMed] [Google Scholar]
- Weber C. M. et al. Graphene-Based Optically Transparent Electrodes for Spectroelectrochemistry in the UV–Vis Region. Small 6, 184–189 (2009). [DOI] [PubMed] [Google Scholar]
- Yang N., Zhai J., Wang D., Chen Y. & Jiang L. Two-Dimensional Graphene Bridges Enhanced Photoinduced Charge Transport in Dye-Sensitized Solar Cells. ACS Nano 4, 887–894 (2010). [DOI] [PubMed] [Google Scholar]
- Lee C., Wei X., Kysar J. W. & Hone J. Measurement of the Elastic Properties and Intrinsic Strength of Monolayer Graphene. Science 321, 385–388 (2008). [DOI] [PubMed] [Google Scholar]
- Abdelsayed V. et al. Photothermal deoxygenation of graphite oxide with laser excitation in solution and graphene-aided increase in water temperature. J. Phys. Chem. Lett. 1, 2804–2809 (2010). [Google Scholar]
- Zhang K., Dwivedi V., Chi C. & Wu J. Graphene oxide/ferric hydroxide composites for efficient arsenate removal from drinking water. J. Hazard. Mater. 182, 162–168 (2010). [DOI] [PubMed] [Google Scholar]
- Feng X. et al. Reversible Super-hydrophobicity to Super-hydrophilicity Transition of Aligned ZnO Nanorod Films. J. Am. Chem. Soc. 126, 62–63 (2003). [DOI] [PubMed] [Google Scholar]
- Wang S., Zhang Y., Abidi N. & Cabrales L. Wettability and Surface Free Energy of Graphene Films. Langmuir 25, 11078–11081 (2009). [DOI] [PubMed] [Google Scholar]
- Leenaerts O., Partoens B. & Peeters F. M. Water on graphene: Hydrophobicity and dipole moment using density functional theory. Phys. Rev. B 79, 235440 (2009). [Google Scholar]
- Rafiee J., Rafiee M. A., Yu Z.-Z. & Koratkar N. Superhydrophobic to Superhydrophilic Wetting Control in Graphene Films. Adv. Mater. 22, 2151–2154 (2010). [DOI] [PubMed] [Google Scholar]
- Chen H., Müller M. B., Gilmore K. J., Wallace G. G. & Li D. Mechanically strong, electrically conductive, and biocompatible graphene paper. Adv. Mater. 20, 3557–3561 (2008). [Google Scholar]
- Bon S. B., Piccinini M., Mariani A., Kenny J. M. & Valentini L. Wettability and switching of electrical conductivity in UV irradiated graphene oxide films. Diam. Relat. Mat. 20, 871–874 (2011). [Google Scholar]
- Jiang Q. G., Ao Z. M., Chu D. W. & Jiang Q. Reversible Transition of Graphene from Hydrophobic to Hydrophilic in the Presence of an Electric Field. J. Phys. Chem. C 116, 19321–19326 (2012). [Google Scholar]
- Zhang X., Wan S., Pu J., Wang L. & Liu X. Highly hydrophobic and adhesive performance of graphene films. J. Mater. Chem. 21, 12251–12258 (2011). [Google Scholar]
- Luo Z., Pinto N. J., Davila Y. & Charlie Johnson A. T. Controlled doping of graphene using ultraviolet irradiation. Appl. Phys. Lett. 100, 253108 (2012). [Google Scholar]
- Yang J., Zhang Z., Men X., Xu X. & Zhu X. Reversible superhydrophobicity to superhydrophilicity switching of a carbon nanotube film via alternation of UV irradiation and dark storage. Langmuir 26, 10198–10202 (2010). [DOI] [PubMed] [Google Scholar]
- Hashimoto A., Suenaga K., Gloter A., Urita K. & Iijima S. Direct evidence for atomic defects in graphene layers. Nature 430, 870–873 (2004). [DOI] [PubMed] [Google Scholar]
- Cockayne E. et al. Grain boundary loops in graphene. Phys. Rev. B 83, 195425 (2011). [Google Scholar]
- Ao Z. M. & Peeters F. M. High-capacity hydrogen storage in Al-adsorbed graphene. Phys. Rev. B 81, 205406 (2010). [Google Scholar]
- Ao Z. & Peeters F. M. Electric field activated hydrogen dissociative adsorption to nitrogen-doped graphene. J. Phys. Chem. C 114, 14503–14509 (2010). [Google Scholar]
- Cabrera-Sanfelix P. & Darling G. R. Dissociative adsorption of water at vacancy defects in graphite. J. Phys. Chem. C 111, 18258–18263 (2007). [Google Scholar]
- Boukhvalov D. & Katsnelson M. Chemical functionalization of graphene with defects. Nano Lett. 8, 4373–4379 (2008). [DOI] [PubMed] [Google Scholar]
- Zhang H., Lee G., Gong C., Colombo L. & Cho K. Grain Boundary Effect on Electrical Transport Properties of Graphene. J. Phys. Chem. C 188, 2338–2343 (2014). [Google Scholar]
- Halgren T. & Lipscomb W. LST method as implemented in the SPARTAN program. See also Chem. Phys. Lett 49, 225–232 (1977). [Google Scholar]
- Henkelman G. & Jónsson H. Improved tangent estimate in the nudged elastic band method for finding minimum energy paths and saddle points. J. Chem. Phys. 113, 9978 (2000). [Google Scholar]
- Jiang Q., Ao Z., Zheng W., Li S. & Jiang Q. Enhanced hydrogen sensing properties of graphene by introducing a mono-atom-vacancy. Phys. Chem. Chem. Phys. 15, 21016–21022 (2013). [DOI] [PubMed] [Google Scholar]
- Jiang D.-E., Cooper V. R. & Dai S. Porous graphene as the ultimate membrane for gas separation. Nano Lett. 9, 4019–4024 (2009). [DOI] [PubMed] [Google Scholar]
- Helveg S. et al. Atomic-scale imaging of carbon nanofibre growth. Nature 427, 426–429 (2004). [DOI] [PubMed] [Google Scholar]
- Shang C. & Liu Z.-P. Origin and activity of gold nanoparticles as aerobic oxidation catalysts in aqueous solution. J. Am. Chem. Soc. 133, 9938–9947 (2011). [DOI] [PubMed] [Google Scholar]
- Wenzel R. N. Resistance of solid surfaces to wetting by water. Ind. & Eng. Chem. 28, 988–994 (1936). [Google Scholar]
- Wei D. et al. Synthesis of N-doped graphene by chemical vapor deposition and its electrical properties. Nano Lett. 9, 1752–1758 (2009). [DOI] [PubMed] [Google Scholar]
- Ferrari A. C. et al. Raman Spectrum of Graphene and Graphene Layers. Phys. Rev. Lett. 97, 187401 (2006). [DOI] [PubMed] [Google Scholar]
- Elias D. et al. Control of graphene's properties by reversible hydrogenation: evidence for graphane. Science 323, 610–613 (2009). [DOI] [PubMed] [Google Scholar]
- Solin S. & Ramdas A. Raman spectrum of diamond. Phys. Rev. B 1, 1687 (1970). [Google Scholar]
- Kim U. J., Furtado C. A., Liu X., Chen G. & Eklund P. C. Raman and IR spectroscopy of chemically processed single-walled carbon nanotubes. J. Am. Chem. Soc. 127, 15437–15445 (2005). [DOI] [PubMed] [Google Scholar]
- Liu B., Sun H., Peng T. & Ji G. Molecular vibrational spectroscopy characterization of epoxy graphene oxide from density functional calculations. J. Mol. Model 19, 1429–1434 (2013). [DOI] [PubMed] [Google Scholar]
- Eckmann A. et al. Probing the nature of defects in graphene by Raman spectroscopy. Nano Lett. 12, 3925–3930 (2012). [DOI] [PubMed] [Google Scholar]
- Lewis I. R. & Edwards H. Handbook of Raman spectroscopy: from the research laboratory to the process line. (CRC Press., 2001). [Google Scholar]
- Zhou H. et al. Understanding controls on interfacial wetting at epitaxial graphene: Experiment and theory. Phys. Rev. B 85, 035406 (2012). [Google Scholar]
- Holl S., Colinge C., Hobart K. & Kub F. UV activation treatment for hydrophobic wafer bonding. J. Elec. Soc. 153, G613–G616 (2006). [Google Scholar]
- He Y. L., Liu D. X., Qu Y. & Yao Z. Adsorption of Hydrogen Molecule on the Intrinsic and Al-Doped Graphene: A First Principle Study. Adv. Mater. Res. 507, 61–64 (2012). [Google Scholar]
- Clark S. J. et al. First principles methods using CASTEP. Z. Kristallog. 220, 567–570 (2005). [Google Scholar]
- Segall M. et al. First-principles simulation: ideas, illustrations and the CASTEP code. J. Phys.: Cond. Matter 14, 2717 (2002). [Google Scholar]
- Perdew J. P., Burke K. & Ernzerhof M. Generalized gradient approximation made simple. Phys. Rev. Lett. 77, 3865–3868 (1996). [DOI] [PubMed] [Google Scholar]
- Grimme S. Semiempirical GGA-type density functional constructed with a long-range dispersion correction. J. Comput. Chem. 27, 1787–99 (2006). [DOI] [PubMed] [Google Scholar]
Associated Data
This section collects any data citations, data availability statements, or supplementary materials included in this article.
Supplementary Materials
Supplementary Information


