Abstract
Proteins containing nucleotide binding sites (NBS) encoded by plant resistance genes play an important role in the response of plants to a wide array of pathogens. In this paper, an in silico search was conducted in order to identify and characterize members of NBS-encoding gene family in the tribe of Triticeae. A final dataset of 199 sequences was obtained by four search methods. Motif analysis confirmed the general structural organization of the NBS domain in cereals, characterized by the presence of the six commonly conserved motifs: P-loop, RNBS-A, Kinase-2, Kinase-3a, RNBS-C and GLPL. We revealed the existence of 11 distinct distribution patterns of these motifs along the NBS domain. Four additional conserved motifs were shown to be significantly present in all 199 sequences. Phylogenetic analyses, based on genetic distance and parsimony, revealed a significant overlap between Triticeae sequences and Coiled coil-Nucleotide binding site-Leucine rich repeat (CNL)-type functional genes from monocotyledons. Furthermore, several Triticeae sequences belonged to clades containing functional homologs from non Triticeae species, which has allowed for these sequences to be functionally assigned. The findings reported, in this study, will provide a strong groundwork for the isolation of candidate R-genes in Triticeae crops and the understanding of their evolution.
Keywords: NBS domain, data mining, phylogeny, plant resistance genes, Triticeae
Introduction
Triticeae are among the most important crops in the world. According to the NCBI Taxonomy database, the tribe of Triticeae belongs to the Poaceae family of grasses and to the subfamily Pooideae that includes, in addition to Triticeae, two major tribes: Poeae and Avenae. The Triticeae tribe includes several economically important species such as common wheat (Triticum aestivum L.), durum wheat (T. turgidum L. ssp. durum), barley (Hordeum vulgare L.) and rye (Secale cereale L.), in addition to about 350 other species (Löve, 1984). Within this tribe, there is a significant diversity in terms of morphology, life cycle, behaviour, reproduction, karyotype, habitat and phenotypic plasticity. Because of the tribe’s global distribution, the taxonomic status of some species is sometimes controversial. The susceptibility of Triticeae crops to multiple pathogens strongly affects their productivity and quality improvement.
To struggle against attacks of bacteria, fungi, viruses and nematodes, plants have evolved a wide range of defence mechanisms. While some of these resistance strategies rely on simple physical or chemical barriers, one major mechanism is characterized by a gene-for-gene interaction that requires a plant resistance gene (R-gene) that recognizes a protein expressed by a specific pathogen avirulence gene (Avr-gene). This type of specific resistance is often associated with a localized hypersensitive response in plant cells at the infection site. Sequence composition analysis of R-genes indicates that they share high similarity and contain seven different conserved domains, like NBS (nucleotide-binding site), LRR (leucine rich repeat), TIR (Toll/Interleukin-1 receptor), CC (coiled-coil), LZ (leucine zipper), TM (transmembrane) and STK (serine-threonine kinase). Based on domain organization, R-gene products can be categorized into at least five major classes (Sanseverino et al., 2010): CNL one (CC-NBS-LRR); TNL (TIR-NBS-LRR); RLP (Receptor-Like Proteins); RLK (Receptor-Like Kinases); and the KIN class grouping proteins containing only a kinase domain. In addition to these well-studied five R-classes, many other resistance proteins (class Others-R) have been discovered, which do not fall within the previous classes and whose functional mechanisms are also usually different (Romer et al., 2007). In this class falls, for example, the Hordeum vulgare MLO protein (Sanseverino and Ercolano, 2012) that confers resistance against the powdery mildew caused by Blumeria graminis (Buschges et al., 1997). The number of cloned and functionally-identified R-genes has been marked by a constant growth in recent years, reaching 112 genes according to Plant Resistance Gene database (PRGdb). As a consequence, the classification of R-genes has been continuously revised, based on the modular domains present in R-proteins. Recently, Sanseverino and Ercolano (2012) analysed R-domain associations; which allowed them to distinguish 22 subfamilies, including R-proteins that are composed of a single domain (e.g. NBS) and those that show from two to five domains associations (e.g. NBS-KIN; NBS-LRR-KIN; NBS-LRR-KIN-Other; TIR-NBS-LRR-KIN-Other).
The NBS-encoding R-genes, which encode proteins containing at least a nucleotide binding site (NBS) domain, represent the largest R-gene family among plant genomes (Marone et al., 2013). Based on domain associations as analysed in Sanseverino and Ercolano (2012), this family encompasses variable subfamily associations, such as NBS, NBS-LRR, TIR-NBS-LRR, NBS-LRR-Other, etc. The NBS domain is involved in signalling and includes several highly conserved and strictly ordered motifs such as P-loop, kinase-2 and GLPL motifs (Tan and Wu, 2012). So far, large numbers of NBS-encoding genes have been predicted in different species. These numbers are permanently increasing, as new genomic sequences are produced very rapidly and annotation/re-annotation efforts are continuously updated. In dicotyledons, 167 such sequences are predicted to be present in Arabidopsis thaliana (Yu et al., 2014), 333 in Medicago truncatula (Ameline-Torregrosa et al., 2008), 435 in Solanum tuberosum (Lozano et al., 2012), 459 in Vitis vinifera (Yang et al., 2008), 157 in Brassica oleracea (Yu et al., 2014), 206 in Brassica rapa (Yu et al., 2014) and 54 in Carica papaya (Porter et al., 2009). In monocotyledons, especially in cereals, 460 genes are recognized in Oryza sativa L. (Ling et al., 2013), 211 in Sorghum bicolor (Ling et al., 2013), 197 in Brachypodium distachyon (Ling et al., 2013), 106 in maize (Ling et al., 2013) and 191 in H. vulgare (International Barley Genome Sequencing Consortium, 2012). For common hexaploid wheat no precise report is available yet in the literature, given that the recently published genome (Brenchley et al., 2012) has not been annotated yet. Nonetheless, we have recently mined and predicted roughly 1700 potential NBS-encoding sequences in the wheat genome; among which at least a third are candidate NBS genes characterized by intact Open Reading Frames (ORFs) (D. Bouktila, Y. Khalfallah, Y. Habachi, M. Mezghani-Khémakhem, M. Makni and H. Makni, unpublished data). In cereals, where absence of the TIR domain has been proved (Marone et al., 2013), R-proteins may adopt various domain architectures, such as NBS, CC-NBS, NBS-LRR and CC-NBS-LRR. A systematic evaluation of NBS-encoding genes is required in order to better understand the host plants responses.
Today we are witnessing a spectacular increase in the number and content of databases that store, visualize, model, compare and make usable all types of biological information at different levels of organizations, depending on the nature of the data. The generation of data from biological samples (biological data mining) is defined as the computational process of discovering patterns and extracting biological knowledge from large amounts of data (Han and Kamber, 2006). The process could be automatic, or (more usually) semi-automatic, and the patterns discovered must be meaningful. Biological data can be generated at many different levels: genomic (DNA), transcriptomic (RNA), proteomic (proteins) or metabolomic (small compounds). In addition to the well-known databases of protein sequences (e.g. GenBank, RefSeq Proteins, SwissProt, PIR, etc.), transcripts resources, especially those containing Expressed Sequence Tags (ESTs) data, can be of great help when mining members of a protein family, including those evidenced from transcriptional data. The Expressed Sequence Tag (EST)-based Gene Indices (GIs) of Dana-Farber Cancer Institute (DFCI) (formerly TIGR) are generated after clustering, assembly and annotation of ESTs and cDNA genes from GenBank. The process of clustering is done when more than a single sequence, are representative of the same transcript. At this point, tentative clusters (TCs) are constructed, while clusters with a single transcript are called singletons. The generation of consensus sequences for each cluster greatly reduces the time required to discover genes.
Taking into account recent genomic and bioinformatic advances and the exponential growth of publicly available sequence data, we aimed in the present study to characterize the phylogenetic diversity and domain structure of NBS domain-encoding Resistance Gene Analogs (RGAs) in Triticeae. The first step towards this end was to explore multiple Triticeae genomic resources, in order to establish a comprehensive dataset of publicly available sequences for the NBS domain-containing RGAs. Using this dataset, we analysed conserved motifs in the NBS domains. We further studied the relationship between Triticeae NBS sequences, by performing a number of phylogenetic analyses.
Materials and Methods
Database mining
To obtain a comprehensive dataset of Triticeae NBS-encoding sequences for phylogenetic and domain analyses, sequence data were mined from protein annotations in GenBank and additional data gathered from EST databases. The DFCI gene indices (formerly TIGR gene indices) were used as source of EST data. For this study, analysis was restricted to the NBS domain since it shows the highest degree of motif conservation, which greatly facilitates database mining, and multiple sequence alignment.
Primary search using PSI-BLAST
After checking PRGdb, we selected the core NBS of the Lr21 protein conferring resistance of T. aestivum to leaf rust (Huang et al., 2009; PRGdb accession: PRGDB00061468; GenBank accession: ACO53397), in order to construct the initial Position Specific Scoring matrix (PSSM). The selected sequence comprises 176 amino acids, extending from the GSGKTTFA motif starting in position 349 aa, to the RSPIAA motif ending in position 524 aa. We opted for using only the region of the core NBS to search for similar sequences by PSI-BLAST, rather than employ the entire gene sequence, due to the substantial sequence variation outside of the core NBS (especially in the LRR domain), which would decrease effectiveness of research by causing spurious hits. PSI-BLAST searches were carried out in the non-redundant protein sequence database “nr” at NCBI GenBank (National Center for Biotechnology Information). The taxon parameter was modified to search within the Triticeae tribe (taxid:147389). The PSI-BLAST threshold parameter was established at 10−7; so as only hits with E-values below this cutoff will be considered as significant. The default matrix BLOSUM-62 was used, as it is efficient at detecting weaker protein similarities, as is the case when searching for distant NBS homologues (Du Preez, 2005). Searching was repeated until the result set converged for an E-value cutoff of 10−7. The resulting dataset was aligned using the MUSCLE program; and sequences not containing an intact core NBS (P-loop up to GLPL), or those lacking one or more of the 4 major conserved motifs within the core NBS (P-loop, Kinase-2, Kinase-3a and GLPLA) were removed from the dataset.
Building an HMM profile for Triticeae NBS domain
A Hidden Markov Model (HMM) contains statistical parameters in the form of two matrices, one describing the possible transitions between a different number of hidden states, and the other describing the probabilities for each hidden state. The HMMs used for describing sequence features are reduced to a subset, known as HMM profile (Eddy, 1998). With the recent emergence of large amounts of genomic and transcriptional data, HMMs are becoming a standard tool in detecting biologically relevant signals in sequence data, being superior to PSSMs for detecting distant homology (Delorenzi and Speed, 2002).
Sequences retained after the primary search using PSI-BLAST were realigned by MUSCLE and their alignment was used for the development of an original HMM profile specific to the Triticeae tribe, reflecting their typical core NBS. The HMM profile was performed using the “hmmbuild” application of the HMMER 3.0 software. The resulting HMM profile was given the name “triticeae_nbs.hmm”. The LogoMat-M software (Schuster-Böckler et al., 2004) was used for viewing the HMM profile developed in graphical form (logo).
Secondary searches using HMM profile
The HMM profile “triticeae_nbs.hmm” was used for a more refined search in the GenBank-nr database, of any remote NBS-type counterparts, which the PSI-BLAST could not detect by the PSSM approach. At this stage, we used the HMMER 3.0 web server to search in GenBank-nr without the need to download the database. The calibration of the research was carried out with an E-value cutoff equal to 10.
An additional HMM-based scan was performed through the barley and wheat translations of the DFCI Gene Indices database, in order to combine in an almost exhaustive manner, all NBS-type sequences belonging to the tribe of Triticeae. In our case, the targeted bases of interest were TAGI and HVGI, corresponding to T. aestivum and H. vulgare, respectively. The latest versions TAGI 12.0 and HVGI 12.0 were downloaded (Table 1). After downloading, each database was separately translated in six reading frames using the software package of the European Molecular Biology Open Software Suite (EMBOSS, version 6.5.0.0), which has a variety of applications for handling data and biological sequences. We used the algorithm EMBOSS:SEQRET for performing a six reading frames translation of each database, then the algorithm EMBOSS:TRANSEQ for format conversion from *.pep into *.embl. Finally, the algorithm hmmsearch of HMMER 3.0 package was used to perform two searches in the translated databases based on the already built HMM profile “triticeae_nbs.hmm”.
Table 1.
Features of DFCI gene indices of wheat (TAGI 12.0) and barley (HVGI 12.0).
| Version | Contents
|
|||
|---|---|---|---|---|
| Tentative Clusters (TCs) | Singletons | Total (TCs+Singletons) | ||
| TAGI | 12.0 (18 Avril, 2010) | 93,508 | 128,417 | 221,925 |
| HVGI | 12.0 (19 Mars, 2011) | 43,310 | 39,671 | 82,981 |
Data compilation and reduction
Four subsets were generated from different search techniques and databases. These subsets were PSI-BLAST/nr, HMM/nr, HMM/TAGI and HMM/HVGI. Initially, each dataset was analysed separately, based on the criterion of integrity of the core NBS. Subsequently all datasets were merged and a second analysis was performed on the compilation, based on the criterion of non similarity. In fact, redundant sequences can be found even in non-redundant databases and even if they are stored in different accession numbers. They often arise from gene duplication events, ESTs derived from the same gene, post-translational modifications, etc. (Cameron et al., 2007).
Identity between sequences was detected using the CD-HIT software of the CD-HIT Suite (Biological Sequence Clustering and Comparison), which includes different programs depending on the nature of sequences (protein or nucleic acid). The clustering parameter was calibrated to 95%, which retains only the longest sequence from a cluster of sequences characterized by a degree of similarity equal to or greater than 95% at the protein level.
HMM-based alignment
Multiple alignments of the members of a multigene family are often problematic, since these sequences are both strongly conserved in core motifs of the domain, while hypervariable in regions stretching between conserved motifs. For instance, in the case of the NBS-LRR gene family, a total rate of amino acid identity as low as 30% was reported (Meyers et al., 1999). This complicates accurate alignment of multiple sequences in regions stretching between conserved motifs, which in turn negatively impacts motif alignment. Sequence alignment was thus performed using the HMM profile we had already built for database mining, in order to improve the alignment of conserved motifs hidden in more variable regions. HMM-based alignments are also faster and more accurate than pair-wise methods (Du Preez, 2005).
Therefore, HMM-based alignment was performed using the hmmalign algorithm, from HMMER version 3.0 package. In order to anchor the subsequent phylogenetic analysis, we included in the alignment a set of 44 core NBS sequences belonging to reference R-proteins (both CNLs and TNLs). These reference proteins were extracted from the PRG database. Multiple sequence alignment was manually edited for removing large indel regions using the BioEdit version 7.0.5.3 sequence alignment editor (Hall, 1999), since indel regions can create large biases in phylogenetic results.
Motif extraction and analysis
Extraction of conserved motifs of a multigene family and visualization was performed by applying MEME (Multiple Expectation Maximization for Motif Elicitation) from MEME Suite software package version 4.9.0 (Motif-based sequence analysis tools, Bailey and Elkan, 1994). The MEME application is based on an expectation-maximization algorithm which, from a set of unaligned sequences, allows extraction of conserved motifs and their visualization. As with BLAST search results, MEME hits have E-values assigned, which provides an estimation of the expected number of random hits of similar significance (Meyers et al., 2003).
Assuming that the size of each eventual pattern ranges between 4 and 50 aa, a first search was set to detect a maximum of 6 motifs, while a second search was performed with the parameter “maximum number of patterns” = 10.
Phylogenetic inference
The immense size and diversity of the NBS-type gene family is a challenge to their evolutionary study that appears to be very complex. For this reason, different phylogenetic approaches should be used after a specific choice of software and settings. After undergoing manual editing with Bioedit version 7.0.5.3 (Hall, 1999), alignment of NBS sequences from Triticeae and those used for anchoring, was used to generate two trees.
The first tree was made based on a matrix of genetic distances, using the model of Dayhoff (Schwarz and Dayhoff, 1979). The variation rate across sites was adjusted by selecting the gamma distribution that aims to correct the variation of substitutions between different sites. Gamma value = 8 has been fixed, since the substitution pattern along positions in the NBS domain differs greatly. The tree was constructed from the distance matrix by the Neighbor-Joining method, with 1000 bootstrap replications and the generation of a consensus of 1000 trees provided. The second tree was obtained by the method of maximum parsimony, which allows reconstructing the phylogeny through a short path that minimizes the total number of evolutionary events involved in the phylogeny. For this we used 1000 bootstrap replications to generate a consensus tree. All phylogenetic analyses were performed using MEGA version 5.0 (Molecular Evolutionary Genetics Analysis, Tamura et al., 2011).
Results
Database mining
PSI-BLAST/nr subset
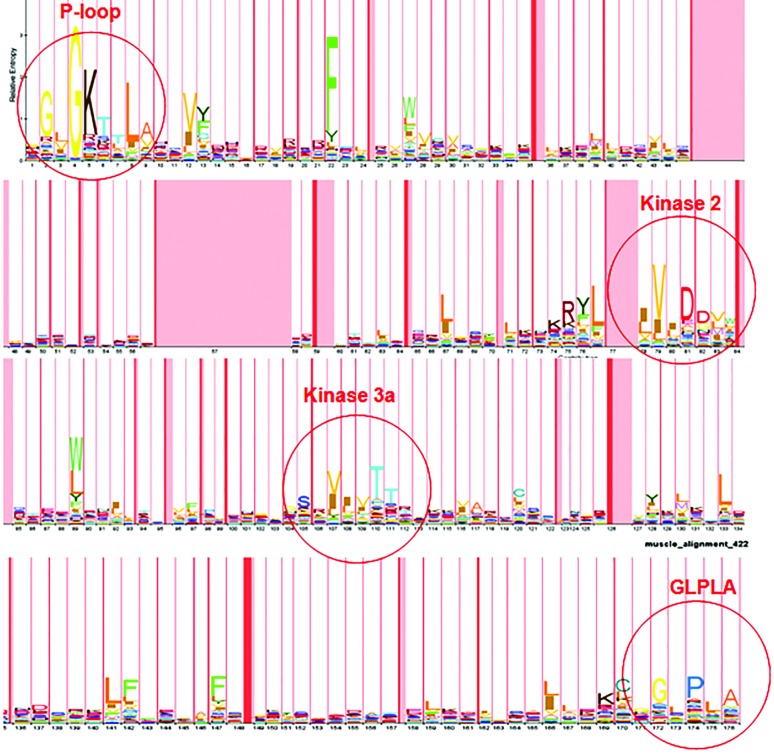
Having developed the parameters of the research reported in the Materials and Methods section, the iterative PSI-BLAST procedure was launched using the core NBS of T. aestivum Lr21 (ACO53397.1) (Huang et al., 2009), to conduct the initial search. This procedure spanned six iterations, after which the PSSM matrix had converged at 569 hits from all GenBank databases (All non-redundant GenBank CDS translations, RefSeq Proteins, PDB, SwissProt, PIR and PRF). Only 422 sequences with a complete organization of core NBS were retained. These sequences were aligned by MUSCLE. The alignment file was converted from its original msf format into Stockholm format to serve as input for hmmbuild application. A 176-consensus position HMM profile was trained and called “triticeae_nbs.hmm”. This HMM profile was viewed with the LogoMat-M program, as shown in Figure 1.
Figure 1.
Logo created with LogoMat-M program, illustrating the 176-positions HMM profile, obtained from the alignment of 422 intact-NBS sequences derived from PSIBLAST.
HMM/nr subset
This research was carried out directly on the web, from the HMMER web server. A set of 16,044 sequences without taxonomic restriction was obtained. Sorting these sequences using the taxonomic browser available in the server site, reduced results to 3,456 sequences, belonging to Poaceae family, among which 601 sequences belonging to the Triticeae tribe. It is obvious that a number of these 601 sequences was overlapping with the result of PSI-BLAST. Thus, we performed a manual comparison between the two subsets, which allowed us to keep only 42 sequences from the new subset, of which only 10 sequences were found to have a perfect organization for the four major core NBS motifs. Table 2 shows the output of each reduction step.
Table 2.
Search through the GenBank-nr protein database for Triticeae NBS sequences, using the HMMER web server based on “triticeae_nbs.hmm” profile.
| Steps | Description | Number of sequences |
|---|---|---|
| Initial number | Number of raw output sequences (Triticeae) | 601 |
| Discarded from dataset | Redundant with PSIBLAST-derived dataset | 559 |
| Not spanning P-loop -GLPLA | 27 | |
| Lacking one or more motifs (P-loop/Kinase2/Kinase3a/GLPLA) | 5 | |
| Too long or too short (do not align) | 0 | |
| Final number | - | 10 |
HMM/TAGI and HMM/HVGI subsets
The DFCI wheat gene indices (TAGI version 12.0) and those of barley (HVGI version 12.0) were downloaded and translated in six reading frames using the algorithm EMBOSS:TRANSEQ. The translations were then submitted to hmmsearch algorithm to perform a search based on the HMM profile we developed. 281 and 132 sequences were obtained from wheat and barley, respectively. These sequences were subjected to a filtration process (Table 3), leading to the retention of 34 sequences from each species, which met three criteria: non redundancy with the PSIBLAST/nr subset, non truncation (presence of the interval P-loop-GLPLA in whole), and non aberration (intact four major motifs of the NBS domain).
Table 3.
Search for NBS sequences through the translated DFCI gene indices of Triticum aestivum (TAGI release 12) and Hordeum vulgare (HVGI release 12), based on “triticeae_nbs.hmm” HMM profile.
| Steps | Description | Wheat sequences | Barley sequences |
|---|---|---|---|
| Initial number | Number of raw output sequences (Triticeae) | 281 | 132 |
| Discarded from dataset | Redundant with PSIBLAST-derived dataset | 18 | 28 |
| Under e-value threshold 10 | 97 | 27 | |
| Not spanning P-loop -GLPLA | 55 | 6 | |
| Lacking one or more motifs (P-loop/Kinase2/Kinase3a/GLPLA) | 77 | 37 | |
| Too long or too short (do not align) | 0 | 0 | |
| Final number | - | 34 | 34 |
Compilation of subsets and reduction into a final dataset
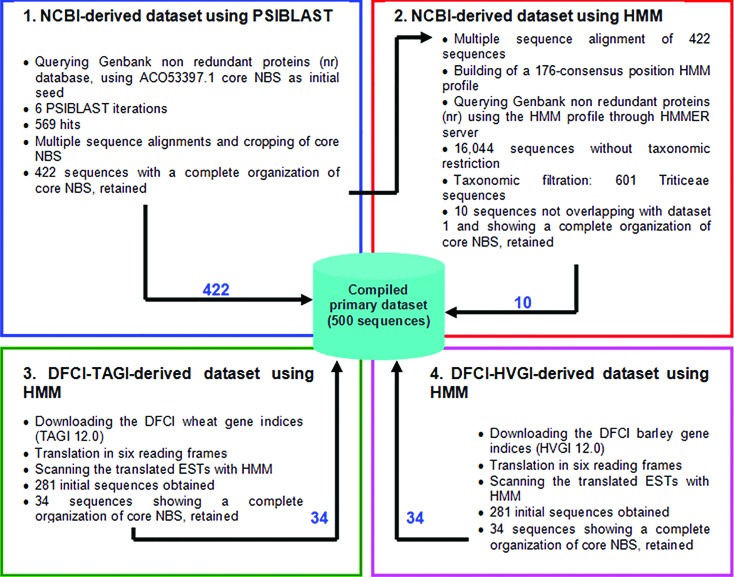
The final step in the construction of the dataset was the integration of all sequences trapped during different research stages. These sequences were 500 (Figure 2). The dataset was reduced by filtering-out all sequences showing more than 95% identity. In most cases, such sequences would correspond to closely related paralogous or allelic sequences (Rostoks et al., 2002; Madsen et al., 2003). An analysis of similarity was performed using the CD-HIT program, which resulted in a reduced dataset comprising 199 sequences, representative of the diversity of NBS domain in Triticeae.
Figure 2.
Data mining pipeline and integration of all non redundant sequences from different searches, into a primary compilation.
HMM-based alignment
A heterogeneous set of 243 sequences (199 core NBS from Triticeae, to which were added 44 core NBS from reference CNL and TNL R-proteins) was aligned using hmmalign HMM-based local alignment tool. All indels (insertions-deletions) and unreliably aligned regions in multiple sequence alignments were removed prior to application of distance and parsimony.
Phylogenetic analyses
General overview
In order to compare the non-redundant collection of 199 Triticeae NBS domains with reference TNLs (12) and CNLs (32), a phylogenetic analysis was performed by Neighbor-Joining (NJ) and Maximum Parsimony (MP). All branches generated by the two methods had a minimum statistical support of 50%.
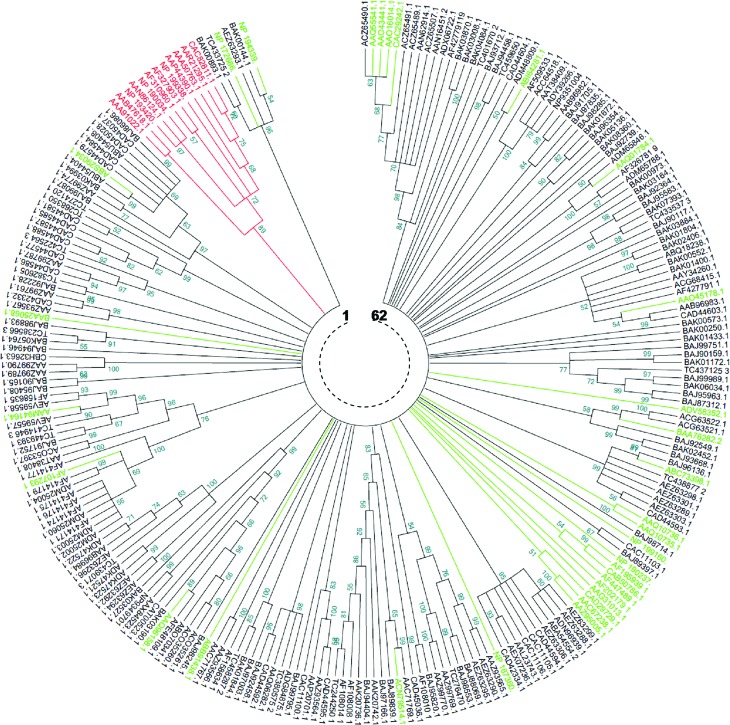
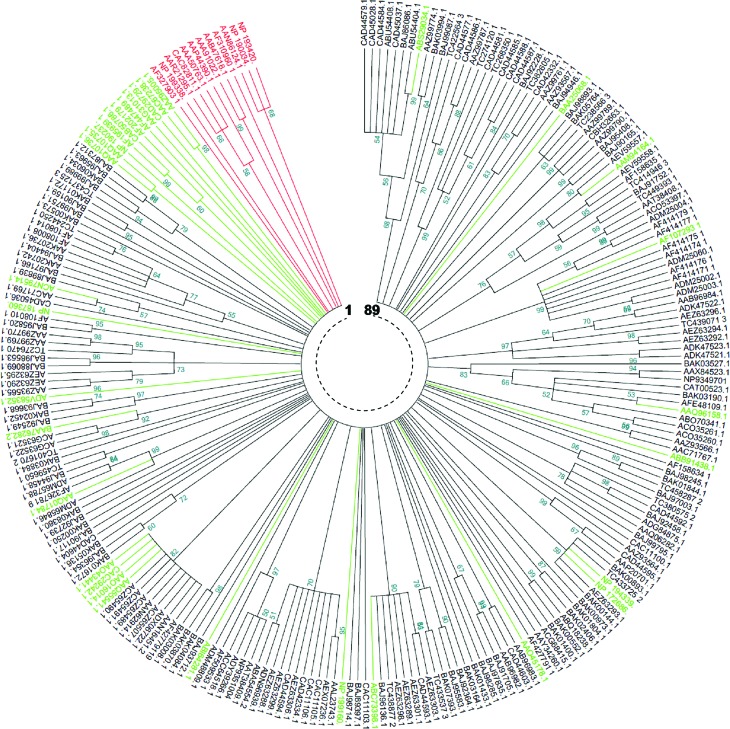
The tree generated by the NJ method (Figure 3) showed 62 clades. Twenty six clades, representing 41.93%, were monophyletic. For the remaining clades (58.07%), the number of members per clade varied between 2 and 20. The tree generated by the MP method (Figure 4) showed 89 clades, 46 (51.68%) of which were monophyletic, while the remaining (48.32%) had a number of members per clade varying between 2 and 11. In both NJ and MP phylogenies, reference TNLs were clearly distinguished from other core NBS CNLs. Moreover, the comparison of the two phylogenies revealed a perfect identity involving some clades / superclades that were supported by both methods (Table 4).
Figure 3.
Neighbor-Joining phylogenetic comparison of Triticeae and non Triticeae NBS-encoding genes and RGAs. The numbers on the branches indicate the percentage of 1000 bootstrap replicates that support the node with only values > 50% reported. The evolutionary distances were computed using the Dayhoff matrix based method (Schwarz and Dayhoff, 1979). The rate variation among sites was modelled with a gamma distribution (shape parameter = 8). All positions containing gaps and missing data were eliminated. The analysis involved 243 amino acid sequences (in red: reference TNLs, in green: reference CNLs, in black: 199 core NBS representing the diversity of NBS-encoding RGAs in Triticeae). 62 clades are shown and TIR-NBS taxa are distinguished from CC-NBS ones.
Figure 4.
Maximum parsimony phylogenetic comparison of Triticeae and non Triticeae NBS-encoding genes and RGAs. The numbers on the branches indicate the percentage of 1000 bootstrap replicates that support the node with only values > 50% reported. The MP tree was obtained using the Close-Neighbor-Interchange algorithm (Nei and Kumar, 2000). All positions containing gaps and missing data were eliminated. The analysis involved 243 amino acid sequences (in red: reference TNLs, in green: reference CNLs, in black: 199 core NBS representing the diversity of NBS-encoding RGAs in Triticeae). 89 clades are shown and TIR-NBS taxa are distinguished from CC-NBS ones.
Table 4.
Clades and super-clades, showing identical content between Neighbor-Joining (NJ) and Maximum Parsimony (MP) phylogenies; and including functional homologues among non Triticeae species.
| Clades / superclades with identical content
|
Member(s) among reference CNLs | |
|---|---|---|
| NJ | MP | |
| 1 | 65 | > gi|15236112|ref|NP_194339.1|disease resistance protein RPS2 [Arabidopsis thaliana] |
| > gi 15221252 ref NP_172686.1 disease resistance protein RPS5 [Arabidopsis thaliana] | ||
| 3 | 89 | > gi|152060786|gb|ABS29034.1|Lr1 disease resistance protein [Triticum aestivum] |
| 13 | 77+78 | > gi|22252946|gb|AAM94164.1|go35 NBS-LRR [Aegilops tauschii] |
| > gi|5702196|gb|AAD47197.1 |F107293_1 rust resistance protein [Zea mays] | ||
| 15 | 75 | > gi|37624724|gb|AAQ96158.1|powdery mildew resistance protein Pm3b [Triticum aestivum] |
| 24 | 19+20+21 | > gi|225030802|gb|ACN79514.1|resistance protein Pid3 [Oryza sativa Japonica Group] |
| 37 | 50 | > gi|85682844|gb|ABC73398.1|Piz-t [Oryza sativa Japonica Group] |
| 38+39 | 25+26+27 | > gi|33302327|gb|AAQ01784.1|resistance protein Lr10 [Triticum aestivum] |
| 50 | 31 | > gi|114329518|gb|ABI64281.1|CC-NBS-LRR Pi36 [Oryza sativa Indica Group] |
Clades containing functional homologues
Functional counterparts among reference proteins are likely to provide useful information on the functions of the Triticeae RGAs.
In the NJ tree, the 199 NBS Triticeae core NBS occurred in 50 clades. Among 16 reference CNLs from dicotyledone species, only two sequences from A. thaliana overlapped with Triticeae sequences. The remaining sequences either occurred in singletons or in clades including sequences from Cucumis melo, Solanum lycopersicum, Solanum tuberosum, Solanum bulbocastanum, Solanum demissum, Capsicum chacoense and Arabidopsis thaliana. Unlike dicots, CNLs from monocots mostly occurred in Triticeae clades. Indeed, out of 16 CNL of monocots, 14 occurred in 10 of Triticeae clades. These monocots overlapping with Triticeae were all from cereal genomes (Aegilops tauschii, Hordeum vulgare, Oryza sativa Japonica Group, Oryza sativa Indica Group, Triticum aestivum and Zea mays).
In the MP tree, the 199 NBS Triticeae core NBS occurred in 68 clades. In a similar way to NJ tree, CNLs from dicots did not overlap with Triticeae; however, among 16 CNLs from monocots, 11 occurred in 9 Triticeae clades.
Nine reference CNLs occurred, with both phylogenetic methods, in clades containing sequences from Triticeae, and thus could possibly provide an answer on their eventual functions. These CNLs were (i) two proteins from A. thaliana: RPS2 and RPS5, conferring resistance to two different strains of Pseudomonas syringae; (ii) two Oryza sativa proteins: Piz-t and Pid3, conferring resistance to two different strains of the fungus Magnaporthe grisea; (iii) three proteins of Triticum aestivum: Lr1 and Lr10 both conferring resistance to leaf rust and Pm3, conferring resistance to Powdery mildew; (iv) the Aegilops tauschii Go35 protein, conferring resistance to the cyst nematode, Heterodera avenae; and (v) the Rp1 protein, conferring rust resistance in maize (Table 4).
Motif extraction and analysis
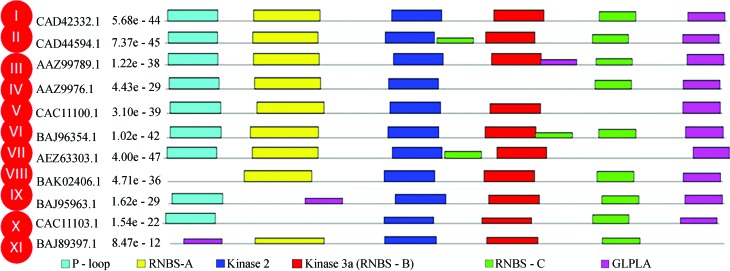
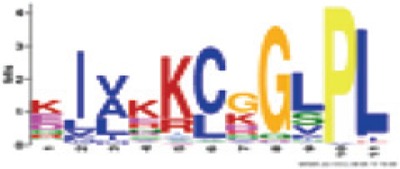
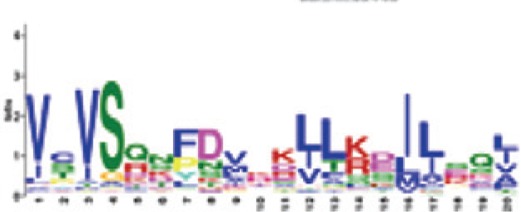
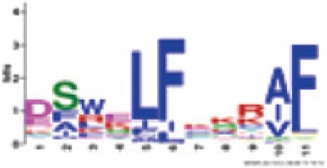
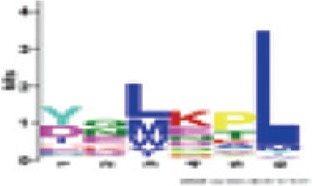
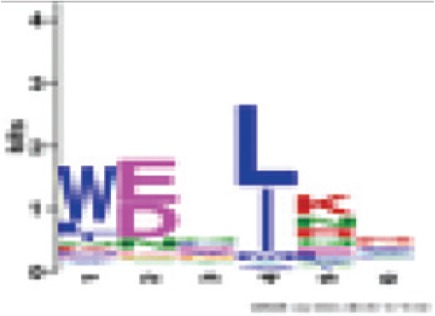
The unaligned dataset of 199 core NBS from Triticeae was analysed by MEME and results were obtained as motif summaries, with a mathematical description (E-value). Initially, setting the program for the detection of 6 patterns, has allowed the detection of the six major motifs of the NBS domain (P-loop, RNBS-A, Kinase-2, Kinase-3, RNBS-C and GLPL), recognized by Meyers et al. (2003). These patterns have been consistently detected in all sequences (number of detections = 199), with E-values ranging from 3.5 e−624 (for RNBS-C) to 7.7 e−1829 (for the P-loop), indicating that the conservation of all six patterns is highly significant (Table 5). Interestingly, we have revealed the existence of variation in the distribution of patterns along each sequence. In fact, some sequences had one or more weakly significant motifs (E-value 10−4); and some others had one or more motifs duplicated. Depending on the pattern of distribution of these six major patterns on each of the sequences studied, we identified 11 distinct profiles, which we designated I to XI (Figure 5).
Table 5.
Summary of motifs detected in an unaligned dataset of 199 sequences representative of the diversity of core NBS in Triticeae using MEME. Residues in the Arabidopsis motifs that are identical to the Triticeae ones are indicated in red.
| Motif | Logo | Annotation/position | Significance (e-value and percentage of occurrences) | Homology (if any) to Arabidopsis thaliana CNL motifs |
|---|---|---|---|---|
| 1 |

|
P-loop | 7.7e-1829 (100%) | Triticeae:
G[LV]
GKTTLA[QR]x[VI]YNDx A. thaliana CNL: VGIYGMG GVGKTTIARALF |
| 2 |

|
Kinase 2 | 1.4e-1803 (100%) | Triticeae: L[QK][GD]KR[YF][
LF][I
LV]
V[
LI]
DD[VI]WD A. thaliana CNL: KRF LLVLDDW |
| 3 |

|
Kinase 3a (RNBS-B) | 5.6e-1431 (100%) | Triticeae: x
GSR[I
V][I
L]V
TTRIxDVA A. thaliana CNL: N GCK VLF TTRSEEVC |
| 4 |
|
GLPLA | 8.2e-1120 (100%) | Triticeae: [KE]I[VAL]KK[CL][GK]
G[
LS]
PL A. thaliana CNL: EVAKKCG GLPLALKVI |
| 5 |
|
RNBS-A | 8.5e-1072 (100%) | Triticeae: VCVSQN[FP]DVxK[LI]L[KR][DE]I[LI][ES]Q[LI] A. thaliana CNL: VKxGFDIVIWVVVSQEFTLKKIQQDILEK |
| 6 |
|
RNBS-C | 3.5e-624 (100%) | Triticeae: DS
WELFx
KR[AI
V]F A. thaliana CNL: KVECLTPEEA WELFQR KV |
| 7 |

|
Between P-loop and RNBS-A | 3.6e-406 (100%) | Triticeae: GHFDCRA[WF] A. thaliana CNL: - |
| 8 |
|
Between Kinase3a and RNBS-C | 1.2e-091 (100%) | Triticeae: [YD]Q[LM]KPL A. thaliana CNL - |
| 9 |

|
Between RNBS-C and GLPLA | 1.6e+075 (100%) | Triticeae: E[LF]EE[IV][GSA] A. thaliana CNL: - |
| 10 |
|
Between Kinase2 and Kinase3a | 4.6e+082 (100%) | Triticeae: W[ED]x[LI]Kx A. thaliana CNL: - |
Figure 5.
Identification of 11 patterns of organization for the six major motifs of the NBS domain (P-loop, RNBS-A, Kinase-2, Kinase-3 and RNBS-C and GLPLA) in 199 Triticeae core NBS sequences, representing the diversity of core NBS in this tribe. Only motifs with an E-value of 0.0001 and that do not overlap other, more significant ones, are represented.
In the second step, the program has been set for the possible detection of additional motifs, adjusting the number of patterns to be detected to a maximum of 10. This new analysis yielded, in addition to the six standard patterns, four other motifs conserved in all 199 sequences with significant E-values (Table 5). The comparison of patterns of NBS sequences Triticeae, detected in the present study, with those present in A. thaliana CNLs (Meyers et al., 2003; Du Preez, 2005), has shown that the six major motifs share residues with their counterparts in Arabidopsis, unlike the four additional motifs that do not have equivalent in the latter species (Table 5).
Discussion
The agronomic importance of Triticeae makes their study at different biological scales a scientific and economic need. In particular, at the genomic level, there is a great interest to identify, characterize and classify Resistance Gene Analogs (RGAs), especially those that are part of the NBS domain-encoding gene family. The strategy we used in the present study consisted in querying various internet resources in order to build a representative and non-redundant collection of core NBS (central part of a conserved NB-ARC domain) for the Triticeae tribe. This collection is characterized by an intact NBS domain and is formed from complete or fragmentary protein sequences available in the various databases. For this, we have implemented several mining techniques, filtration and structuring raw data. A final dataset was built and subjected to a series of analyses to study pattern organization and phylogenetic structure. The primary dataset of 500 sequences was about five times larger than that reported in the Du Preez (2005) study (500 vs. 120). This important increment in the number of sequences reflects the multiplication of sequencing efforts across the gDNA and cDNA. The obtained core NBS dataset was reduced to 199 representative sequences by adopting a similarity threshold of 95%.
Analysis of protein patterns confirmed the general structural organization of the NBS domain in cereals, characterized by the presence of six conserved motifs identified by Meyers et al. (2003). We demonstrated the existence of variability in the distribution patterns along each sequence. Four additional conserved motifs were shown to be uniformly present in all 199 sequences with E-values 10−4. Two out of these four additional motifs (motifs 7 and 10 in Table 5) have already been identified by Du Preez (2005), who has labelled them “RNBS-A alternative” and “N-terminal to Kinase-2”, respectively. It is worthy of note that the large number of sequences (199) in which these motifs were detected provides a high confidence to their detection.
The reconstruction of the phylogeny of multigene families, such as the NBS gene family, is often very complex, and the level of complexity further increases with the number of sequences analysed. Different analyses were reported that were conducted on NBS domain-containing RGAs in several species of di- and monocots. Most of these analyses revealed a clustered organization. In non-cereals, Yang et al. (2013) reported a differential clustering of TNLs and CNLs, as well as the presence of nine distinct clusters, within 70 RGHs of cucumber. Jupe et al. (2012) showed that 73% of NBS-LRR genes of Solanum tuberosum are grouped into 63 clusters. Ameline-Torregrosa et al. (2008) reported that 80% of Medicago truncatula R-genes are clustered. It was also reported that 66% of 146 R-genes from A. thaliana are grouped into clusters (Meyers et al., 2003). In cereals, it was shown that 76% of RGAs in Oryza sativa are located in clusters (Luo et al., 2012), as well as 51% of those of B. distachyon (Tan and Wu, 2012). In the present study, 62 NJ clades and 89 MP ones were identified with a minimal statistical support of 50%. Despite this difference in numbers, a great similarity was observed between clades generated by both methods. We found that TNLs were clearly distinguished from CNLs from both Triticeae and non Triticeae. Within Triticeae clades, a high taxonomic heterogeneity was observed. This fact was expected since the orthology relationships between sequences make their grouping consistent with their functions and not with their taxonomy. Phylogenetic analyses revealed a significant overlap between Triticeae sequences and CNL-type functional genes from monocotyledons; against a low overlap between Triticeae sequences and CNL-type functional genes from dicotyledons. Those Triticeae sequences belonging to clades that contain at least a functional homolog may be potentially assigned to the function of the reference sequence. Therefore, A. thaliana proteins RPS2 and RPS5 (for resistance to Pseudononas syringae) and rice sequences Piz-t and PID3 (for resistance to Magnaporthe grisea) could be interesting for further studying, since no resistance genes to these pathogens have been described, yet, in Triticeae species.
Although mostly occurring on rice, the fungus Magnaporthe grisea (rice blast fungus) has also been reported as the causal organism of wheat head blast and may induce important yield losses in wheat, barley and rye (Prestes et al., 2007). In Triticeae crops, major emphasis is often placed on the study of fungal diseases, because of the scarce reports on Pseudomonas-caused ones. Nevertheless, it has been reported that, out of almost 50 known P. syringae pathovars, P. syringae pv. atrofaciens causes “basal glume blotch” in wheat and barley (Toben et al., 1991; Valencia-Botín and Cisneros-López, 2012), P. syringae pv. syringae causes “leaf blight” in wheat and barley (Toben et al., 1991; Valencia-Botín and Cisneros-López, 2012), P. syringae pv. japonica can cause blight or striated areas on the nodes (Valencia-Botín and Cisneros-López, 2012), in addition to other Pseudomonads that are known to infect wheat, such as P. cichorii, causing stem or shank melanosis and P. fuscovaginae that induces a black rot in the wheat sheath.
So far, few Triticeae NBS-encoding genes have been functionally identified. Among these, four from T. aestivum (Pm3, Lr1, Lr10 and Lr21), three from Hordeum vulgare (MLA1, MLA10 and MLA13) and a single gene from Aegilops tauchii (Cre1). With further progress in the wheat and barley genomes annotation and physical mapping, comparisons will be made possible between phylogenetic clades and chromosomal positions.
Acknowledgments
This study was supported financially by the Tunisian Ministry of Higher Education. We gratefully acknowledge Jacques-Déric ROUAULT (Laboratoire Evolution, Genome et Speciation, CNRS, Gif sur Yvette, France), for providing training and Abdelkader Aïnouche (UMRCNRS Ecobio, Universite de Rennes-1, France) for helpful discussion.
Footnotes
Associate Editor: Guilherme Corrêa de Oliveira
References
- Ameline-Torregrosa C, Wang BB, O’Bleness MS. Identification and characterization of nucleotide-binding site-leucine-rich repeat genes in the model plant Medicago truncatula. Plant Physiol. 2008;146:5–21. doi: 10.1104/pp.107.104588. [DOI] [PMC free article] [PubMed] [Google Scholar]
- Bailey TL, Elkan C. Fitting a mixture model by expectation maximization to discover motifs in biopolymers. Proceedings of the Second International Conference on Intelligent Systems for Molecular Biology; AAAI Press, Menlo Park. 1994. pp. 28–36. [PubMed] [Google Scholar]
- Brenchley R, Spannagl M, Pfeifer M, Barker GL, D’Amore R, Allen AM, McKenzie N, Kramer M, Kerhornou A, Bolser D, et al. Analysis of the bread wheat genome using whole-genome shotgun sequencing. Nature. 2012;491:705–710. doi: 10.1038/nature11650. [DOI] [PMC free article] [PubMed] [Google Scholar]
- Buschges R, Hollricher K, Panstruga R, Simons G, Wolter M, Frijters A, van Daelen R, van der Lee T, Diergaarde P, Groenendijk J, et al. The barley Mlo gene: A novel control element of plant pathogen resistance. Cell. 1997;88:695–705. doi: 10.1016/s0092-8674(00)81912-1. [DOI] [PubMed] [Google Scholar]
- Cameron M, Bernstein Y, Hugh E. Clustered sequence representation for fast homology search. J Comput Biol. 2007;4:594–614. doi: 10.1089/cmb.2007.R005. [DOI] [PubMed] [Google Scholar]
- Delorenzi M, Speed T. An HMM model for coiled-coil domains and a comparison with PSSM-based predictions. Bioinformatics. 2002;18:617–625. doi: 10.1093/bioinformatics/18.4.617. [DOI] [PubMed] [Google Scholar]
- Du Preez FB. Tracking nucleotide-binding-site-leucine-rich-repeat resistance gene analogues in the wheat genome complex. 2005. Dissertation, University of Pretoria.
- Eddy SR. Profile hidden Markov models. Bioinformatics. 1998;14:755–763. doi: 10.1093/bioinformatics/14.9.755. [DOI] [PubMed] [Google Scholar]
- Jupe F, Pritchard L, Etherington GJ, MacKenzie K, Cock PJA, Wright F, Sharma SK, Bolser D, Bryan GJ, Jones JDG, et al. Identification and localisation of the NB-LRR gene family within the potato genome. BMC Genomics. 2012;13:e75. doi: 10.1186/1471-2164-13-75. [DOI] [PMC free article] [PubMed] [Google Scholar]
- Hall TA. Bioedit: A user-friendly biological sequence alignment editor and analysis program for Windows 95/98/NT. Nucleic Acids Symp Ser. 1999;41:95–98. [Google Scholar]
- Han J, Kamber M. Data Mining: Concepts and Techniques. 2nd. Morgan Kaufmann Publishers; San Francisco: 2006. p. 696. [Google Scholar]
- Huang L, Brooks S, Li W, Fellers J, Nelson JC, Gill B. Evolution of new disease specificity at a simple resistance locus in a crop-weed complex: Reconstitution of the Lr21 gene in wheat. Genetics. 2009;182:595–602. doi: 10.1534/genetics.108.099614. [DOI] [PMC free article] [PubMed] [Google Scholar]
- International Barley Genome Sequencing Consortium A physical, genetic and functional sequence assembly of the barley genome. Nature. 2012;491:711–716. doi: 10.1038/nature11543. [DOI] [PubMed] [Google Scholar]
- Ling HQ, Zhao S, Liu D, Wang J, Sun H, Zhang C, Fan H, Li D, Dong L, Tao Y, et al. Draft genome of the wheat A-genome progenitor Triticum urartu. Nature. 2013;496:87–90. doi: 10.1038/nature11997. [DOI] [PubMed] [Google Scholar]
- Löve Á. Conspectus of the Triticeae. Feddes Repertorium. 1984;95:425–521. [Google Scholar]
- Lozano R, Ponce O, Ramirez M, Mostajo N, Orjeda G. Genome-wide identification and mapping of NBS-encoding resistance genes in Solanum tuberosum group Phureja. PLoS One. 2012;7:e34775. doi: 10.1371/journal.pone.0034775. [DOI] [PMC free article] [PubMed] [Google Scholar]
- Luo S, Zhang Y, Hu Q, Chen J, Li K, Lu C, Liu H, Wang W, Kuang H. Dynamic nucleotide-binding site and leucine-rich repeat-encoding genes in the grass family. Plant Physiol. 2012;159:197–210. doi: 10.1104/pp.111.192062. [DOI] [PMC free article] [PubMed] [Google Scholar]
- Madsen LH, Colins NC, Rakwalska M, Backes G, Sandal N, Krusell L, Jensen J, Waterman EH, Jahoor A, Ayliffe M, et al. Barley disease resistance gene analogues of the NBS-LRR class: Identification and mapping. Mol Genet Genomics. 2003;269:150–161. doi: 10.1007/s00438-003-0823-5. [DOI] [PubMed] [Google Scholar]
- Marone D, Russo MA, Laidò G, De Leonardis AM, Mastrangelo AM. Plant Nucleotide Binding Site-Leucine-Rich Repeat (NBS-LRR) genes: Active guardians in host defense responses. Int J Mol Sci. 2013;14:7302–7326. doi: 10.3390/ijms14047302. [DOI] [PMC free article] [PubMed] [Google Scholar]
- Meyers BC, Dickerman AW, Michelmore RW, Sivaramakrishnan S, Sobral BW, Young ND. Plant disease resistance genes encode members of an ancient and diverse protein family within the nucleotidebinding superfamily. Plant J. 1999;20:317–332. doi: 10.1046/j.1365-313x.1999.t01-1-00606.x. [DOI] [PubMed] [Google Scholar]
- Meyers BC, Kozik A, Griego A, Kuang H, Michelmore RW. Genome-wide analysis of NBS-LRR-encoding genes in Arabidopsis. Plant Cell. 2003;15:809–834. doi: 10.1105/tpc.009308. [DOI] [PMC free article] [PubMed] [Google Scholar]
- Nei M, Kumar S. Molecular Evolution and Phylogenetics. Oxford University Press; New York: 2000. p. 333. [Google Scholar]
- Porter BW, Paidi M, Ming R, Alam M, Nishijima WT, Zhu YJ. Genome-wide analysis of Carica papaya reveals a small NBS resistance gene family. Mol Genet Genomics. 2009;281:609–626. doi: 10.1007/s00438-009-0434-x. [DOI] [PubMed] [Google Scholar]
- Prestes AM, Arendt PF, Fernandes JMC, Scheeren PL. Resistance to Magnaporthe Grisea among Brazilian wheat genotypes. Dev Plant Breed. 2007;12:119–123. [Google Scholar]
- Romer P, Hahn S, Jordan T, Strauss T, Bonas U, Lahaye T. Plant pathogen recognition mediated by promoter activation of the pepper Bs3 resistance gene. Science. 2007;318:645–648. doi: 10.1126/science.1144958. [DOI] [PubMed] [Google Scholar]
- Rostoks N, Zale J, Soule J, Brueggeman R, Druka A, Kudrna D, Steffenson B, Kleinhofs A. A barley gene family homologous to the maize rust resistance gene Rp1-D. Theor Appl Genet. 2002;104:1298–1306. doi: 10.1007/s00122-002-0902-8. [DOI] [PubMed] [Google Scholar]
- Sanseverino W, Ercolano MR. In silico approach to predict candidate R proteins and to define their domain architecture. BMC Res Notes. 2012;5:678. doi: 10.1186/1756-0500-5-678. [DOI] [PMC free article] [PubMed] [Google Scholar]
- Sanseverino W, Roma G, De Simone M, Faino L, Melito S, Stupka E, Frusciante L, Ercolano MR. PRGdb: A bioinformatics platform for plant resistance gene analysis. Nucleic Acids Res. 2010;38:D814–D821. doi: 10.1093/nar/gkp978. [DOI] [PMC free article] [PubMed] [Google Scholar]
- Schuster-Böckler B, Schultz J, Rahmann S. HMM Logos for visualization of protein families. BMC Bioinformatics. 2004;5:e7. doi: 10.1186/1471-2105-5-7. [DOI] [PMC free article] [PubMed] [Google Scholar]
- Schwarz R, Dayhoff M. Matrices for detecting distant relationships. In: Dayhoff M, editor. Atlas of protein sequences, National Biomedical Research Foundation. Silver Spring, Md: 1979. pp. 353–58. [Google Scholar]
- Tamura K, Peterson D, Peterson N, Steecher G, Nei M, Kumar S. MEGA: Molecular Evolutionary Genetics Analysis using maximum likelihood, evolutionary distance, and maximum parsimony methods. Mol Biol Evol. 2011;28:2731–2739. doi: 10.1093/molbev/msr121. [DOI] [PMC free article] [PubMed] [Google Scholar]
- Tan S, Wu S. Genome-wide analysis of nucleotide-binding site disease resistance genes in Brachypodium distachyon. Comp Funct Genom. 2012;2012:418208. doi: 10.1155/2012/418208. [DOI] [PMC free article] [PubMed] [Google Scholar]
- Toben H, Mavridis A, Rudolph KWE. On the occurrence of basal glume root wheat and barley caused by Pseudomonas syringae pv. atrofaciens in West Germany. J Plant Dis Prot. 1991;98:225–235. [Google Scholar]
- Valencia-Botín AJ, Cisneros-López ME. A review of the studies and interactions of Pseudomonas syringae pathovars on wheat. Int J Agron. 2012;2012:692350. [Google Scholar]
- Yang L, Li D, Li Y, Gu X, Huang S, Garcia-Mas J, Weng Y. A 1,681-locus consensus genetic map of cultivated cucumber including 67 NB-LRR resistance gene homolog and ten gene loci. BMC Plant Biol. 2013;13:e53. doi: 10.1186/1471-2229-13-53. [DOI] [PMC free article] [PubMed] [Google Scholar]
- Yang S, Zhang X, Yue JX, Tian D, Chen JQ. Recent duplications dominate NBS-encoding gene expansion in two woody species. Mol Genet Genomics. 2008;280:187–198. doi: 10.1007/s00438-008-0355-0. [DOI] [PubMed] [Google Scholar]
- Yu J, Tehrim S, Zhang F, Tong C, Huang J, Cheng X, Dong C, Zhou Y, Qin R, Hua W, Liu S. Genome-wide comparative analysis of NBS-encoding genes between Brassica species and Arabidopsis thaliana. BMC Genomics. 2014;15:e3. doi: 10.1186/1471-2164-15-3. [DOI] [PMC free article] [PubMed] [Google Scholar]
Internet Resources
- National Center of Biotechnology Information (NCBI) Taxonomy database. http://www.ncbi.nlm.nih.gov/taxonomy (July 20, 2013)
- National Center of Biotechnology Information (NCBI) GenBank. ( http://www.ncbi.nlm.nih.gov/genbank/) (February 02, 2013)
- Plant Resistance Gene database (PRGdb) www.prgdb.org (December 02, 2013)
- The Dana-Farber Cancer Institute (DFCI) Expressed Sequence Tag (EST)-based Gene Indices (GIs) http://compbio.dfci.harvard.edu/tgi/ (February 18, 2013)
- Multiple Sequence Comparison by Log- Expectation (MUSCLE) http://www.ebi.ac.uk/Tools/msa/muscle/ (March 17, 2013)
- LogoMat-M software. (Schuster-Böckler et al., 2004) http://www.sanger.ac.uk/cgi-bin/software/analysis/LOGOMAT-m.cgi (May 17, 2013). [Google Scholar]
- HMMER 3.0 software, http://hmmer.org/ (May 29, 2013).
- HMMER web server, http://hmmer.janelia.org/search/hmmsearch (April 24, 2013).
- The European Molecular Biology Open Software Suite (EMBOSS) version 6.5.0.0, ftp://em-boss.open-bio.org/pub/EMBOSS/ (May 05, 2013).
- Biological Sequence Clustering and Comparison (CD-HIT Suite) http://weizhong-lab.ucsd.edu/cdhit_suite/cgi-bin/index.cgi?cmd=Server%20home (May 17, 2013).
- Multiple Expectation Maximization for Motif Elicitation (MEME) http://meme.nbcr.net/meme/cgi-bin/meme.cgi (June 06, 2013).


