Abstract
RNAseq technology is replacing microarray technology as the tool of choice for gene expression profiling. While providing much richer data than microarray, analysis of RNAseq data has been much more challenging. Among the many difficulties of RNAseq analysis, correctly adjusting for batch effect is a pivotal one for large-scale RNAseq based studies. The batch effect of RNAseq data is most obvious in microRNA (miRNA) sequencing studies. Using real miRNA sequencing (miRNAseq) data, we evaluated several batch removal techniques and discussed their effectiveness. We illustrate that by adjusting for batch effect, more reliable differentially expressed genes can be identified. Our study on batch effect in miRNAseq data can serve as a guideline for future miRNAseq studies that might contain batch effect.
Keywords: miRNA sequencing, batch effect removal, normalization
Introduction
Gene expression refers to the process of synthesizing a functional gene product from the information encoded in a gene, and the study of gene expression is central to biomedical research. While the traditional method of gene expression analysis is microarray technology, next-generation sequencing technologies offer a competitive alternative in RNAseq. Indeed, due to several advantages of RNAseq technology over microarray, specifically its ability to identify genes not included in a predetermined probe, its expanded resolution allows for expression detection at the gene, exon, transcript, and coding DNA sequence (CDS) levels, and its ability to detect structural variants in addition to gene expression, RNAseq has begun to replace microarray altogether (1-3). With the price of RNAseq falling to levels comparable to microarray, this trend is expected to continue.
One of the interesting features of RNAseq technology is its ability to sequence microRNA (miRNA), which are small, non-coding species of RNA that play a variety of roles in the regulation of gene expression. Primarily responsible for translational repression (4-6), miRNA have vast scope with a single miRNA capable of regulating multiple mRNAs and over 2,000 different species of miRNA currently identified in humans according to miRBase (v19) (7). The impact of dysfunction in this regulatory network is the long list of diseases linked to miRNA expression (8).
There is a common misconception regarding RNAseq data’s quantitativeness. Both RNAseq data and microarray data are rather qualitative rather than quantitative. Like microarray, RNAseq experiment requires samples representing at least two conditions to produce meaningful relative differential expression results. RNAseq performed on samples from a single condition can only tell whether a gene is expressed relatively. On rare occasions, RNAseq can be quantitative when all reverse transcribed cDNA fragments are sequenced. Even in such a scenario, the quantitativeness can still be affected by effects from PCR. The challenge of RNAseq technology comes in the analysis of the data it generates. Non-expressed genes are assigned a read count of 0 and comprise as much as 50% of the data set, making the log transformation commonly used for microarray data impossible. The huge range of reads in an RNAseq dataset (between 0 and 10,000+) can introduce problems such as false high fold changes resulting from very small expression values, and errors are also introduced by the sequencing process including de-multiplexing and alignment ambiguity. These characteristics complicate the analysis of RNAseq data, and while many methods of gene expression analysis have been developed, there is no clear consensus on which of these methods generates the most reliable results. One of the most popular is a normalization method known as reads per kilobase per million mapped reads (RPKM) (9) or the similar fragments per kilobase of transcript per million mapped reads (FPKM) (10). RPKM follows a simple formula, , where C is the number of reads mapped to the gene, N is the total number of reads mapped to all genes, and L is the length of the gene.
Batch effects are technical sources of variation that have been added to samples during processing. They can confound the scenarios and prevent us from reaching the true conclusion. The common sources of batch effect include time, location, machine, and personnel. Additional sources of batch effect may exist but are harder to detect. Many batch effect removal techniques have been introduced for microarray data such as the Bayesian based method ComBat (11).
Batch effect in RNAseq data has been considered widespread and should be properly addressed (12-14). For RNAseq technology, other than the aforementioned sources, a new source of batch effect is the number of total read sequenced. For example, a sample for which 20 million reads are sequenced tends to detect fewer genes than the same sample with 40 million sequenced reads. In high-throughput sequencing, on an Illumina HiSeq 2000/2500, up to 200 million reads can be produced on one lane (15). Multiplexing, or labeling samples with unique barcodes before pooling them together on a single lane, is commonly used as a measure to save money. After the reads are generated, the unique barcode can be used to trace back each read’s origin. The most important requirement for successful multipexing is equal representation of genomic content for each sample within the pool. However, in our previous study we have shown that even if the genomic content for each sample within the pool is equal, other factors can skew the proportion of reads sequenced for each sample (16). These factors include sample quality and sequencing depth, library preparation, and fragmentation, among others. Under the same conditions, it is known that higher quality samples tend to yield more reads on the Illumina sequencer. Thus, it is common to observe samples with 2 to 3 times read count difference from the same RNAseq experiment.
Read count differences can result in read count batch effects which should be addressed in RNAseq data. Read count differences are most commonly observed in miRNA sequencing (miRNAseq) data, partially due to the low capture efficiency of miRNA library preparation compared to the poly-A tail-based messenger RNA library preparation. In regular messenger RNA sequencing, around 50% of reads will align to exome regions (3,17). However, for miRNAseq, usually less than 10% of reads align to miRNA references. Because the abundance of miRNA is much less compared to mRNA, read counts can easily skew the number of detectable miRNA. Using real miRNAseq data, we evaluated several strategies for the removal of batch effects, and we discuss their efficiency.
Methods
Liver samples from 24 patients were extracted. The 24 samples can be divided into four subgroups: normal (N=6), steatosis (N=8), steatohepatitis (N=7) and cirrhosis (N=3). Library construction was performed on the total RNA. From the same library, miRNAseq was performed twice on the 24 samples using the same machine but 10 days apart. We call the first batch a and second batch b. The resulting miRNAseq FASTQ data were processed as follows. Due to the small size (22-25 base pairs) of miRNA and longer read length (50 base pairs), parts of the sequenced read did not represent miRNA but rather the adaptor. Those adaptor sequences were trimmed to obtain adaptor sequence-free FASTQ files. A majority of the sequenced reads from an miRNAseq experiment are the result of contamination from ribosomal RNA. We performed alignment against ribosomal RNA to identify and remove all these unwanted sequences. Even after decontamination, some remaining reads may be still sequenced from mRNA. Thus we aligned the rest of the reads against mRNA reference and eliminated likely mRNA sequences to obtain the most likely candidates for miRNA. A final alignment was performed against miRNA (1,733 entries) and precursor miRNA (1,424 entries) reference sequences downloaded from mirBASE (7). The miRNA processing pipeline is depicted in Figure S1. Read count and RPKM were generated for each miRNA and precursor miRNA for each sample. Fold changes were computed as a measurement for differential expression.
Differential expression analysis can only be conducted between two phenotypes such as tumor vs. normal or treated vs. untreated. The ideal assumption for conducting differential expression analysis is that gene expression patterns are similar for samples within the same phenotype group (i.e., relatively homogeneous). Sometimes, however, this assumption does not hold true. A sample from one phenotype group may be more similar to the samples from the other phenotype groups based merely on expression profile. Clusters and heat maps were generated using a modified “heatmap” package from R v3.02.
Results
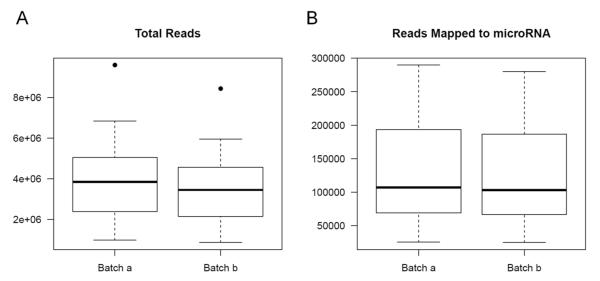
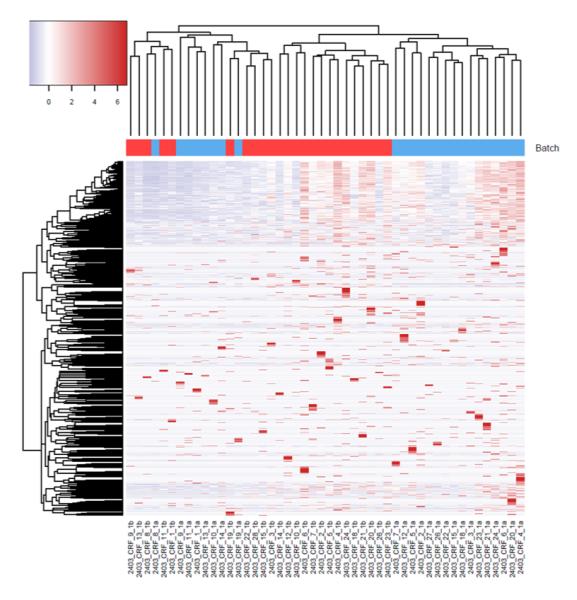
For the example study we used, between batch a and batch b, there is significant read count difference for total reads sequenced (P=5.379e-08) (Figure 1A) and reads aligned to miRNA reference (P=3.427e-07) (Figure 1B). Ideally, we would expect the results from batch a and batch b to match perfectly, because they are produced from the same sequencing library and machine. To test if the two batches agree, we performed cluster analysis. Spearman’s correlation coefficient is used as the measuring distance between two samples over Pearson’s correlation coefficient due to its immunity to outliers. From the cluster, we can calculate sub-typing accuracy. Sub-typing accuracy is computed as the number of pair agreements (technical replicates clustered together) between batch a and b divided by the total number of pairs. The total number of pairs is 24 in this study. Our initial cluster using all miRNA detected shows that the sub-typing accuracy is 8.3% (Figure 2). Clearly, batch a and batch b lack the reasonable consistency we would expect.
Figure 1.

(A) Total read distributions for batch a and b; (B) miRNA mapped read distributions for batch a and b. Batch a has more reads than batch b.
Figure 2.

Cluster analysis shows poor sub-typing accuracy between batch a and batch b.
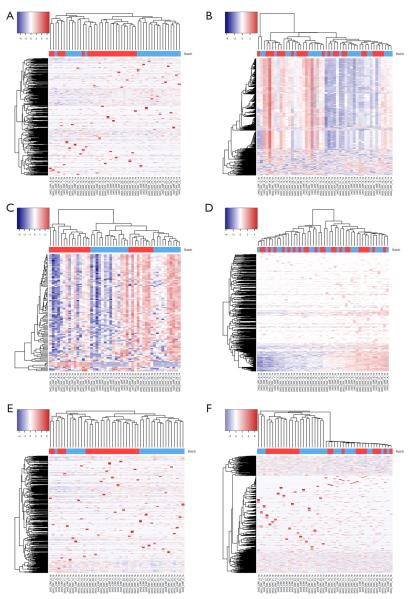
To minimize the effect of batch, we tested six different approaches. First, we performed quantile normalization which is a technique for making two distributions identical in statistical properties so they can be compared. Quantile normalization has been used frequently in microarray data to remove batch effects (18). After performing quantile normalization on miRNAseq data, the cluster showed no improvement (Figure 3). The sub-typing accuracy stayed at 8.3%. Then, we performed conditional quantile normalization (19). Conditional quantile normalization accounts for GC content and gene length during normalization. For miRNAseq data, the gene length is not an issue because all miRNAs have length between 22-25 base pairs. But GC content can still skew the read coverage for miRNA. The cluster result after conditional quantile normalization showed some improvement with sub-typing accuracy increased to 29%.
Figure 3.
(A) Cluster result using data after quantile normalization; (B) cluster result using data after conditional quantile normalization; (C) cluster result using top 50 miRNA ranked by coefficient of variance; (D) cluster results using data after median centering; (E) cluster results using data after total read count normalization; (F) cluster results using data after trimmed mean of M-values normalization.
Next, we used a noise reduction technique. When the majority of the miRNA lack variation among samples, the cluster may be unrepresentative of the true phenotype group. To alleviate this, we also performed additional cluster analyses on miRNA with read counts filtered by the top coefficient of variation (COV) (top 10% of genes by COV). In theory, the clustering could improve as more stringent COV cutoffs are used. However, the new cluster shows a sub-typing accuracy of 0% (Figure 3A) which indicates that selecting miRNA with high variation did not improve sub-typing. Note that, selecting genes with top COV is a method frequently used for cluster analysis. Because the number of genes is significantly reduced, it is not suitable for differential expression analysis. But this method does inform us of the severity of the batch effect.
The fourth method we tried was median centering on genes. For each miRNA, we computed its median across all samples and centered this miRNA on the median. The sub-typing accuracy increased to 54.2% (Figure 3C) after median centering. The fifth method we tried is total read count normalization (20). The cluster result showed zero sub-typing accuracy. The last method we tried was trimmed mean of M-values (21) which is implemented in Bioconductor package edgeR. This method did not perform well and had a sub-typing accuracy at 4%.
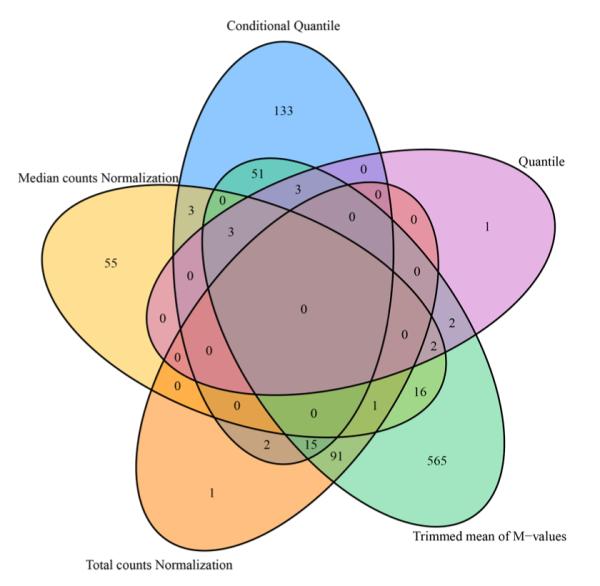
From a different perspective, we examined the data’s batch effect using differential expression analysis. Because there is lack of consensus among RNAseq differential expression analysis packages (22), instead of picking a single method, we used fold change as the measure of differential expression. Fold changes were computed between disease (steatosis, steatohepatitis and cirrhosis) and normal groups. The complete results can be found in Table S1. Using absolute fold change 2 as cutoff, we found that different normalization methods produced different results (Figure 4). Note that, this fold change analysis does not inform us which normalization method works better, but it can inform us that there are severe difference among the normalization methods.
Figure 4.

Venn diagram shows the consistency of differentially expressed miRNA between disease and normal groups. Absolute fold change 2 is used as cutoff.
Conclusions
Batch effect has been documented for high throughput sequencing technology by previous studies (19,23). By examining real miRNAseq data, we showed that batch effect can greatly affect the outcome of gene expression analysis, and that the effect is much more severe for miRNAseq data. Through clustering, we tested six different approaches attempting to minimize the effect of batches. Among the batch effect reduction methods we tested, median center performed most effectively. Based on the results we have obtained, we recommend using median center by gene to minimize the impact of batch effects in miRNAseq data. Also, through differential expression analysis we showed that differentially expressed miRNA are highly dependent on the normalization method used.
Supplementary Material
Acknowledgements
This study was supported by CCSG (P30 CA068485). Core Services performed through Vanderbilt University Medical Center's Digestive Disease Research Center supported by NIH grant P30DK058404. The project described was supported by the National Center for Research Resources, Grant UL1 RR024975-01, and is now at the National Center for Advancing Translational Sciences, Grant 2 UL1 TR000445-06. The content is solely the responsibility of the authors and does not necessarily represent the official views of the NIH. We would also like to thank Margot Bjoring for editorial support.
Footnotes
Disclosure: The authors declare no conflict of interest.
References
- 1.Wang Z, Gerstein M, Snyder M. RNA-Seq: a revolutionary tool for transcriptomics. Nat Rev Genet. 2009;10:57–63. doi: 10.1038/nrg2484. [DOI] [PMC free article] [PubMed] [Google Scholar]
- 2.Shendure J. The beginning of the end for microarrays? Nat Methods. 2008;5:585–7. doi: 10.1038/nmeth0708-585. [DOI] [PubMed] [Google Scholar]
- 3.Guo Y, Sheng Q, Li J, et al. Large scale comparison of gene expression levels by microarrays and RNAseq using TCGA data. PLoS One. 2013;8:e71462. doi: 10.1371/journal.pone.0071462. [DOI] [PMC free article] [PubMed] [Google Scholar]
- 4.Chen K, Rajewsky N. The evolution of gene regulation by transcription factors and microRNAs. Nat Rev Genet. 2007;8:93–103. doi: 10.1038/nrg1990. [DOI] [PubMed] [Google Scholar]
- 5.Bartel DP. MicroRNAs: target recognition and regulatory functions. Cell. 2009;136:215–33. doi: 10.1016/j.cell.2009.01.002. [DOI] [PMC free article] [PubMed] [Google Scholar]
- 6.Kusenda B, Mraz M, Mayer J, et al. MicroRNA biogenesis, functionality and cancer relevance. Biomed Pap Med Fac Univ Palacky Olomouc Czech Repub. 2006;150:205–15. doi: 10.5507/bp.2006.029. [DOI] [PubMed] [Google Scholar]
- 7.Kozomara A, Griffiths-Jones S. miRBase: integrating microRNA annotation and deep-sequencing data. Nucleic Acids Res. 2011;39:D152–7. doi: 10.1093/nar/gkq1027. [DOI] [PMC free article] [PubMed] [Google Scholar]
- 8.Jiang Q, Wang Y, Hao Y, et al. miR2Disease: a manually curated database for microRNA deregulation in human disease. Nucleic Acids Res. 2009;37:D98–104. doi: 10.1093/nar/gkn714. [DOI] [PMC free article] [PubMed] [Google Scholar]
- 9.Mortazavi A, Williams BA, McCue K, et al. Mapping and quantifying mammalian transcriptomes by RNA-Seq. Nat Methods. 2008;5:621–8. doi: 10.1038/nmeth.1226. [DOI] [PubMed] [Google Scholar]
- 10.Trapnell C, Williams BA, Pertea G, et al. Transcript assembly and quantification by RNA-Seq reveals unannotated transcripts and isoform switching during cell differentiation. Nat Biotechnol. 2010;28:511–5. doi: 10.1038/nbt.1621. [DOI] [PMC free article] [PubMed] [Google Scholar]
- 11.Johnson WE, Li C, Rabinovic A. Adjusting batch effects in microarray expression data using empirical Bayes methods. Biostatistics. 2007;8:118–27. doi: 10.1093/biostatistics/kxj037. [DOI] [PubMed] [Google Scholar]
- 12.Leek JT, Scharpf RB, Bravo HC, et al. Tackling the widespread and critical impact of batch effects in high-throughput data. Nat Rev Genet. 2010;11:733–9. doi: 10.1038/nrg2825. [DOI] [PMC free article] [PubMed] [Google Scholar]
- 13.Bullard JH, Purdom E, Hansen KD, et al. Evaluation of statistical methods for normalization and differential expression in mRNA-Seq experiments. BMC Bioinformatics. 2010;11:94. doi: 10.1186/1471-2105-11-94. [DOI] [PMC free article] [PubMed] [Google Scholar]
- 14.Li J, Witten DM, Johnstone IM, et al. Normalization, testing, and false discovery rate estimation for RNA-sequencing data. Biostatistics. 2012;13:523–38. doi: 10.1093/biostatistics/kxr031. [DOI] [PMC free article] [PubMed] [Google Scholar]
- 15.Guo Y, Samuels DC, Li J, et al. Evaluation of allele frequency estimation using pooled sequencing data simulation. ScientificWorldJournal. 2013;2013:895496. doi: 10.1155/2013/895496. [DOI] [PMC free article] [PubMed] [Google Scholar]
- 16.Guo Y, Cai Q, Li C, et al. An evaluation of allele frequency estimation accuracy using pooled sequencing data. Int J Comput Biol Drug Des. 2013;6:279–93. doi: 10.1504/IJCBDD.2013.056709. [DOI] [PMC free article] [PubMed] [Google Scholar]
- 17.Guo Y, Li CI, Ye F, et al. Evaluation of read count based RNAseq analysis methods. BMC Genomics. 2013;14(Suppl 8):S2. doi: 10.1186/1471-2164-14-S8-S2. [DOI] [PMC free article] [PubMed] [Google Scholar]
- 18.Sun Z, Chai HS, Wu Y, et al. Batch effect correction for genome-wide methylation data with Illumina Infinium platform. BMC Med Genomics. 2011;4:84. doi: 10.1186/1755-8794-4-84. [DOI] [PMC free article] [PubMed] [Google Scholar]
- 19.Hansen KD, Irizarry RA, Wu Z. Removing technical variability in RNA-seq data using conditional quantile normalization. Biostatistics. 2012;13:204–16. doi: 10.1093/biostatistics/kxr054. [DOI] [PMC free article] [PubMed] [Google Scholar]
- 20.Marioni JC, Mason CE, Mane SM, et al. RNA-seq: an assessment of technical reproducibility and comparison with gene expression arrays. Genome Res. 2008;18:1509–17. doi: 10.1101/gr.079558.108. [DOI] [PMC free article] [PubMed] [Google Scholar]
- 21.Robinson MD, McCarthy DJ, Smyth GK. edgeR: a Bioconductor package for differential expression analysis of digital gene expression data. Bioinformatics. 2010;26:139–40. doi: 10.1093/bioinformatics/btp616. [DOI] [PMC free article] [PubMed] [Google Scholar]
- 22.Guo Y, Zhao S, Ye F, et al. MultiRankSeq: Multiperspective Approach for RNAseq Differential Expression Analysis and Quality Control. BioMed Research International. 2014;2014:8. doi: 10.1155/2014/248090. [DOI] [PMC free article] [PubMed] [Google Scholar]
- 23.Auer PL, Doerge RW. Statistical design and analysis of RNA sequencing data. Genetics. 2010;185:405–16. doi: 10.1534/genetics.110.114983. [DOI] [PMC free article] [PubMed] [Google Scholar]
Associated Data
This section collects any data citations, data availability statements, or supplementary materials included in this article.


