Abstract
Chronic diseases, such as heart disease, diabetes, and obesity, have been linked with diet. Nutrient intake is also associated with diet. However, much of the research completed to elucidate these associations has not incorporated the concept of time. This paper introduces the concept of temporal dietary patterns and demonstrates a novel construct of 24-hour temporal dietary patterns for energy intake, present in a sample of the adult U.S. population 20 years and older (NHANES 1999–2004 dataset). An appropriate distance metric is proposed for comparing 24-hour diet records and is used with kernel k-means clustering to identify the temporal dietary patterns.
I. Introduction
Popular cultural and conventional wisdom have long shaped public opinion regarding the time meals should be consumed, which meal should be the largest meal, and at what times of day food should be avoided. The adage, ‘Eat breakfast like a king, lunch like a prince, and supper like a pauper’, is an example of these widely distributed ideas which remain largely as ideas, not fully addressed by scientific investigation [1], [2]. The type of analysis traditionally used in nutrition epidemiology cannot handle the multidimensionality required to address the complexities of diet, health outcomes, and time relationships that are inherent to this question and similar questions. New methodologies are critical to advance our knowledge of how the intricacies of diet and time are related to health. The research herein, describing temporal dietary patterns, is an example of how novel methodologies resulting from collaborations between disciplines produce powerful tools with the capacity to aptly handle such questions. Multidisciplinary expertise melded with complex machine learning tools allows proper investigation of assumptions that will expand our insight into the relationship of diet, time of eating and health.
Dietary patterns are an emerging area of research. Traditional associations of diet to health have focused primarily on a single nutrient or a single food and an identified health outcome. More recently, however, researchers have forayed to investigate the relationship of multiple nutrients, foods, or a combination of foods and nutrients, to a particular health outcome [3], [4], [5], [6], [7], [8]. Such food or nutrient combinations that are intended to typify key factors of the diet or the total diet have been generically termed as dietary patterns. Dietary patterns research presents several benefits over single nutrient analysis including, the recognition that people do not eat a nutrient solely, rather, people eat foods which contain multiple nutrients. Thus, dietary patterns may represent a more comprehensive characterization of the diet. Nutrients are known to interact or have synergistic effects, making the detection of an affect of a single nutrient difficult. Identification of a dietary pattern may reveal a stronger association with a particular indicator of health or allow for a more comprehensive and inclusive understanding of how nutrients are consumed [9], [10].
Researchers with an epidemiological and nutrition background have used various methods to identify dietary patterns. A single numerical score to evaluate the diet, termed a dietary index, is an approach that relies upon pre-determined dietary standards against which, each participant is evaluated [4], [5], [8]. Cluster and factor analysis have also been used to determine dietary patterns that emerge for a particular study population [3], [7]. However, novel methods that incorporate additional dimensions of data, such as time, are needed for continued advancement in this area. Analysis methodologies inherent to engineering, such as machine learning and pattern recognition, have the capacity to incorporate multiple layers of data and accommodate the complexity needed to generate new understandings of the relationship between diet and health.
The addition of time in particular, to the concept of dietary patterns, yields a new plateau for research that we have termed “temporal dietary patterns”. The temporal dietary patterns presented in this paper incorporate cluster analysis and describe groups of individuals based on their dietary intake over a 24-hour period of time. For the purposes of this research we use energy intake specifically to demonstrate this concept of temporal dietary patterns. The proportion of energy consumed at a particular hour of the day compared with the total energy consumed for the 24-hour day may be used to cluster individuals together. The number of clusters may vary based upon the constraints of the correlation. The hourly mean proportion of energy consumed by each particular cluster may be plotted to visualize differences between the clusters, representing multiple dietary patterns, and can be used to characterize temporal dietary patterns that exist for a 24-hour time period. For example, when participants of one group who exhibit a pattern of high energy consumption in the morning followed by low-energy mid-day and evening consumption, and participants of another group who exhibit a pattern of low-energy morning consumption and greater proportions of energy at mid-day and evening times are contrasted by various nutrient consumptions, one dietary pattern exhibiting a higher overall diet quality may emerge. The goal of the present research was to demonstrate a novel construct of 24-hour temporal dietary patterns for energy intake which are present in a sample of the adult U.S. population 20 years and older.
II. Survey Design and Dataset
A. Survey Design and Study Participants
For the analysis presented in this paper, participants were drawn from the continuous National Health and Nutrition Examination Survey (NHANES) 1999–2004 [11]. NHANES 1999–2000, 2001–2002 and 2003–2004 were cross-sectional surveys continuously conducted by the National Center for Health Statistics (NCHS), a program of the Centers for Disease Control and Prevention [11]. NHANES participants were drawn from and are representative of the non-institutionalized and civilian U.S. population. A complex multistage, probability sampling method was used to select participants on the basis of age, sex, and race-ethnicity. Subpopulations, including: non-Hispanic Black Americans, Mexican Americans, low income White Americans, and individuals over 60 years old; were oversampled to allow for the generation of more precise and reliable estimates for these groups. NHANES participants completed an in-depth questionnaire assessing diet and socioeconomic indicators at their homes and at the NHANES Mobile Examination Center (MEC). A 24-hour dietary recall was also completed [11]. For this analysis, only those individuals with age 20 years or older and with a reliable 24-hour dietary recall were considered. There were 7,565 such participants included to estimate temporal dietary patterns.
B. Dietary Assessment and Dietary Data
The USDA’s Automated Multiple Pass Method (AMPM) [12] 24-hour dietary recall was completed during the MEC examination. The dietary information was then linked to the USDA Food and Nutrient Database for Dietary Studies (FNDDS) [13], a nutrient composition database. The AMPM computerized software system allows for direct coding of the reported foods, data editing and management, and nutrient analysis of dietary data [12].
III. Temporal Dietary Patterns Estimation
The NHANES dataset contains information about all the food items, a respondent consumed (or reported to consume) during a 24-hour period [11]. For each food item, time of eating was reported in minutes. Also, since FNDDS foodcodes [14], [13] were available for each of the food items reported by the respondents, the information about different nutrients was known. For each participant, the total amount of different nutrients consumed during each eating event or a 24-hour period was estimated by summing the contributions from each food item consumed. Further, using the time of different eating occasions, the amount of different nutrients consumed during a certain period of time was estimated. When the amount of nutrient consumed during a defined period of time was divided by the total amount of nutrient consumed for that day, the resulting fraction provided an estimate of the proportional nutrient consumed during the specified time.
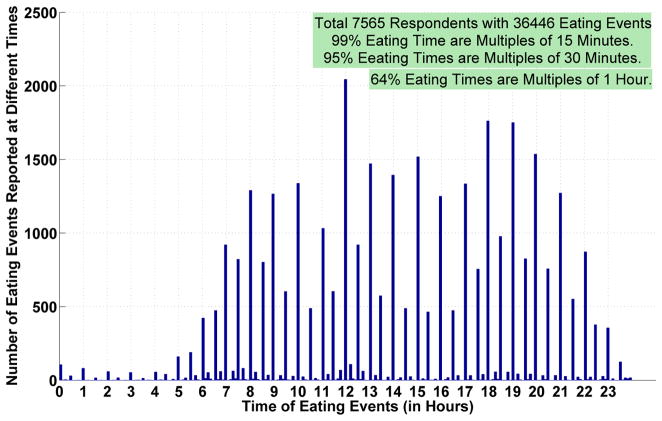
The first step in estimating temporal dietary patterns was to identify a natural quantization of time variable. Figure 1 shows the distribution 36,446 eating events reported by 7,565 participants, by time in a 24-hour period. Sixty four percent of the reported times of eating events occurred at hourly positions, that is, 0, 1, 2, …, 23 hours. Similarly, 95% of the reported times of eating events occured at half-hourly positions, that is 0, 0.5, 1, ...., 23 and 23.5 hours. Even though the NHANES data contains time of eating reported in minutes, most of the people reported their time of eating, rounded to a 60 minutes quantization (may be due to zero end-digit preference). Other time instances such as 31 minutes, are also reported in the data but their occurrence is very rare. Hence, for this study, we used an hourly quantization of time of eating. Each participant was associated with a 24-dimensional feature vector describing his or her diet during a 24-hour period.
Fig. 1.
Number of Eating Events During Different Time Intervals (for Eating Times Reported in Minutes).
Let
A(r, fc, t) = amount of food fc (represented by the associated food code from the FNDDS) consumed by respondent r, at time t.
E(r, fc, t) = energy (kcal), contributed by the food fc consumed by the respondent r, at time t.
F C(r, t) = set of all the food items consumed by the respondent r, at time t.
E(r, t) = total energy (kcal) intake for the respondent r, at time t (as contributed by all the food items consumed at time t).
fr(r, t) = fraction (as compared to the total intake of energy during a day) of energy intake by the respondent r, at time t.
T = Set of all times of eating events (after quantization) {0, 1, …, 23}.
The first two quantities in the above list A(r, fc, t) and E(r, fc, t) were present in the database. All other quantities were estimated using the following equations:
| (1) |
| (2) |
| (3) |
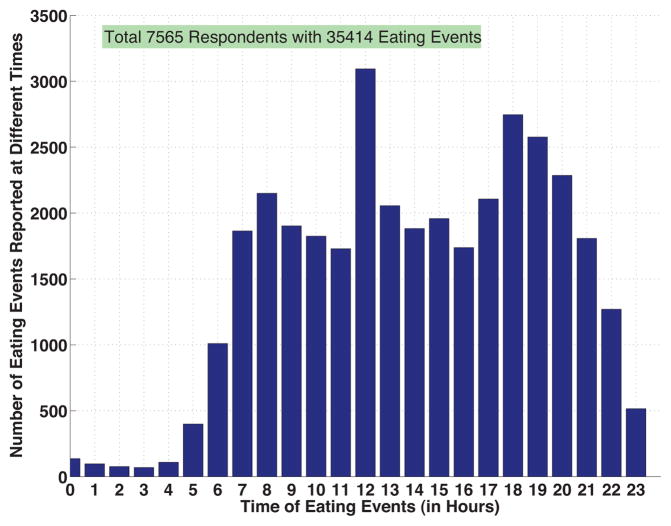
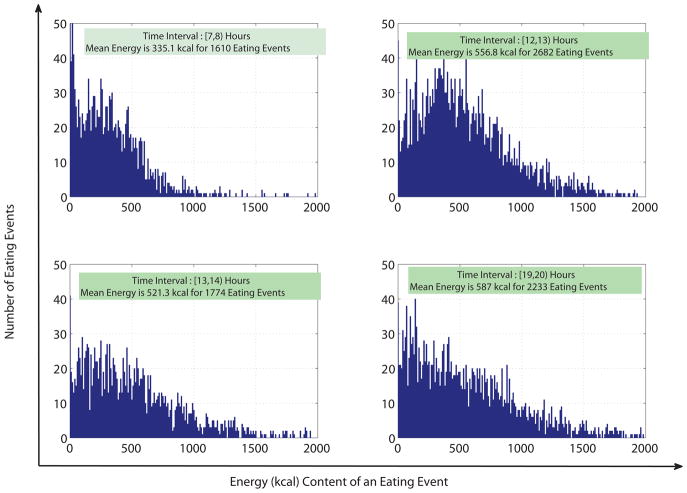
Figure 2 shows the number of eating events or the number of people eating during different time intervals. Excluding the early morning times, eating events are almost equally distributed during different hours of the day. Eating times differ from person to person and their effect on diet quality should be analyzed in detail. The eating events at different times of the day were evaluated next to determine differences with regard to energy content. Figure 3 shows the distribution of energy content (kcal) of eating events reported during four different time intervals from morning, afternoon and evening. The mean energy content of eating events during these time intervals differed from each other; eating events in the morning had less energy compared with the eating events during mid-day and 7pm to 8pm. Also, generally within a particular time interval, energy content of the eating events had a wide distribution. Hence, there may exist different clusters based on the energy content and the time of the eating event.
Fig. 2.
Number of Eating Events During Different Time Intervals (for Eating Times Quantized to Hours)1.
Fig. 3.
Distribution of Energy for Eating Events During Different Time Intervals (for 7565 Respondents).
IV. Clustering
Each person was associated with a 24-dimensional feature vector fr(r, 0), …, fr(r, 23), as defined in Equation 3. These feature vectors can be seen as sparse signals of unequal length which may lack alignment due to different waking times for different people (differing origins on the time scale). The number of eating events in a day is generally between 3 and 5. Thus, these sparse signals generally have 3 to 5 non-zero elements in signals of length 24. For dietary pattern estimation, clustering can be performed on these features in a number of ways by using a suitable distance metric such as Euclidean distance and clustering algorithms such as k-means.
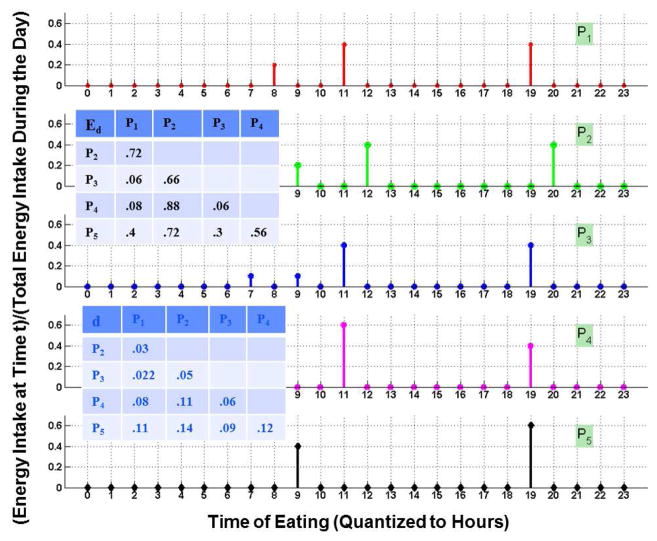
The most straightforward method was to use the 24-dimensional feature vectors as defined in Equation 3, with Euclidean distance and k-means clustering, ideal case when eating times of different participants matched with each other. However, this was not true for the data used in this analysis. This simple application of k-means clustering tended to cluster together people eating at the same time without capturing the effect of variation in the energy consumed at different times. Figure 4 shows sample intake patterns for five individuals and the Euclidean distances (Ed) between feature vectors fr(ri, .), i = 1, 2, 3, 4, 5 that were associated with these individuals. The distance between person 1 and person 2 is 0.72 while the distance between person 1 and person 4 is 0.08, but the eating pattern for person 1 is closer to person 2 than to person 4. The eating pattern for person 2 is a one hour delayed version (may be due to different wake up times) of the eating pattern of person 1. Both of them consume the same energy at breakfast, lunch, and dinner. In contrast, the eating pattern of person 4 is quite different from person 1. Person 4 does not have a morning eating event while person 1 obtains 20% of his/her energy from the morning eating event. Hence, Figure 4 clearly depicts the limitations of using Euclidean distance with fr(ri, .).
Fig. 4.
Limitation of Euclidean Distance with fr(ri, .).
A. Kernel k-means
A custom distance function, similar to the concept of dynamic time warping (DTW) [15] distance used in speech recognition, can be used to accommodate differences in wake up time, time of eating, and the number of eating events for different people. Dynamic time warping distance is a generalization of classical algorithms for comparing discrete sequences to sequences of continuous values [16]. For two time series signals, DTW aligns the two series so that their difference is minimized. It defines a n × m matrix where the (i, j) element of the matrix contains the distance between ith point of first series and jth point of the second series. Most of the DTW techniques use Euclidean distance. DTW algorithms search for a warping path with minimum distance that satisfies three constraints: boundary condition, continuity, and monotonicity. The boundary condition constraint requires the warping path to start and finish in diagonally opposite corner cells of the matrix. The continuity constraint restricts the allowable steps to adjacent cells. The monotonicity constraint forces the points in the warping path to be monotonically spaced in time [16]. In our application, an eating event of one person is allowed to match with the “zero-eating event” of another person, or when that person does not consume energy. Thus, the monotonicity constraint takes a different form (Equation 5).
An eating event is characterized by the tuple (t, v), where t denotes the time of eating and v denotes the value of certain features associated with the eating event. In the present work, the value v represents the ratio of energy (kcal) intake during a certain eating event to the total energy intake during the day. Thus, t takes values from the set [0, 1, 2, …, 23] and v takes values from the set [0, 1]. This distance between two eating events m1 = (t1, v1) and m2 = (t2, v2) is defined as,
| (4) |
where α determines the rate of increase of the effect of difference in time of the eating events. A record of all the eating events during a 24-hour period, referred as “24-hour diets”, can be represented as a collection of eating events , where each eating event is represented by a (time, value) tuple. Then, the distance between two “24-hour diets”, D1 and D2, is defined as,
| (5) |
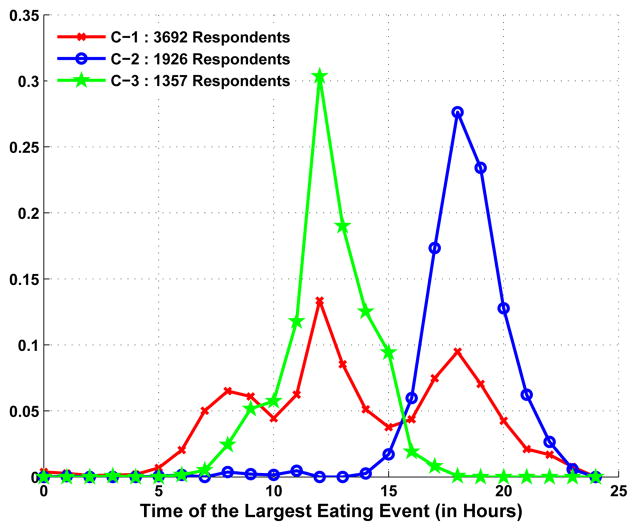
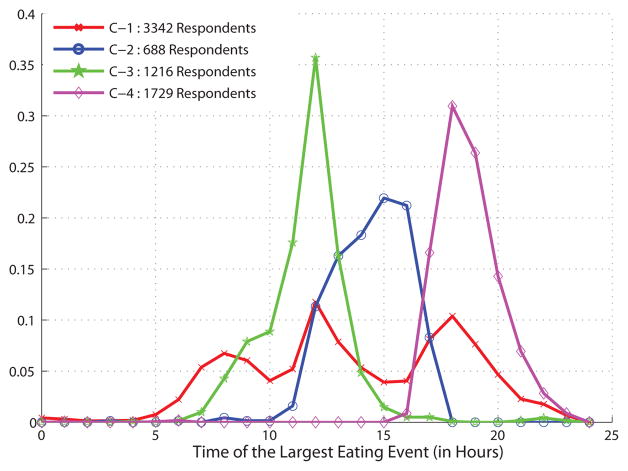
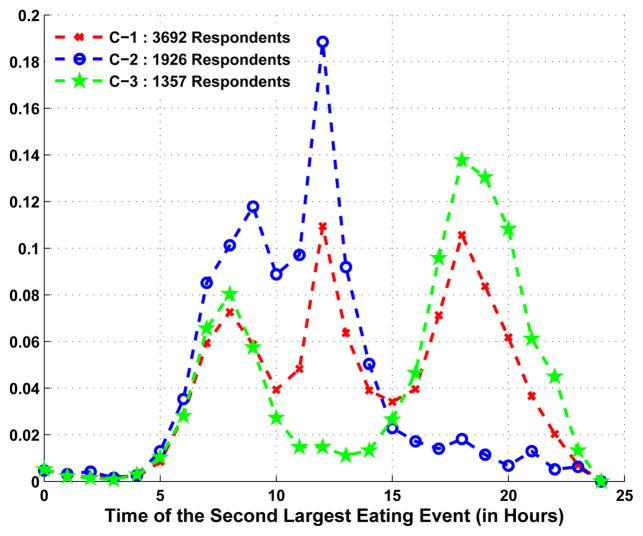
Using this distance function in the kernel k-means [17], clusters are obtained for k = 3 and 4. Figure 5 and Figure 6 show the distribution of time of the largest eating event for people in different clusters. Similarly, Figure 7 show the distribution of the time of the second largest eating event for the people in different clusters. These figures show temporal eating patterns that are commonly known among the population. For example, for k = 3, C − 2 represents the group having a late evening meal as the main meal of the day. The cluster C − 3 represents the group with mid-day as the main meal, while C−1 represents those having no clear main meal with respect to mid-day or evening time. Similar observations can be drawn for the clusters obtained for k = 4.
Fig. 5.
Distribution of Time of Eating of the Largest Eating Events in Different Clusters (for Number of Clusters, k=3).
Fig. 6.
Distribution of Time of Eating of the Largest Eating Events in Different Clusters (for Number of Clusters, k=4).
Fig. 7.
Distribution of Time of Eating of the Second Largest Eating Event in Different Clusters (for Number of Clusters, k=3).
V. Conclusions and Future Work
Temporal dietary patterns exist within the U.S. population. Groups of individuals that consume their energy proportionally similarly throughout the day can be identified by kernel k-means clustering with an appropriate distance metric. Figure 5 and Figure 6 show that these groups differ in the time of their largest eating event (with respect to energy), which might in turn affect the intake of other nutrients and the overall diet quality.
The temporal dietary patterns displayed herein for energy serve as an example of what may be done for nutrients. Nutrients may similarly deviate and present unique patterns. The proportional intake of energy and nutrients may be evaluated and plotted synchronically as an aid for visualizing the interplay of how and when different nutrients were consumed by the various identified clusters of participants. This allows a view of the interplay of nutrient intake; certain proportional nutrient consumption may be at a peak while other nutrient consumption may be at a low during different times throughout the day. This view benefits an overall understanding of the temporal effect of the diet on health. Statistical comparison may identify relationships between patterns of intake and total intake which can be linked with health standards or other health outcomes and may be used to generate public health messages.
The distinctive clusters, identified by k-means for energy intake, documented here may be similar with regards to the consumption of nutrients. However, it may be that individuals comprising a temporal dietary pattern with regard to energy are not cohesive when nutrients are considered. Some temporal dietary patterns may be more stable than others or, may comprise more similar groups of individuals compared with the individuals comprising other dietary patterns. These questions are left for future studies. Temporal dietary patterns are a rich area for continued research that may hold promising answers to a multitude of questions. Individuals comprising certain temporal dietary patterns may have other similarities with regards to health and long-term disease. The novel methodology described in this paper is a first step in illuminating previously illusive links of time of eating to the diet-health relationship.
Acknowledgments
This material is based upon work supported by the the National Cancer Institute under contract. Any opinions, findings, and conclusions or recommendations expressed in this material are those of the author(s) and do not necessarily reflect the views of the the National Institutes of Health.
Footnotes
Note that the total number of eating events reported in Figure 2 is less than the total number of eating events reported in Figure 1. When a larger quantization size is used for quantizing time of eating, some of the eating events are combined and hence there is a reduction in total number of eating events. For example, with the time quantized to minutes, two foods reported at 10:15am and 10:30am are counted as two separate eating events. While with time quantized to hours, these two are counted as a single meal.
References
- 1.McCrory MA, Campbell WW. Effects of eating frequency, snacking, and breakfast skipping on energy regulation: Symposium overview. The Journal of Nutrition. 2011;141(1):144–147. doi: 10.3945/jn.109.114918. [DOI] [PubMed] [Google Scholar]
- 2.Leidy HJ, Armstrong CL, Tang M, Mattes RD, Campbell WW. The influence of higher protein intake and greater eating frequency on appetite control in overweight and obese men. The Journal of Obesity. 2010;18(9):1725–1732. doi: 10.1038/oby.2010.45. [DOI] [PMC free article] [PubMed] [Google Scholar]
- 3.Flood A, Rastogi T, Wirflt E, Mitrou PN, Reedy J, Subar AF, Kipnis V, Mouw T, Hollenbeck AR, Leitzmann M, Schatzkin A. Dietary patterns as identified by factor analysis and colorectal cancer among middle-aged Americans. The American Journal of Clinical Nutrition. 2008;88(1):176–184. doi: 10.1093/ajcn/88.1.176. [DOI] [PMC free article] [PubMed] [Google Scholar]
- 4.Mitrou PN, Kipnis V, Thiebaut ACM, Reedy J, Subar AF, Wirfalt E, Flood A, Mouw T, Hollenbeck AR, Leitzmann MF, Schatzkin A. Mediterranean Dietary Pattern and Prediction of All-Cause Mortality in a US Population: Results From the NIH-AARP Diet and Health Study. Archives of Internal Medicine. 2007;167(22):2461–2468. doi: 10.1001/archinte.167.22.2461. [DOI] [PubMed] [Google Scholar]
- 5.Reedy J, Mitrou PN, Krebs-Smith SM, Wirflt E, Flood A, Kipnis V, Leitzmann M, Mouw T, Hollenbeck A, Schatzkin A, Subar AF. Index-based dietary patterns and risk of colorectal cancer. American Journal of Epidemiology. 2008;168(1):38–48. doi: 10.1093/aje/kwn097. [DOI] [PMC free article] [PubMed] [Google Scholar]
- 6.Reedy J, Wirflt E, Flood A, Mitrou PN, Krebs-Smith SM, Kipnis V, Midthune D, Leitzmann M, Hollenbeck A, Schatzkin A, Subar AF. Comparing 3 dietary pattern methods - cluster analysis, factor analysis, and index analysis - with colorectal cancer risk. American Journal of Epidemiology. 2010;171(4):479–87. doi: 10.1093/aje/kwp393. [DOI] [PMC free article] [PubMed] [Google Scholar]
- 7.Wirflt E, Midthune D, Reedy J, Mitrou P, Flood A, Subar AF, Leitzmann M, Mouw T, Hollenbeck AR, Schatzkin A, Kipnis V. Associations between food patterns defined by cluster analysis and colorectal cancer incidence in the NIH-AARP diet and health study. European Journal of Clinical Nutrition. 2009;63:707–717. doi: 10.1038/ejcn.2008.40. [DOI] [PMC free article] [PubMed] [Google Scholar]
- 8.Jiao L, Mitrou PN, Reedy J, Graubard BI, Hollenbeck AR, Schatzkin A, Stolzenberg-Solomon R. A combined healthy lifestyle score and risk of pancreatic cancer in a large cohort study. Archives of Internal Medicine. 2009;169(8):764–770. doi: 10.1001/archinternmed.2009.46. [DOI] [PMC free article] [PubMed] [Google Scholar]
- 9.Newby PK, Tucker KL. Empirically derived eating patterns using factor or cluster analysis: A review. Nutrition Reviews. 2004;62(5):177–203. doi: 10.1301/nr.2004.may.177-203. [DOI] [PubMed] [Google Scholar]
- 10.Jacobs DR, Steffen LM. Nutrients, foods, and dietary patterns as exposures in research: a framework for food synergy. The American Journal of Clinical Nutrition. 2003;78(3):508S–513S. doi: 10.1093/ajcn/78.3.508S. [DOI] [PubMed] [Google Scholar]
- 11.National Health and Nutrition Examination Survey [Online] 2011 Jan; Available: http://www.cdc.gov/nchs/nhanes.htm.
- 12.Agricultural Research Service. USDA automated multiple-pass method [Online] 2010 Sep; Available: http://www.ars.usda.gov/Services/docs.htm?docid=7711.
- 13.Raper N, Perloff B, Ingwersen L, Steinfeldt L, Anand J. An overview of USDA’s Dietary Intake Data System. Journal of Food Composition and Analysis. 2004;17(3–4):545–555. [Google Scholar]
- 14.United States Department of Agriculture, Report of the Dietary Guidelines Advisory Committee on the Dietary Guidelines for Americans [Online] 2010 Nov; Available: http://www.cnpp.usda.gov/DGAs2010-DGACReport.htm.
- 15.Sakoe H. Dynamic programming algorithm optimization for spoken word recognition. IEEE Transactions on Acoustics, Speech, and Signal Processing. 1978;26:43–49. [Google Scholar]
- 16.Liao TW. Clustering of time series dataa survey. Pattern Recognition. 2005;38:1857–1874. [Google Scholar]
- 17.Dhillon IS, Guan Y, Kulis B. Kernel k-means: spectral clustering and normalized cuts. Proceedings of the tenth ACM SIGKDD international conference on Knowledge discovery and data mining; New York, USA: ACM; 2004. pp. 551–556. [Google Scholar]


