ABSTRACT
BACKGROUND:
Dynamic contrast-enhanced magnetic resonance imaging (DCE-MRI) and diffusion-weighted imaging (DWI) are often used to detect the early response of solid tumors to an effective therapy. The early changes in intratumoral physiological parameters measured by DCE-MRI/DWI have been evaluated as surrogate biomarkers allowing a tailored treatment for the individual patient.
METHODS:
Patients with newly diagnosed, biopsy-proven, treatment-naïve gastrointestinal stromal tumor (GIST) or hepatocellular carcinoma (HCC) were enrolled prospectively after institutional review board (IRB)–approved informed consent (5 patients per tumor type). Patients with GIST were treated with sunitinib over 6 weeks. DCE-MRI/DWI was applied before therapy (baseline imaging) and at 2 and 6 weeks after therapy initiation. Patients with HCC were treated with radiation during the first 2 weeks and then with sorafenib for the next 6 weeks. DCE-MRI/DWI was applied in all patients with HCC before and after radiation therapy and at the end of sorafenib therapy. Tumor volume, perfusion parameters (Ktrans, the forward volume-transfer constant, and kep, the reverse reflux-rate constant) and the apparent diffusion coefficient (ADC) were measured.
RESULTS:
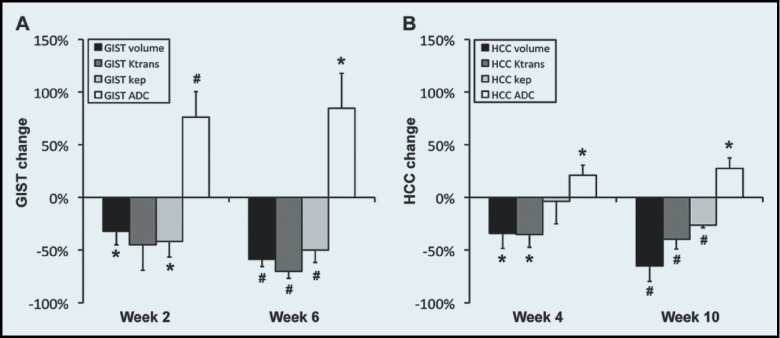
During 2 weeks of sunitinib therapy, GIST volume, Ktrans, and kep decreased 32 ± 13, 45 ± 24, and 42 ± 15%, respectively, whereas ADC increased 76 ± 24%. After 6 weeks of sunitinib therapy, GIST volume, Ktrans, and kep decreased 56 ± 7, 70 ± 7, and 50 ± 12%, respectively, whereas ADC increased 85 ± 33%. After completion of radiation therapy, HCC volume, Ktrans, and kep decreased 34 ± 14, 35 ± 12, and 4 ± 21%, respectively, but ADC increased 21 ± 9%. During the entire 10-week therapeutic period, HCC volume, Ktrans, and kep decreased 65 ± 15, 40 ± 9, and 26 ± 2%, respectively, whereas ADC increased 28 ± 10%.
CONCLUSION:
DCE-MRI/DWI can measure the perfusion and diffusion changes in GISTs or HCCs treated with multikinase inhibitors.
Cancer therapy has been moving swiftly from nonspecific chemotherapeutic intervention to a more individualized approach using biologic agents against specific tumor molecular mutations. Imaging modalities have long been used to evaluate tumor response to chemotherapy.1–3 Standard imaging occurs at 3-month intervals to determine therapeutic efficacy, typically using 2-dimensional (linear)-based RECIST (response evaluation criteria in solid tumors).4 This interval can be a significant amount of time, in which a patient may be receiving an ineffective treatment intervention. This problem is even more of an issue with newer biologic agents. If the treating clinician can assess tumor response at an earlier time point and with measures that may reflect changes in vascularity or cellular response, it may allow for a more individualized approach in the pursuit of the best treatment.
Biologic therapy has moved to the forefront in the treatment of gastrointestinal stromal tumors (GISTs) and hepatocellular carcinomas (HCCs).5,6 Both of these tumors typically remain stable in size during early therapy, and therefore imaging evaluation based on tumor dimension does not always provide useful clinical information. In this situation, novel or alternative imaging modalities may be advantageous in assessing a treatment. Recent improvements in magnetic resonance imaging (MRI) technology have allowed the advancement of 2 different types of functional studies to evaluate tumor response: diffusion-weighted imaging (DWI) and dynamic contrast-enhanced MRI (DCE-MRI). DWI involves a diffusion pulse sequence that is sensitive to small-scale motion of water protons, quantified by the measurement of the apparent diffusion coefficient (ADC).7 Rather than rely on simple qualitative assessment (visual detection), however, the quantitative ADC measured within a tumor is more important, as the cellular structure is indicative of tumor aggressiveness. DCE-MRI can be used to investigate vascular properties of tissue by quantifying the transfer of an MR contrast agent from the vascular space to the extravascular–extracellular space over time8; thus, its use to assess the effects of antiangiogenic agents on tumors and ultimately on patient outcomes is of interest.
The goal of this study was to assess the early response of GISTs to sunitinib and HCCs to sorafenib after radiation with DWI and DCE-MRI. The agents are multikinase inhibitors that induce both apoptosis and antiangiogenesis,9–11 which can be detected by DWI and DCE-MRI, respectively. In the early phase of apoptosis, apoptotic volume decrease (AVD) occurs, leading to an increase in extracellular water molecules, and therefore the tumor ADC increases. DWI has been used clinically to monitor the therapeutic responses of GISTs and HCCs.12–15 Ktrans (forward volume-transfer constant) and kep (reverse reflux-rate constant), both DCE-MRI biomarkers, represent the washin and washout rates of an MR contrast agent, respectively, and have been used to assess tumor vascularity.16 The application of DCE-MRI for intra-abdominal cancers has been limited by motion, but substantial success has recently been achieved in patients with advanced HCCs17–19 or liver metastases arising from gastric carcinomas.20 In the present study, respiratory-gating DWI and breath-hold DCE-MRI were performed at 3 T in patients with GIST or HCC, and the changes in the physiologic parameters (Ktrans, kep, and ADC) of the tumors were quantitatively monitored during therapy.
MATERIALS AND METHODS
This prospective pilot study received approval from the institutional review board of our medical center. All subjects signed informed consent, and the Health Insurance Portability and Accountability Act was strictly observed.
Patients and Study Design
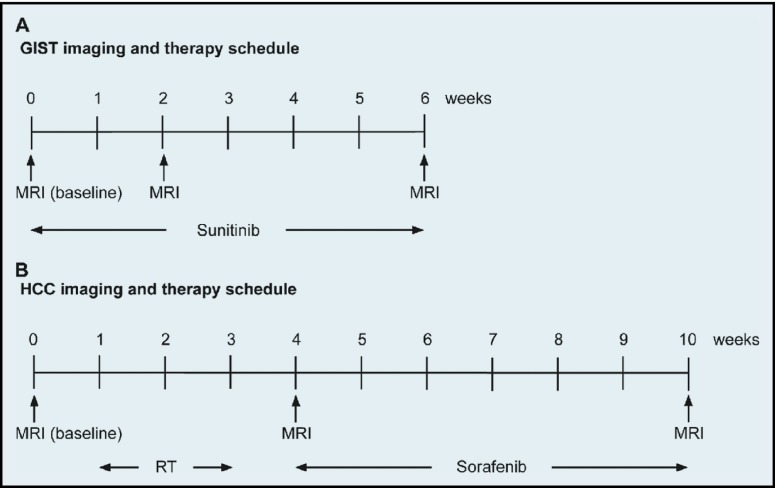
Ten patients with newly diagnosed, biopsy-proven GISTs or HCCs were accrued (n = 5 per tumor type) consecutively for 18 months. The GIST group comprised 2 men and 3 women with a mean age of 62 years; liver metastases were found in 2 of the patients. The HCC group comprised 3 men and 2 women with a mean age of 57 years, with no metastases in other organs. Sunitinib (Sutent; Pfizer, New York, NY) was given to patients with marginally resectable GISTs at 37.5 mg as an oral daily dose for 6 weeks. In these patients, MRI was performed before initiation of therapy (baseline imaging) and at 2 and 6 weeks after initiation. HCC patients first received radiation therapy in an individualized dose prescription in 6 fractions completed within 2 weeks (dose, 40.5–54.0 Gy), followed by sorafenib (Nexavar; Bayer, Leverkusen, Germany) given by mouth at 400 mg for 1 week, increased to 400 mg twice a day for the next 5 weeks. In these patients, MRI was performed before radiation therapy (baseline imaging), at approximately 1 week after completion of radiation therapy, and after completion of sorafenib therapy. Figure 1 illustrates the timelines of imaging and therapy schedules for the GIST and HCC patients.
Figure 1.
Imaging and therapy schedules. Timeline of physiological MRI before (baseline) and after initiation of therapy in patients with (A) GIST or (B) HCC.
MR Protocol
All subjects were examined on a single 3-T clinical MR system (Philips Achieva; Philips Medical Systems, Best, The Netherlands) equipped with a torso phased array coil. Routine anatomic upper-abdominal MRI included localizers; respiratory-triggered, turbo spin echo (TSE), fat-suppressed images through the upper abdomen and T1-weighted, 3-dimensional (3-D), spoiled gradient echo (GRE), fat-suppressed, breath-hold images at end inspiration. Respiratory-gating, DW, single-shot, echo-planar imaging (DW-SS-EPI) was performed with 3 b values of 0, 50, and 700 s/mm2 in 1 direction with the following parameters: repetition time/echo time (TR/TE) = 1586/55 ms; field of view (FOV) = 42 × 42 cm; number of excitations (NEX) = 4, ; thickness/gap = 7/1 mm; matrix size = 140/140 (interpolated to 288/288); and number of slices = 30–40. DCE-MR images were obtained by a breath-hold, 3-D, fast-field echo, T1-weighted axial sequence with the following parameters: TR/TE = 5/2.3 ms; FOV = 40 × 40 cm; NEX = 1; thickness/gap = 6/0 mm; matrix = 192/154 (interpolated to 256 × 256); flip angle = 15°; and sensitivity encoding (SENSE) factor = 2. A total of 10 slices covering the central region of a tumor were obtained at each time point (longitudinal FOV, 6 cm), and 91–120 images per slice were continuously acquired, with a temporal resolution of 2.1 seconds after intravenous injection of 0.1 mmol/kg of gadoteridol (Bracco Diagnostics Inc., Princeton, NJ) followed by a 20-mL saline flush at the rate of 2 mL/s. During DCE-MRI, the patients were instructed to perform breath-hold during maximum end inspiration for as long as possible, and then to repeat similar breath-holds as feasible for the duration of the acquisition. T1 maps were created before contrast injection using T1W images obtained with the same imaging sequence and parameters as listed above, but with three different flip angles (5°, 10°, and 15°).
Image Analysis
For correcting motion in DCE-MR images, three image-processing techniques were used: unwarping, median filtering, and curve fitting. For unwarping, the boundary of a patient's body above the paravertebral muscle and abdominal aorta was determined in each DCE-MR image. Then, the boundary in each DCE-MR image was unwarped to match the boundary in the baseline image (acquired before gadoteridol injection), and all pixels within the boundary were relocated accordingly. Thereafter, median filtering and curve fitting were applied. Assuming that patients were able to perform breath-holds for at least 20 seconds after initiation of the gadoteridol injection, median filtering and curve fitting were applied for the signal curve of each pixel from 20 seconds after initiation of gadoteridol injection; 1-dimensional median filtering (window: 5) was applied first, and then the best-fit 5th-order polynomial curve was determined. T1 maps were also unwarped as described above and coregistered with DCE-MR images.
A 2-compartment pharmacokinetic model was used to calculate the volume transfer constant (Ktrans) and the reverse reflux rate constant (kep). The modified general rate equation in a 2-compartment model is,
where CT(t), Cp(t), and vp represent contrast concentration in tissue (T) at t time, contrast concentration in blood plasma (p) at t time, and fraction occupied by blood plasma, respectively. Cp(t), also known as arterial input function (AIF), was obtained by measuring the change in gadoteridol concentration within the abdominal aorta after motion correction. Relaxivity of gadoteridol at 3 T was estimated to 3.09 s−1 mM−1, as previously reported.21 Two-dimensional median filtering (window: 3 × 3) was applied to the Ktrans and kep maps, to suppress noise.
In DWI analysis, the ADC value was calculated by finding the best fitting curve to the equation, S = S0−bD, where S is the intensity of the DW images, S0 is a constant, and D is the ADC. Two-dimensional median filtering (window: 3 × 3) was also applied to the ADC maps.
Tumor regions were determined based on both the morphologic and physiological (perfusion/diffusion) features by a board-certified radiologist specializing in abdominal imaging for 18 years. Tumor volume was determined as the total number of voxels multiplied by a unit voxel size (including gap) in DW images obtained with the highest b value. The final ADC of a tumor was obtained by averaging all ADCs in the entire tumor region, whereas the final Ktrans and kep were obtained by averaging those values in the tumor region of an image slice that crossed the midsection of the tumor. The segmentation of the tumor regions was performed with ImageJ, version 1.47n (National Institutes of Health, Bethesda, MD). The motion correction in DCE-MR images and the quantification of physiological parameters were implemented with computer software developed with Labview, version 2010 (National Instruments Co., Austin, TX).
Statistical analysis
One-way ANOVA (analysis of variance) was performed to determine the significant changes in tumor volume, Ktrans, kep, and ADC during therapy.22 Multivariate Pearson correlation coefficients were calculated, to examine the correlation between the changes of the physiological parameters (Ktrans, kep, and ADC) in tumors and the change in tumor volume.23 P ≤ 0.05 was considered significant, and data were presented as the mean ± SE. All analyses were performed with SAS, version 9.2 (SAS Institute Inc., Cary, NC).
RESULTS
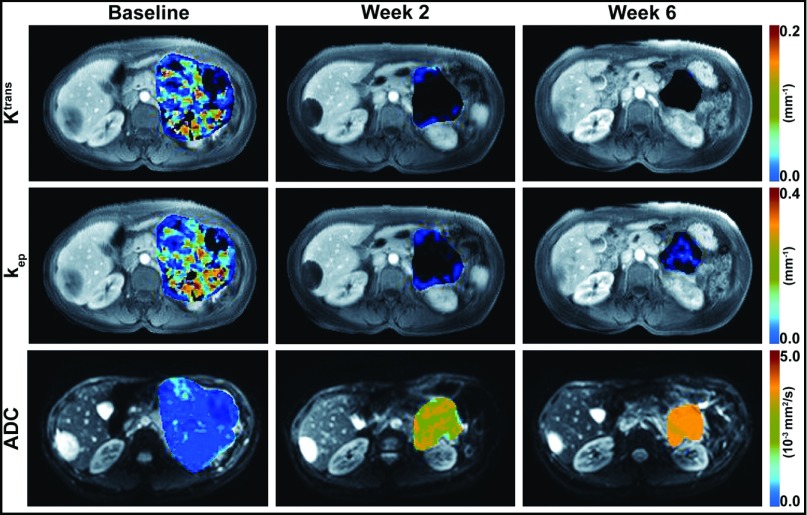
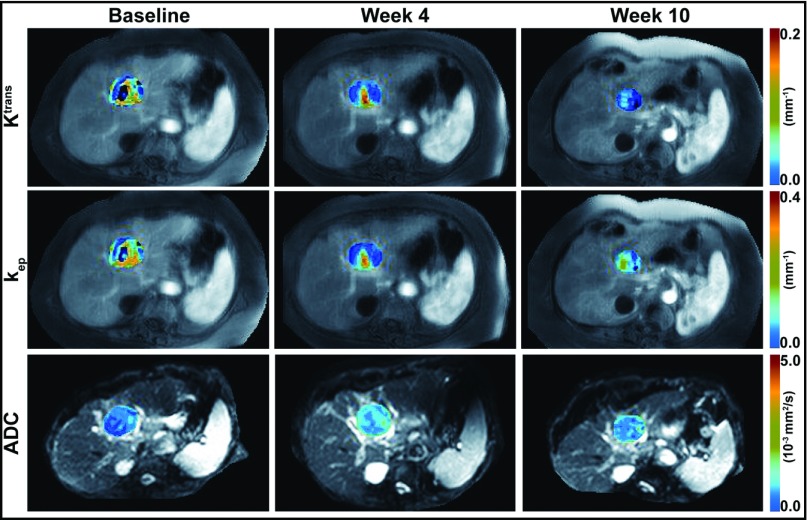
All patients were able to follow the breath-hold DCE-MRI protocol adequately. Figures 2 and 3 show motion-corrected DCE-MR images (grayscale) of a 48-year-old woman with a GIST and a 77-year-old woman with an HCC, respectively, at 30 seconds after initiation of the gadoteridol injection, with Ktrans and kep maps (color scale) superimposed on the tumor regions and DW images (b = 0, grayscale) with superimposed tumor ADC maps (color scale). The same color scale was applied for the 3 maps of each physiological parameter (Ktrans, kep, or ADC) acquired before (baseline) and after initiation of therapy.
Figure 2.
DW/DCE-MR images with physiological parametric maps of a GIST in a 48-year-old woman. Motion-corrected DCE-MR images at 30 seconds after gadoteridol injection with superimposed tumor Ktrans (first row) and kep (second row) maps before (baseline) and at 2 and 6 weeks after initiation of sunitinib therapy. DW images obtained with a b value of 0 s/mm2, with superimposed tumor ADC maps (third row) before (baseline) and at 2 and 6 weeks after initiation of sunitinib therapy. The same color scale was applied for the 3 maps in each row.
Figure 3.
DW/DCE-MR images with physiological parametric maps of an HCC in a 77-year-old woman. Motion-corrected DCE-MR images at 30 seconds after gadoteridol injection with superimposed tumor Ktrans (first row) and kep (second row) maps before therapy (baseline), after completion of radiation therapy (week 4), and after completion of sorafenib therapy (week 10). DW images obtained with a b value of 0 s/mm2, with superimposed tumor ADC maps (third row) before therapy (baseline), after completion of radiation therapy (week 4), and after completion of sorafenib therapy (week 10). The same color scale was applied for the 3 maps in each row.
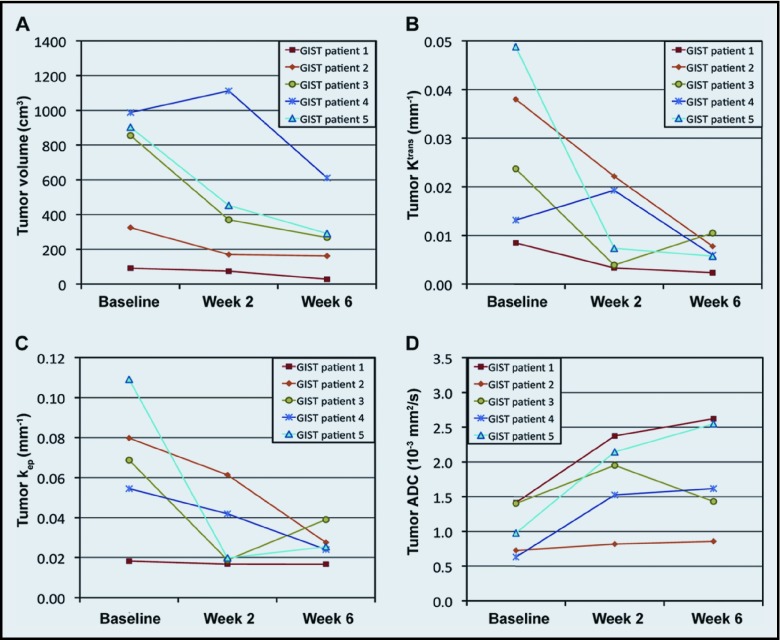
Figure 4 demonstrates the tumor volume, Ktrans, kep, and ADC of the 5 patients with GIST during sunitinib therapy. The initial GIST volume was 632 ± 178 cm3 (mean ± SE), but decreased to 436 ± 182 and 272 ± 97 cm3 after weeks 2 and 6 of sunitinib therapy, respectively. The mean Ktrans was 0.026 ± 0.008, 0.011 ± 0.004, and 0.006 ± 0.001 min−1 at 0 (baseline), 2, and 6 weeks after initiation therapy, respectively, whereas the mean kep was 0.066 ± 0.015, 0.032 ± 0.009, and 0.027 ± 0.004 min−1, respectively, during the same periods. The initial mean ADC was 1.03 ± 0.16 × 10⁻³ mm2/s, but increased to 1.76 ± 0.27 and 1.82 ± 0.34 × 10⁻³ mm2/s after weeks 2 and 6 of therapy, respectively. The coefficients of variation (CVs) of tumor Ktrans and kep before therapy initiation were 0.64 and 0.51, respectively, whereas that of tumor ADC was only 0.36.
Figure 4.
Response of GISTs after sunitinib therapy. Tumor (A) volume, (B) Ktrans, (C) kep, and (D) ADC in 5 patients with GIST during 6 weeks of sunitinib therapy.
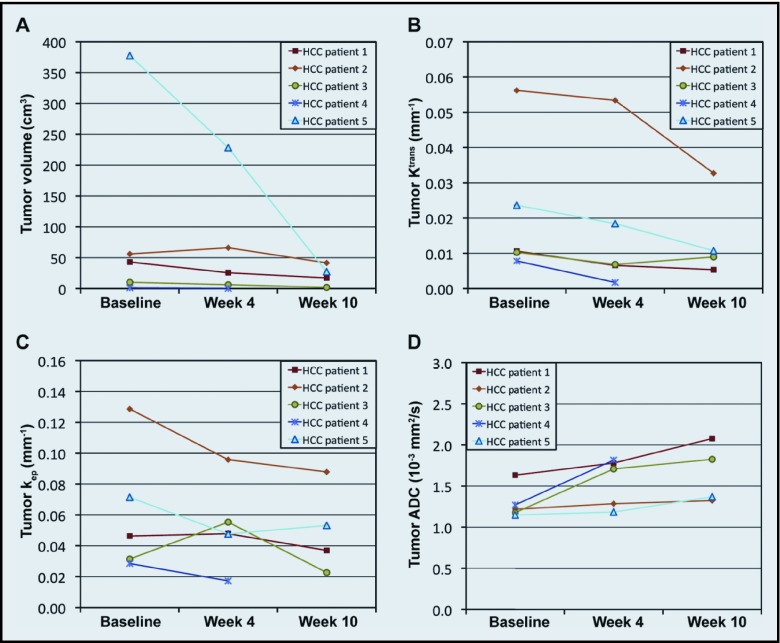
Figure 5 shows the tumor volume, Ktrans, kep, and ADC of the 5 patients with HCC over 10 weeks of sequential radiation and sorafenib therapy. At the end of sorafenib therapy (week 10), the tumor physiology of patient 4 could not be analyzed because the tumor was too small. The initial mean tumor volume, Ktrans, kep, and ADC were 98 ± 71 cm3, 0.022 ± 0.009 min−1, 0.062 ± 0.018 min−1, and 1.29 ± 0.09 × 10⁻³ mm2/s, respectively. The initial tumor volumes of the HCCs were significantly smaller than those of the GISTs (P = .02), but the initial physiological parameters were not different between the 2 tumor types (P > .05). After completion of radiation therapy (week 4), the averaged tumor volume, Ktrans, kep, and ADC were 65 ± 42 cm3, 0.017 ± 0.009 min−1, 0.053 ± 0.013 min−1, and 1.55 ± 0.13 × 10⁻³ mm2/s, respectively, and, after completion of sorafenib therapy (week 10), values were 22 ± 8 cm3, 0.014 ± 0.006 min−1, 0.050 ± 0.014 min−1, and 1.65 ± 0.18 × 10⁻³ mm2/s, respectively.
Figure 5.
Response of HCCs after sequential combination therapy with radiation and sorafenib. Tumor (A) volume, (B) Ktrans, (C) kep, and (D) ADC in 5 patients with HCC during 10 weeks of radiation and sorafenib therapies.
Figure 6 shows the changes (%) in the GIST and HCC variables (volume, Ktrans, kep, and ADC) after therapy, relative to the baseline values. The mean tumor size decreased about the same amount, regardless of tumor type during the entire therapeutic period (−59% vs. −65%), but the vascularity decrease observed in the GISTs was about 2-fold higher than that of the HCCs (Ktrans: −70% vs. −40%; kep: −50% vs. −26%). The ADC increase observed for GISTs was 3-fold higher (85% vs. 28%). Table 1 summarizes the correlation between the tumor volume change and the changes in the tumor physiological parameters (Ktrans, kep, and ADC) in the patients with GIST. The tumor Ktrans change for 2 weeks of sunitinib therapy correlated significantly with the tumor volume change during either 2 or 6 weeks (P ≤ .05), whereas no correlation was detected between the changes in tumor volume, kep, or ADC. Table 2 summarizes the correlation between the changes in tumor volume and physiological parameters in the patients with HCC. Significant correlation was found only between the change in tumor volume and Ktrans after radiation therapy (P = .05).
Figure 6.
Change in tumor volume and physiological parameters after therapy. The change (%) in tumor volume, Ktrans, kep, and ADC in (A) GISTs or (B) HCCs during therapy, when the initial values are normalized to 0%. *P ≤ .05; #P ≤ .01.
Table 1.
Coefficients (r) for the correlation between the changes in GIST volume and physiological parameters
| GIST | Ktrans change | kep change | ADC change | ||||
|---|---|---|---|---|---|---|---|
| Week 2 | Week 6 | Week 2 | Week 6 | Week 2 | Week 6 | ||
| Volume change | Week 2 | 0.88 (.05) | 0.45 (.44) | 0.64 (.24) | 0.28 (.65) | 0.63 (.25) | 0.57 (.31) |
| Week 6 | 0.93 (.02) | 0.34 (.57) | 0.46 (.43) | −0.35 (.57) | 0.29 (.63) | 0.25 (.69) | |
P values are shown in parentheses.
Table 2.
Coefficients (r) for the correlation between the changes in HCC volume and physiological parameters
| HCC | Ktrans change | kep change | ADC change | ||||
|---|---|---|---|---|---|---|---|
| Week 4 | Week 10 | Week 4 | Week 10 | Week 4 | Week 10 | ||
| Volume change | Week 4 | 0.88 (.05) | −0.07 (.93) | −0.03 (.97) | −0.76 (.24) | −0.57 (.31) | −0.63 (.37) |
| Week 10 | 0.60 (.40) | −0.10 (.90) | −0.30 (.70) | −0.42 (.58) | −0.33 (.67) | −0.55 (.45) | |
P values are shown in parentheses.
DISCUSSION
To our knowledge, this is the first report of the use of physiological MRI to evaluate sunitinib for GISTs in a neoadjuvant setting. A wide range of both baseline Ktrans and kep of GISTs was observed, and they did not correlate with the initial tumor sizes. The vascularity of a GIST is often heterogeneous, mainly due to cystic degeneration and local necrosis, especially when the tumor is large; therefore, the Ktrans or kep averaged within the entire tumor region may vary widely according to this tumor heterogeneity. On the other hand, the initial tumor ADCs were less variable.
The sequential use of radiation and sorafenib is a therapeutic strategy that has not been evaluated for use with physiological MRI in patients with HCC. DCE-MRI has been applied to evaluate other multikinase inhibitors, such as pazopanib and vandetanib, against HCCs, and a significant decrease of tumor vascularity was noticed in responding patients.18,19 DCE-MRI and DWI have recently been used in combination to measure the pretreatment physiological parameters of HCCs in a series of 21 patients17; the mean tumor ADC in that study was 1.08 ± 0.04 (mean ± SE) × 10−3 mm2/s, comparable with our finding (1.29 ± 0.09 × 10⁻³ mm2/s), but the mean tumor Ktrans was quite different. Ktrans is affected by the physiochemical properties of the contrast agent, such as viscosity and osmolality, as well as its plasma half-life, concentration, and injection rate, and those differences may account for the some of the observed discrepancies. Furthermore, Ktrans can vary according to imaging sequence, imaging parameters, pharmacokinetic models, and quantification methods,24 and it has been reported that several commercially available perfusion-analysis tools yielded significantly different values from the same DCE-MR images.25,26 Therefore, a quantitative change in perfusion parameters may be more predictive of clinical benefits than the initial values, unless DCE-MRI acquisition and post-processing protocols are globally standardized.
Significant correlation was found only between the Ktrans and changes in tumor volume in patients with GIST after sunitinib therapy or in patients with HCC after radiation therapy. Since an antiangiogenic therapy (or radiation) decreases the vessel density, the washin rate represented by Ktrans should be reduced. Either sunitinib or radiation can induce both antiangiogenic and cytotoxic effects27,28; therefore, Ktrans and the volume of tumors sensitive to the treatment would be reduced at the same time; kep, however, represents the washout rate, which is highly affected by the interstitial fluid pressure (IFP) in a tumor. Hypervascular tumors contain dilated, tortuous, and leaky vessels, and as a result have high IFP.29 If an antiangiogenic therapy is used for hypervascular tumors, vascular normalization may occur and may result in reduced blood vessel leakiness and IFP, and thereby the washout rate (kep) should decrease.30 On the other hand, hypovascular and/or hypoperfused tumors have inherently low IFPs, and so the antiangiogenic effect may only minimally lower the pressure, and the reduction of the washout rate may therefore not be as great. The change in tumor kep after antiangiogenic therapy is likely to vary according to the pretreatment physiological status of a tumor. The change in tumor ADC is also affected by the initial tumor status. Extracellular water molecules induced by a decrease in apoptotic volume can be rapidly pushed out of the tumor region when the tumor has a high IFP. Therefore, the change in tumor Ktrans may serve as a more reliable indicator than changes in kep or ADC, when assessing the therapeutic efficacy of multikinase inhibitors or radiation in certain tumors.
In conclusion, quantitative DCE-MRI and DWI were successfully used in patients with GIST or HCC to measure the perfusion and diffusion parameters of tumors. The repetitive end inspiration DCE-MRI acquisition was well tolerated by the patients and necessitated the use of a novel retrospective image-processing method. Significant decreases Ktrans and kep were observed in the GISTs after sunitinib therapy and in the HCCs after sequential combination therapy with radiation and sorafenib, whereas tumor ADCs were significantly increased, most likely reflecting favorable antitumor effects. Ktrans change in the tumors correlated significantly with volume change, and therefore it may serve as an effective surrogate biomarker, especially when applied at earlier time points, to assess the therapeutic efficacy of a multikinase inhibitor, alone or in combination with radiotherapy. The credibility of the data, however, would be strengthened by another study with a larger sample size.
Acknowledgments
The authors thank Dr. Wlad Sobol for study consultation and Ms. Kecia Turner and Ms. Haley Witte for assisting in image acquisition and data transfer.
Footnotes
This study was supported by Pfizer (New York, NY), Genomic Health (Redwood City, CA), Bayer (Leverkusen, Germany), and National Institutes of Health (Bethesda, MD) Grants 2P30CA013148, R01HL092173-01, P60AR048095-07, P30DK056336-10, and P30AI027767-23.
Disclosures of Potential Conflicts of Interest
The authors indicated no potential conflicts of interest.
REFERENCES
- 1. Godoy MC, Bruzzi JF, Viswanathan C, et al. : Multimodality imaging evaluation of esophageal cancer: staging, therapy assessment, and complications. Abdom Imaging 38:974–993, 2013 [DOI] [PubMed] [Google Scholar]
- 2. Kido A, Fujimoto K, Okada T, et al. : Advanced MRI in malignant neoplasms of the uterus. J Magn Reson Imaging 37:249–264, 2013 [DOI] [PubMed] [Google Scholar]
- 3. Kim T, Kang DK, An YS, et al. : Utility of MRI and PET/CT after neoadjuvant chemotherapy in breast cancer patients: correlation with pathological response grading system based on tumor cellularity. Acta Radiol August 20 2013. [Epub ahead of print] [DOI] [PubMed] [Google Scholar]
- 4. Fojo AT, Noonan A: Why RECIST works and why it should stay: counterpoint. Cancer Res 72:5151–5157, 2012 [DOI] [PubMed] [Google Scholar]
- 5. Griffin JM, Amand MS, Demetri GD: Nursing implications of imatinib as molecularly targeted therapy for gastrointestinal stromal tumors. Clin J Oncol Nurs 9:161–169, 2005 [DOI] [PubMed] [Google Scholar]
- 6. Kane RC, Farrell AT, Madabushi R, et al. : Sorafenib for the treatment of unresectable hepatocellular carcinoma. Oncologist 14:95–100, 2007 [DOI] [PubMed] [Google Scholar]
- 7. Turkbey B, Aras O, Karabulut N, et al. : Diffusion-weighted MRI for detecting and monitoring cancer: a review of current applications in body imaging. Diagn Interv Radiol 18:46–59, 2012 [DOI] [PubMed] [Google Scholar]
- 8. O'Connor JP, Jackson A, Parker GJ, et al. : DCE-MRI biomarkers in the clinical evaluation of antiangiogenic and vascular disrupting agents. Br J Cancer 96:189–195, 2007 [DOI] [PMC free article] [PubMed] [Google Scholar]
- 9. Ikezoe T, Yang Y, Nishioka C, et al. : Effect of SU11248 on gastrointestinal stromal tumor-T1 cells: enhancement of growth inhibition via inhibition of 3-kinase/Akt/mammalian target of rapamycin signaling. Cancer Sci 97:945–951, 2006 [DOI] [PMC free article] [PubMed] [Google Scholar]
- 10. Christensen JG: A preclinical review of sunitinib, a multitargeted receptor tyrosine kinase inhibitor with anti-angiogenic and antitumour activities. Ann Oncol 18(Suppl 10):X3–X10, 2007 [DOI] [PubMed] [Google Scholar]
- 11. Gauthier A, Ho M: Role of sorafenib in the treatment of advanced hepatocellular carcinoma: an update. Hepatol Res 43:147–154, 2013 [DOI] [PMC free article] [PubMed] [Google Scholar]
- 12. Schmidt S, Dunet V, Koehli M, et al. : Diffusion-weighted magnetic resonance imaging in metastatic gastrointestinal stromal tumor (GIST): a pilot study on the assessment of treatment response in comparison with 18F-FDG PET/CT. Acta Radiol 54:837–842, 2013 [DOI] [PubMed] [Google Scholar]
- 13. Gong NJ, Wong CS, Chu YC, et al. : Treatment response monitoring in patients with gastrointestinal stromal tumor using diffusion-weighted imaging: preliminary results in comparison with positron emission tomography/computed tomography. NMR Biomed 26:185–192, 2013 [DOI] [PubMed] [Google Scholar]
- 14. Mannelli L, Kim S, Hajdu CH, et al. : Serial diffusion-weighted MRI in patients with hepatocellular carcinoma: prediction and assessment of response to transarterial chemoembolization—preliminary experience. Eur J Radiol 82:577–582, 2013 [DOI] [PubMed] [Google Scholar]
- 15. Sahani DV, Jiang T, Hayano K, et al. : Magnetic resonance imaging biomarkers in hepatocellular carcinoma: association with response and circulating biomarkers after sunitinib therapy. J Hematol Oncol 6:577–51, 2013 [DOI] [PMC free article] [PubMed] [Google Scholar]
- 16. Kim H, Folks KD, Guo L, et al. : Early therapy evaluation of combined cetuximab and irinotecan in orthotopic pancreatic tumor xenografts by dynamic contrast-enhanced magnetic resonance imaging. Mol Imag 10:153–167, 2011 [PMC free article] [PubMed] [Google Scholar]
- 17. Ahn SJ, Park MS, Kim KA, et al. : (18)F-FDG PET Metabolic parameters and MRI perfusion and diffusion parameters in hepatocellular carcinoma: a preliminary study. PLoS ONE 8:153–e71571, 2013 [DOI] [PMC free article] [PubMed] [Google Scholar]
- 18. Hsu C, Yang TS, Huo TI, et al. : Vandetanib in patients with inoperable hepatocellular carcinoma: a phase II, randomized, double-blind, placebo-controlled study. J Hepatol 56:1097–1103, 2012 [DOI] [PubMed] [Google Scholar]
- 19. Yau T, Chen PJ, Chan P, et al. : Phase I dose-finding study of pazopanib in hepatocellular carcinoma: evaluation of early efficacy, pharmacokinetics, and pharmacodynamics. Clin Cancer Res 17:6914–6923, 2011 [DOI] [PubMed] [Google Scholar]
- 20. Yap TA, Arkenau HT, Camidge DR, et al. : First-in-human phase I trial of two schedules of OSI-930, a novel multikinase inhibitor, incorporating translational proof-of-mechanism studies. Clin Cancer Res 19:909–919, 2013 [DOI] [PMC free article] [PubMed] [Google Scholar]
- 21. Blockley NP, Jiang L, Gardener AG, et al. : Field strength dependence of R1 and R2* relaxivities of human whole blood to ProHance, Vasovist, and deoxyhemoglobin. Magn Reson Med 60:1313–1320, 2008 [DOI] [PubMed] [Google Scholar]
- 22. Neter J, Kutner MH, Nachtsheim JC, et al. Applied Linear Statistical Models (ed 4). Columbus, OH, McGraw-Hill, 1996 [Google Scholar]
- 23. Rodgers JL, Nicewander WA: Thirteen ways to look at the correlation coefficient. Am Statistician 42:59–66, 1988 [Google Scholar]
- 24. Zwick S, Brix G, Tofts PS, et al. : Simulation-based comparison of two approaches frequently used for dynamic contrast-enhanced MRI. Eur Radiol 20:432–442, 2010 [DOI] [PubMed] [Google Scholar]
- 25. Heye T, Davenport MS, Horvath JJ, et al. : Reproducibility of dynamic contrast-enhanced MR imaging, Part I: perfusion characteristics in the female pelvis by using multiple computer-aided diagnosis perfusion analysis solutions. Radiology 266:801–811, 2013 [DOI] [PubMed] [Google Scholar]
- 26. Kudo K, Christensen S, Sasaki M, et al. : Accuracy and reliability assessment of CT and MR perfusion analysis software using a digital phantom. Radiology 267:201–211, 2013 [DOI] [PMC free article] [PubMed] [Google Scholar]
- 27. Mendel DB, Laird AD, Xin X, et al. : In vivo antitumor activity of SU11248, a novel tyrosine kinase inhibitor targeting vascular endothelial growth factor and platelet-derived growth factor receptors: determination of a pharmacokinetic/pharmacodynamic relationship. Clin Cancer Res 9:327–337, 2003 [PubMed] [Google Scholar]
- 28. Svagzdys S, Lesauskaite V, Pavalkis D, et al. : Microvessel density as new prognostic marker after radiotherapy in rectal cancer. BMC Cancer 9:327–95, 2009 [DOI] [PMC free article] [PubMed] [Google Scholar]
- 29. Jain RK: Normalizing tumor vasculature with anti-angiogenic therapy: a new paradigm for combination therapy. Nat Med 7:987–989, 2001 [DOI] [PubMed] [Google Scholar]
- 30. Kim H, Zhai G, Samuel SL, et al. : Dual combination therapy targeting DR5 and EMMPRIN in pancreatic adenocarcinoma. Mol Cancer Ther 11:405–415, 2012 [DOI] [PMC free article] [PubMed] [Google Scholar]


