

Abstract
There is growing evidence that obesity has deleterious effects on the brain and cognitive function in the elderly population. However, the specific mechanisms through which aging and obesity interact to promote cognitive decline remain unclear. To test the hypothesis that aging exacerbates obesity-induced cerebromicrovascular damage and neuroinflammation, we compared young (7 months) and aged (24 months) high fat diet–fed obese C57BL/6 mice. Aging exacerbated obesity-induced systemic inflammation and blood–brain barrier disruption, as indicated by the increased circulating levels of proinflammatory cytokines and increased presence of extravasated immunoglobulin G in the hippocampus, respectively. Obesity-induced blood–brain barrier damage was associated with microglia activation, upregulation of activating Fc-gamma receptors and proinflammatory cytokines, and increased oxidative stress. Treatment of cultured primary microglia with sera derived from aged obese mice resulted in significantly more pronounced microglia activation and oxidative stress, as compared with treatment with young sera. Serum-induced activation and oxidative stress were also exacerbated in primary microglia derived from aged animals. Hippocampal expression of genes involved in regulation of the cellular amyloid precursor protein–dependent signaling pathways, beta-amyloid generation, and the pathogenesis of tauopathy were largely unaffected by obesity in aged mice. Collectively, obesity in aging is associated with a heightened state of systemic inflammation, which exacerbates blood–brain barrier disruption. The resulting neuroinflammation and oxidative stress in the mouse hippocampus likely contribute to the significant cognitive decline observed in aged obese animals.
Key Words: Adipose, Metabolic syndrome, Insulin resistance, Alzheimer’s disease, Blood.
Currently, more than 35% of individuals aged 65 and older are obese and if the current trend continues, nearly half of the elderly population in the United States will be obese by 2030 (1). It can be predicted that in the aging baby boomer population, a dramatic rise in the incidence of obesity-related diseases (including cardiovascular and cerebrovascular diseases) will occur (2), which will have a significant impact on the American economy and health care system.
There is growing evidence that obesity has deleterious effects on the brain and cognitive function in the elderly population (3,4). For example, in the Framingham Offspring Study, higher waist–hip ratio predicted a significant decline in cognitive function later in life (5). Importantly, obesity both promotes the development of vascular cognitive impairment (6) and increases the incidence of Alzheimer’s disease (AD) (7). Experimental and clinical studies suggest that activation of inflammatory processes contribute to obesity-related impairment of cognitive function (8). Yet, the mechanisms whereby obesity promotes neuroinflammation are poorly understood. Although the available human data suggest that advanced age and obesity have synergistic effects, there are no studies addressing the specific age-related mechanisms through which aging exacerbates obesity-induced neuroinflammation.
There is increasing evidence to support an essential role of mechanisms regulating the integrity of the blood–brain barrier (BBB) in the onset and progression of both vascular cognitive impairment and AD (9). BBB breakdown is thought to precede and trigger both neuroinflammation and neurodegeneration. Despite the paramount importance of BBB integrity in neuroprotection, it is not well understood how aging and obesity affect the BBB.
The present study was designed to test the hypothesis that aging exacerbates obesity-induced cerebromicrovascular damage and BBB disruption, which promote neuroinflammation and oxidative stress in the hippocampus. To test our hypothesis, we assessed changes in BBB function, microglia activation, hippocampal cytokine expression, and markers of oxidative/nitrative stress in young and aged high fat diet (HFD)–fed obese C57BL/6 mice. To determine whether enhanced neuroinflammation triggers early processes involved in the development of AD, we also studied hippocampal expression of genes involved in regulation of the cellular amyloid precursor protein (APP)–dependent signaling pathways, beta-amyloid generation, and the pathogenesis of taupathy.
Methods
Animals and Diets
Young and aged male C57BL/6 mice (7- and 24-month-old at the time of sacrifice, respectively) were purchased from the aging colony maintained by the National Institute on Aging at Charles River Laboratories (Wilmington, MA). Five months prior to the planned sacrifice, young and old animals were divided into four groups and placed on either a standard diet (SD) or HFD. The four groups were (i) young animals fed a SD, (ii) young animals fed a HFD, (iii) old animals fed a SD, and (iv) old animals fed a HFD (10). The high fat chow, commonly used to induce obesity, delivers 60% kcal from fat (lard and soybean oil), whereas the SD provides only 10% kcal from fat (D12492, D12450B, respectively, Research Diets Inc.; New Brunswick, NJ). The animals continued on the specified diets (with water and food ad libitum) for 5 months. Animals were housed in pairs in the Rodent Barrier Facility at University of Oklahoma Health Sciences Center on a 12-hour light/dark cycle and weighed weekly. All procedures were approved by the Institutional Animal Care and Use Committee of University of Oklahoma Health Sciences Center.
Five months after starting the HFD or SD, all experimental animals were fasted overnight. Tail vein blood samples were taken using a sterile lancet (Medipoint, Mineola, NY), and glucose was measured with a OneTouch UltraMini glucose meter (LifeScan, Milpitas, CA). The mice were then anesthetized by ketamine/xylazine (100/15mg/kg, im); whole blood was collected and centrifuged at 2,500g for 20 minutes at 4°C. Serum was collected, aliquoted, and stored at −80°C. The animals were transcardially perfused with heparin containing phosphate-buffered saline (PBS). Then, the mice were decapitated, the brains were removed, and the right hippocampus was isolated and snap frozen. The left hemisphere was embedded for histology.
Analysis of Circulating Levels of Inflammatory Cytokines
Circulating levels of cytokines and chemokines, which are important biomarkers of aging (11–15) and obesity (16), were analyzed in the sera using a multiplex protein array system (MILLIPLEX cytokine/chemokine array, EMD Millipore, Billerica, MA) according to the manufacturer’s protocol, as described previously (10,16).
Western Blotting
Immunoblotting studies for immunoglobulin G (IgG) and the tight junction proteins occludin and claudin-5 in hippocampal homogenates were performed. In brief, hippocampal samples (n = 4–6 per experimental group) were homogenized in ice-cold PBS with 1:100 Protease Inhibitor Cocktail (Sigma-Aldrich). Density of beta-actin bands. Samples were then subjected to sodium dodecyl sulfate–polyacrylamide gel electrophoresis and transferred to a polyvinylidene difluoride membrane. Membranes were blocked with 5% BSA (in 2% Tween in PBS, for 2 hours, at room temperature) and incubated with a primary antibody directed against IgG (sheep anti-mouse IgG, peroxidase-linked whole antibody, 1:500, at room temperature, Amersham NXA931), occludin (rabbit polyclonal, 1:1,000, overnight at 4°C, Abcam), or claudin-5 (rabbit polyclonal, 1:1,000, overnight at 4°C, Abcam), and then incubated with the appropriate horseradish peroxidase–conjugated secondary antibodies (for 2 hours, at room temperature). Membranes were developed using Amersham ECL Prime Western Blotting Detection Reagent (GE Healthcare). The relative abundance of studied proteins was determined with densitometry. β-Actin (mouse monoclonal, 1:15,000, for 45 minutes, at room temperature, Abcam) was used for normalization purposes.
Quantitative Real-Time Reverse Transcription–PCR
A quantitative real-time reverse transcription–PCR technique was used to analyze mRNA expression of Fc-gamma receptor (FcγR) isoforms using a Strategen MX3000 platform (17–22). In brief, total RNA was isolated with a Mini RNA Isolation Kit (Zymo Research, Orange, CA) and was reverse transcribed using Superscript III RT (Invitrogen) as detailed previously (17). Amplification efficiencies were determined using a dilution series of a standard vascular sample. Quantification was performed using the efficiency-corrected ΔΔCq method. The relative quantities of the reference genes—Hprt1, Ywhaz, and Actb—were determined, and a normalization factor was calculated based on the geometric mean for internal normalization.
Assessment of Autoregulatory Function of Isolated Middle Cerebral Arteries
Segments of the middle cerebral arteries (MCAs) were isolated using microsurgery instruments for functional studies, as reported (23). In brief, segments of MCAs were mounted onto two glass micropipettes in an organ chamber and pressurized to 60 mmHg. The hydrodynamic resistance of the micropipettes was matched. Inflow and outflow pressures were controlled and measured by a pressure servo-control system (Living Systems Instrumentation, Burlington, VE). Inner vascular diameter was measured with a custom-built videomicroscope system and continuously recorded using a computerized data acquisition system as reported (23). All vessels were allowed to stabilize for 60 minutes in oxygenated (21% O2, 5% CO2, 75% N2) Krebs’ buffer (at 37°C). To test the autoregulatory function of MCAs, the myogenic response was assessed by measuring changes in vascular diameter in response to stepwise increases (10 mmHg steps, for 5 minutes each) in intraluminal pressure (from 0 to 160 mmHg). At the end of each experiment, the passive diameter curves were obtained (0–160 mmHg) in the presence of Ca2+-free Krebs’ buffer containing nifedipine (10–5 mol/L) to achieve maximal vasodilatation.
Immunofluorescent Labeling and Confocal Microscopy
Mice were transcardially perfused with PBS, then brains were removed and hemisected. The left hemispheres were fixed overnight in 4% paraformaldehyde, then were cryoprotected in a series of graded sucrose solutions (10%, 20%, and 30% overnight) and frozen in Cryo-Gel (Electron Microscopy Sciences, Hatfield, PA). Coronal sections of 70 µm were cut through the hippocampus and stored free-floating in cryopreservative solution (25% glycerol, 25% ethylene glycol, 25% 0.2 M phosphate buffer, 25% distilled water) at −20°C. Selected sections were ~1.6mm caudal to Bregma, representing the more rostral hippocampus. After washing (3 × 5 minutes with Tris-buffered saline [TBS] then 3 × 5 minutes with 1× TBS + 0.25% Triton X-100), sections were treated with 1% of sodium borohydride solution for 5 minutes. After a second washing step (3 × 5 minutes with distilled water plus 3 × 5 minutes with 1× TBS) and blocking in 5% BSA/TBS (with 0.5% Triton X-100, 0.3M glycin, and 1% fish gelatin; for 3 hours), sections were immunostained using primary antibodies for two nights at 4°C. The following primary antibodies were used: rat anti-mouse CD31 (1:50, unconjugated; Cat. No. 550274, BD Pharmingen, San Jose, CA) to label endothelial cells, goat anti-mouse IgG (1:100, fluorescein isothiocyanate [FITC] conjugated; Cat. No. 005-090-003, Jackson Immuno Research, West Grove, PA) to label extravasated IgG, rabbit anti-mouse Iba1 (1:50, unconjugated; Cat. No. 019-19741, Wako, Richmond, VA) to label microglia, and rabbit anti-mouse CD68 (1:100, unconjugated; Cat. No. ab125212, Abcam, Cambridge, MA) to label activated microglia. The following secondary antibodies were used: Alexa Fluor 647- and Alexa Fluor 568-labeled goat anti-rabbit IgG (1:1,000, Cat. No. 4414, Cell Signaling, Danvers, MA) and goat anti-rat IgG (1:1,000, Cat. No. A11077, Molecular Probes, Grand Island, NY). Sections were washed for 3 × 5 minutes with TBS then 3 × 5 minutes with 1× TBS + 0.25% Triton X-100. For nuclear counterstaining, Hoechst 33342 (Life Technologies, Grand Island, NY) was used. Then, the sections were transferred to slides and coverslipped. Confocal images were captured using a Leica SP2 MP confocal laser scanning microscope.
Microglia Activation
Immunofluorescent labeling for Iba1, CD68, and CD31 (as mentioned earlier) was used to identify microglia, activated microglia, and capillary endothelial cells in the brain, respectively. The relative numbers of CD68 positive–activated microglia and the number of Iba1 positive perivascular microglia (located adjacent to CD31+ capillaries) per region of interest in the hippocampus were calculated. In each animal, four randomly selected fields from the hippocampus were analyzed in six nonadjacent sections. Six animals per group were analyzed.
Establishment and Characterization of Primary Microglia Cell Cultures
To study the effects of aging and plasma-derived factors on activation status of microglia, we used primary rat microglia cell cultures as model system. To establish primary microglia cell cultures, the brains of male 3- and 24-month-old F344xBN rats (obtained from the National Institute on Aging) were removed aseptically, rinsed in ice-cold PBS, and minced into ~1mm3 pieces. The tissue was washed twice in ice-cold 1× PBS by low-speed centrifugation (50g, 2–3 minutes). The diced tissue was digested in a solution of collagenase (800 U/g tissue), hyaluronidase (2.5 U/g tissue), and elastase (3 U/g tissue) in 1 mL PBS/100 mg tissue for 45 minutes at 37°C in rotating humid incubator. The digested tissue was passed through a 40 µm cell strainer to remove undigested blocks. The single-cell lysate was centrifuged for 2 minutes at 70g. After removing the supernatant carefully, the pellet was washed twice in cold PBS supplemented with 2.5% fetal calf serum (FCS), and the suspension centrifuged at 300g, for 5 minutes at 4°C.
To create a microglia-enriched fraction, the cell suspension was gradient centrifuged by using OptiPrep solution (Axi-Shield, PoC, Norway). Briefly, the cell pellet was resuspended in 5.4mL OptiPrep mixed with 9.6mL Hanks’ balanced salt solution. On top of the solution, 10 mL from a mixture of 4.8 mL OptiPrep and 25.2 mL Hanks’ balanced salt solution (9.6%) plus 2 µL Phenol Red indicator was layered. The samples were centrifuged for 20 minutes at 670g at room temperature, then the cellular layer that banded at the interface between the top layer and the lower layer was collected. The cells were washed twice in cold PBS/2.5% FCS, then each sample was divided into two tubes (average cell count: ~3.5 × 10⁷ cells per tube). The cells were incubated for 30 minutes at 4°C with murine immunoglobulins to block FcRs and then washed twice in cold PBS supplemented with 2.5% FCS. The cells were incubated for 30 minutes at 4°C in the dark with anti-Iba1/PE and anti-CD54/FITC (80 µL PBS/FCS plus 25 µL antibody solution per 107 cells; BD Biosciences, San Jose, CA). After washing the cells twice with magnetic-activated cell sorting buffer (2 mL buffer per 107 cells at 1,500rpm, 10 minutes, 4°C; Milltenyi Biotech, Cambridge, MA), anti-FITC magnetic bead–labeled and anti-PE magnetic bead–labeled secondary antibodies were used for 15 minutes at 4°C in the dark. Iba1+/CD54+ cells were collected by magnetic separation applying magnetic-activated cell sorting LD magnetic separation columns according to the manufacturer’s guidelines (Milltenyi Biotech). The eluted cells were washed in 1 mL PBS twice at 1,500 rpm, 10 minutes at 4°C, resuspended in 1 mL growth medium (Cell Application, San Diego, CA), and plated out into collagen- and fibronectin-coated T25 flasks (containing 5 mL prewarmed media). The media were changed on the second day of the culture. The first visible colonies appeared after 7–10 days. The magnetic bead–based enrichment step was repeated twice to obtain pure culture of Iba1+/CD54+ cells.
Primary microglia were phenotypically characterized by flow cytometry (GUAVA 8HT, EMD Millipore). Briefly, antibodies against the following microglia markers were used: (i) FITC Mouse Anti-Rat Iba-1 (Abcam, ab15691), (ii) FITC Hamster Anti-Rat CD40 (Abcam, ab95535), (iii) RPE Mouse Anti-Rat CD68 (ABD Serotec, MCA341PE), (iv) FITC Mouse Anti-Rat CD45 (BD Pharmingen, 561867), and (v) APC Mouse Anti-Rat CD11b (BD Pharmingen, 562102). Isotype-specific antibody-labeled fractions served as negative controls. Flow cytometric analysis showed that after the third cycle of immunomagnetic selection, virtually all cells in the resultant cell populations were positive for the aforementioned microglia markers.
Studies on Primary Microglia Cell Cultures
To elucidate the effects of plasma-derived factors on activation status of microglia, cultured primary young microglia were treated (for 24 hours) with sera (5%) derived from SD-fed and HFD-fed young and aged mice. Microglia cultured in the presence of 1% FCS were used as control. To elucidate the effects of aging on activation status of microglia, we treated young and aged primary microglia with sera from HFD-fed aged mice. The activation state of microglia was assessed by flow cytometry (GUAVA 8HT, EMD Millipore) using FITC mouse anti-rat CD54 (BD Pharmingen, 554969) and RPE mouse anti-rat CD68 (ABD Serotec, MCA341PE) antibodies.
Microglial activation results in the production of both extracellular and intracellular reactive oxygen species, which contribute to proinflammatory gene expression and neurotoxic consequences. Thus, as an additional index of microglia activation, cellular O2 • − production in serum-treated cultured cells was measured by flow cytometry (GUAVA 8HT, EMD Millipore) (24,25) using dihydroethidium (3 × 10− 6 mol/L; at 37°C for 30 minutes), an oxidative fluorescent dye, as previously reported (17). Cell debris (low forward and side scatter) and dead cells (Sytox Green positive) were gated out prior to analysis. The data are presented as relative changes in mean intensity of dihydroethidium fluorescence.
Assessment of Proinflammatory and Amyloidogenic Gene Expression in the Hippocampus
In addition to quantifying microglia activation, we analyzed relative abundance of several neuroinflammatory cytokines/chemokines through quantitative real-time PCR with RNA isolated from snap-frozen hippocampal samples. The mRNA expression of genes known to be involved in beta-amyloid generation, and AD was also analyzed using validated TaqMan Gene Expression Assays (Applied Biosystems) and a Strategen MX3000 platform, as previously reported (17). Total RNA was isolated with RNeasy Mini kit (Qiagen) using a fully automated QIAcube-based workflow and was reverse transcribed using Superscript III RT (Invitrogen) as described previously (17). Quantitative reverse transcription–PCR quantification was performed using the ΔΔCq method. The relative quantities of the reference genes—Actb, Hprt1, and Gapdh—were determined, and a normalization factor was calculated based on the geometric mean for internal normalization. Fidelity of the PCR reaction was determined by melting temperature analysis and visualization of the product on a 2% agarose gel.
Determination of Hippocampal Protein 3-Nitrotyrosine Content
As a marker of hippocampal oxidative/nitrosative stress in obesity and aging, 3-nitrotyrosine (a marker for peroxynitrite action) was assessed in homogenates of hippocampi using the OxiSelect Protein Nitrotyrosine ELISA Kits (Cell Biolabs), according to the manufacturer’s guidelines.
Statistical Analysis
Data were analyzed by two-way analysis of variance followed by Tukey post hoc tests and Pearson’s correlation analysis. A p value less than .05 was considered statistically significant. Data are expressed as mean ± S E M.
Results
Effects of Chronic HFD and Aging on Body Mass
In agreement with previous data (26,27), we show that both young and aged mice fed a HFD exhibit significant weight gain over the experimental period (Figure 1A). The relative increase in body mass (calculated as a percentage of body mass at the beginning of treatment) of HFD-fed young mice was significantly greater as compared with HFD-fed aged animals (Figure 1B). The homeostasis model index of insulin resistance (insulin [in mU/L] × glucose [in mmol/L]/22.5) (28) was calculated to assess insulin resistance in HFD-fed mice. There was no significant difference in homeostasis model index of insulin resistance between the SD-fed young and aged mice (Young SD: 1.6±0.2; Aged SD: 1.8±0.2). Chronic feeding of a HFD resulted in insulin resistance, as shown by the significantly increased homeostasis model index of insulin resistance both in HFD-fed young and aged mice as compared with that in the respective SD-fed age-matched controls (Young HFD: 10.4±1.1; Aged HFD: 9.5±1.6). The effects of chronic HFD feeding on the serum biochemical profile of young and aged C57BL/6 mice were published recently (10).
Figure 1.

Panel A: Changes in body mass of young and aged mice fed a high-fat diet (HFD) or standard diet (SD). Each time point represents the average body mass of each group. Panel B shows percentage change in body mass. Data are means ± SEM. # p < .05 vs young (SD), *vs aged (SD). (C) Proteomic profiles of serum inflammatory markers in young and aged SD-fed lean and HFD-fed obese mice. The heat map is a graphic representation of normalized cytokine serum concentration values depicted by color intensity, from highest (bright red) to lowest (bright blue) expression. Values represent average serum protein expression levels (log2(fold change, normalized to the respective control mean value)) of replicate SD-fed control young mice (n = 5), HFD-fed young mice (n = 5), SD-fed aged mice (n = 5), and HFD-fed aged mice (n = 5). Aged obese mice on HFD have the highest levels of inflammatory markers.
Aging Exacerbates Obesity-Induced BBB Disruption
Using extravasated plasma-derived IgG as a marker for increased hippocampal cerebrovascular permeability, we tested the hypothesis that obesity-induced inflammatory status in aging is associated with an exacerbated BBB disruption. Western blot studies in hippocampal lysates demonstrated very low levels of IgG both in SD-fed and HFD-fed young mice (Figure 2A). Aging was associated with an increased IgG content in the hippocampus, which was further increased by HFD-induced obesity (Figure 2A). Immunostaining for plasma-derived IgG revealed significant perivascular IgG deposits in the hippocampus of aged obese mice (Figure 2E). IgG leakage in the hippocampus of HFD-fed young mice was significantly lower, and there was no detectable IgG leakage in young control mice (Figure 2B and C).
Figure 2.
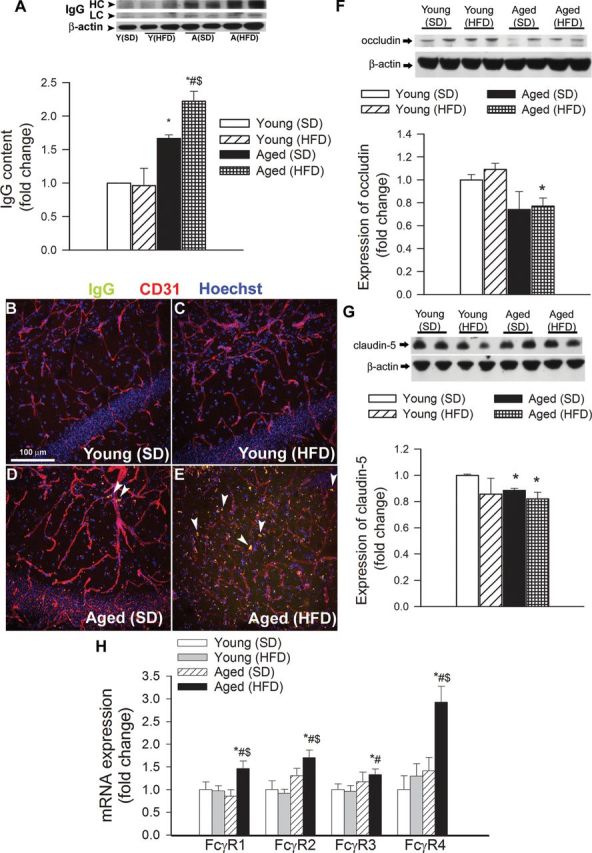
Obesity in aging exacerbates disruption of the blood–brain barrier. (A) Obesity and aging-induced changes in immunoglobulin G (IgG) content in the hippocampus of mice. (Upper panel) Original Western blot showing IgG heavy chain (HC) and light chain (LC) expression. β-Actin was used as a loading control. Bar graphs are summary densitometric values. Data are mean ± SEM. *p < .05 vs Young (standard diet [SD]); # p < .05 vs Young (high-fat diet [HFD]); $ p < .05 vs Aged (SD). (B–E) Confocal microscopy analysis of plasma-derived IgG (green) and CD31-positive microvessels (red) in the hippocampus of young and aged mice with or without HFD-induced obesity. Note the increased presence of extravascular IgG deposits in the hippocampus of aged obese mice (arrowheads). (F and G) Expression of the tight junction proteins occludin (F) and claudin-5 (G) in the hippocampi of young and aged SD-fed lean and HFD-fed obese mice. (Upper panels) Original Western blots. β-Actin was used as a loading control. Bar graphs are summary densitometric values. Data are mean ± SEM. *p < .05 vs Young (SD). n = 4–6 animals per group. (H) Quantitative reverse transcription–PCR data showing mRNA expression of the Fc-gamma receptor (FcγR) isoforms in the hippocampi of young and aged SD-fed lean and HFD-fed obese mice. Data are mean ± SEM (n = 6 in each group), *p < .05 vs Young (SD); # p < .05 vs Young (HFD); $ p < .05 vs Aged (SD).
BBB breakdown in neurodegenerative disorders often indicates disruption of the tight junctions due to reduced expression of tight junction proteins (29). In that regard, it is significant that in the hippocampi of aged obese mice, the expression of occludin and claudin-5 also tended to be downregulated (Figure 2F and G), although these alterations per se are unlikely to explain exacerbation of obesity-induced BBB disruption in aging. Because high levels of extravasated IgG were shown to upregulate FcγR expression in different inflammatory disease models (30,31), we examined whether obesity altered FcγR gene expression in the hippocampus. Consistent with the increased presence of IgG in the hippocampus, we found an increased expression of activating (FcγR1, FcγR3, FcγR4) and inhibitory (FcγR2) FcγRs in brains from HFD-fed aged mice, when compared with SD-fed young and aged mice (Figure 2H). In contrast, HFD-fed young mice did not show any difference in FcγR expression in the hippocampus, compared with SD-fed young animals (Figure 2H). Expression of FcγR4 tended to increase in SD-fed aged mice; however, the difference did not reach statistical significance (Figure 2H).
Obesity in Aging Impairs Autoregulatory Function of Cerebral Arteries
In the cerebral circulation, larger pial arteries play a significant role in cerebrovascular resistance, thus myogenic constriction of proximal branches of the cerebrovascular tree (ie, MCA) is uniquely important for protection of the cerebral microcirculation (32). Figure 3 shows that myogenic constriction developed in isolated MCAs at intraluminal pressures of 20–160 mmHg. In MCAs of young control mice, increases in intravascular pressure increased myogenic constriction up to 60 mmHg, and myogenic tone was maintained at almost the same level at up to ~140 mmHg, which overlaps the autoregulatory range of cerebral blood flow. MCAs of aged SD-fed mice tended to develop a slightly decreased myogenic constriction at the higher pressure range (ns). Myogenic constriction in MCAs from aged FHD-fed mice was significantly decreased (Figure 3A), and the pressure–myogenic tone curve was shifted downward (Figure 3B).
Figure 3.
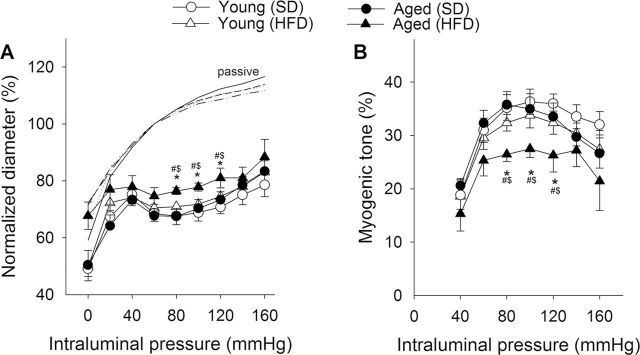
Obesity in aging impairs cerebrovascular autoregulatory function. (A) Steady-state changes in diameter of middle cerebral arteries (MCAs) isolated from each experimental group of mice in response to increases in intraluminal pressure. Vascular diameters are expressed as percentage of the maximally dilated passive diameter of each vessel at 80 mmHg. (B) Myogenic tone of MCAs, calculated as a percentage of the maximally dilated passive diameter of each vessel at the same intraluminal pressure. Data are mean ± SEM (n = 8 in each group). *p < .05 vs Young (standard diet [SD]); # p < .05 vs Young (high-fat diet [HFD]); $ p < .05 vs Aged (SD).
Aging Exacerbates Obesity-Induced Neuroinflammation in the Hippocampus
Previous studies suggest that leakage of plasma-derived factors through the damaged BBB has the potential to induce neuroinflammation by activating microglia (29). We found that in the hippocampi of young mice, the number of activated CD68+ microglia was low (Figure 4A). In the hippocampi of young mice on HFD, the number of CD68+-activated microglia was increased (Figure 4F). We found that aging is associated with a similar relative increase in the number of activated microglia in the hippocampi. Importantly, obesity-induced microglia activation was exacerbated in the hippocampi of aged mice (Figure 4A–F). Interestingly, obesity in both young and aged mice was associated with a ~30% increase in the number of perivascular microglia (Figure 4G–J).
Figure 4.

Obesity in aging exacerbates neuroinflammation. (Panels A–D) Confocal images showing CD68 positive–activated microglia (green fluorescence, arrowheads) in the hippocampus CA1 region from young standard diet (SD)-fed (A), young high-fat diet (HFD)-fed (B), aged SD-fed (C), and aged HFD-fed (D) animals. Red fluorescence: CD31 positive capillary endothelial cells; blue fluorescence: nuclei. Panel E shows that in the hippocampus of aged HFD-fed mice, most CD68 positive cells (arrows) are positive for IBA1. Panel (F) depicts summary data of relative changes in the number of CD68 positive/IBA1 positive–activated microglia in the hippocampus (fold change). Data are mean ± SEM. *p < .05 vs Young (SD); # p < .05 vs Young (HFD); $ p < .05 vs Aged (SD). (G–J) Confocal images showing perivascular IBA1 positive microglia (green fluorescent cells located adjacent to red fluorescent CD31 positive capillaries) in young SD-fed (G), young HFD-fed (H), aged SD-fed (I), and aged HFD-fed (J) animals. (Panels K and L) Flow cytometric analysis of CD54 expression (K) and reactive oxygen species (ROS) production (dihydroethidium [DHE] staining, Panel L) in cultured microglia induced by treatment with sera derived from SD-fed and HFD-fed young and aged mice. The detector cells were isolated from the brain of young rats as described in the Methods section. Bacterial lipopolysaccharide was used as positive control. Data are mean ± SEM. *p < .05 vs Young (SD); # p < .05 vs Young (HFD); $ p < .05 vs Aged (SD). (Panels M and N) Flow cytometry data showing serum-induced CD54 expression (M) and ROS production (DHE staining, Panel N) in cultured young and aged microglia. Data are mean ± SEM. *p < .05 vs young microglia.
Using cultured primary microglia, we confirmed that serum-derived factors elicited significant microglia activation, as indicated by the upregulation of CD54 and reactive oxygen species production (Figure 4K and L, respectively). To our knowledge, this is the first study to demonstrate that factors present in the circulation of aged obese mice exacerbate microglia activation and microglia-derived reactive oxygen species production (Figure 4K and L, respectively). Importantly, microglia derived from aged animals showed significant increases in both measures of microglia activation upon treatment with serum, as compared with cells derived from young animals (Figure 4M and N).
Sustained activation of microglia in the brain of aged obese mice was associated with an increased expression of several proinflammatory cytokines and chemokines (Figure 5A) in the hippocampi. Interestingly, both Th2 (IL10, TGFβ) and Th1 (TNFα, IL6, INFγ) cytokines appear to be upregulated in aged HFD-fed mice.
Figure 5.

(A) Obesity in aging is associated with a proinflammatory shift in cytokine expression profiles in the mouse hippocampus. The heat map is a graphic representation of normalized mRNA expression of cytokines and chemokines depicted by color intensity, from highest (bright red) to lowest (bright blue) expression (n = 6 in each group). Aged obese mice have the highest expression of inflammatory markers. (B) Relative hippocampal levels of 3-nitrotyrosine (a marker for peroxynitrite action). Data are mean ± SEM. *p < .05 vs Young (standard diet [SD]); # p < .05 vs Young (high-fat diet [HFD]); $ p < .05 vs Aged (SD).
Neuroinflammation is frequently associated with increased oxidative stress. We found that hippocampal 3-nitrotyrosine content tended to increase in young obese mice, although these differences did not reach statistical significance (Figure 5B). Consistent with the presence of increased obesity-related oxidative/nitrosative stress in the aged brain (26), we found that aging exacerbated obesity-induced increases in hippocampal 3-nitrotyrosine content (Figure 5B), confirming that the effects of age and obesity are synergistic.
Effects of Obesity and Aging on the Hippocampal Expression of APP and Genes Involved in APP-Dependent Signaling
As observed in Figure 6, neither obesity nor aging altered the expression of App (amyloid beta (A4) precursor protein), Apba1 (amyloid beta (A4) precursor protein-binding, family A, member 1; MINT-1), Apba2 (amyloid beta (A4) precursor protein-binding, family A, member 2; MINT-2), Apba3 (amyloid beta (A4) precursor protein-binding, family A, member 3; MINT-3), Apbb1 (amyloid beta (A4) precursor protein-binding, family B, member 1; FE65), Apbb2 (amyloid beta (A4) precursor protein-binding, family B, member 2; FE65L1), Apbb3 (amyloid beta (A4) precursor protein-binding, family B, member 3; FE65L2), and Appbp1 (NEDD8-activating enzyme E1 regulatory subunit), in the mouse hippocampus. Obesity in young mice as well as advanced age was associated with a decreased expression of Aplp1 (amyloid beta (A4) precursor-like protein 1). Aging decreased the expression of Aplp2 (amyloid beta (A4) precursor-like protein 2), whereas obesity was without effect (Figure 6).
Figure 6.

Effects of obesity in aging on the hippocampal expression of amyloid precursor protein (APP) and genes involved in APP-dependent signaling. Quantitative reverse transcription–PCR data showing mRNA expression of App, Apba1, Apba2, Apba3, Apbb1, Apbb2, Apbb3, Aplp1, Aplp2, and Appbp1. Data are mean ± SEM (n = 6 in each group). *p < .05 vs Young.
Effects of Obesity and Aging on the Hippocampal Expression of α-Secretases, β-Secretases, and γ-Secretases
The effects of obesity and aging on the expression of α-secretases (Figure 7A), β-secretases (Figure 7B), and γ-secretases (Figure 7C) were assessed in the mouse hippocampus. We found that aging and obesity did not alter the expression of Adam9 (ADAM metallopeptidase domain 9), Adam10 (ADAM metallopeptidase domain 10), Adam17 (ADAM metallopeptidase domain 17; TNF-alpha-converting enzyme), Bace1 (beta-site APP-cleaving enzyme 1; beta-secretase), Bace2 (beta-site APP-cleaving enzyme 2), Psen2 (presenilin 2), Aph1a (anterior pharynx defective 1 homolog A [Caenorhabditis elegans]; gamma-secretase subunit APH-1A; presenilin-stabilization factor) and Aph1b (anterior pharynx defective 1 homolog B [C elegans]; gamma-secretase subunit APH-1B; presenilin-stabilization factor-like), and Ncstn (nicastrin). Aging tended to decrease the expression of Psen1 (presenilin 1) and increase the expression of Psenen (presenilin enhancer 2 homolog [C elegans]). In young mice, obesity also increased the expression of Psenen.
Figure 7.

Effects of obesity in aging on the hippocampal expression of α-secretases, β-secretases, and γ-secretases. Quantitative reverse transcription–PCR data showing mRNA expression of the α-secretases Adam9, Adam10, and Adam17 (Panel A), the β-secretases Bace1 and Bace2 (Panel B), and the γ-secretase components Psen1, Psen2, Aph1a and Aph1b, Psenen, and Ncstn (Panel C). Data are mean ± SEM (n = 6 in each group). *p < .05 vs Young; # p < .05 vs Young (high-fat diet [HFD]).
Effects of Obesity and Aging on the Hippocampal Expression of Genes Involved in Tauopathies
The effects of obesity and aging on the expression of genes involved in taupathies were assessed in the mouse hippocampus (Figure 8). Neither obesity nor aging significantly altered the hippocampal expression of Mapt (microtubule-associated protein tau), Mapk1 (mitogen-activated protein kinase 1), Mapk3 (mitogen-activated protein kinase 3), Ppp2ca (protein phosphatase 2, catalytic subunit, alpha isozyme), Csnk1d (casein kinase 1, delta), Csnk1a1 (casein kinase 1, alpha 1), Capn1 (calpain 1, mu/I large subunit), and Pkn1 (protein kinase N1). Aging downregulated Capns1 (calpain, small subunit 1) and Cdk5r1(cyclin-dependent kinase 5, regulatory subunit 1; p35) and tended to decrease the expression of Casp6 (caspase 6). Aged obese mice, but not young obese mice, exhibited decreased expression of Pkacb (protein kinase, cAMP-dependent, catalytic, beta).
Figure 8.

Effects of obesity in aging on the hippocampal expression of genes involved in abnormalities of microtubule-associated tau protein. Quantitative reverse transcription–PCR data showing mRNA expression of Mapt, Mapk1, Mapk3, Ppp2ca, Csnk1d, Csnk1a1, Capn1, Capns1, Cdk5r1, Casp6, Pkn1, and P kacb. Data are mean ± SEM (n = 6 in each group). *p < .05 vs Young; # p < .05 vs Young (high-fat diet [HFD]); $ p < .05 vs Aged.
Discussion
The results of this study suggest that HFD-induced obesity in aged mice is associated with exacerbation of BBB disruption, neuroinflammation, and oxidative stress. There is growing evidence that obesity promotes low-grade systemic inflammation. In adipose tissue macrophages, microvascular endothelial cells (33,34) and adipocytes release a wide range of inflammatory mediators in the bloodstream. In obesity, both visceral adipose tissue and perivascular adipose tissue exhibit enhanced inflammatory status, characterized by a marked proinflammatory shift in the secretome and increased macrophage infiltration (10,34–37), which associates with increased circulating levels of adipose-derived proinflammatory cytokines and chemokines both in experimental animals and humans (38) (Figure 1). Previous studies provide evidence that aging exacerbates obesity-induced inflammation in the adipose tissue (10,39), which likely underlies the increased presence of proinflammatory cytokines and chemokines in plasma of aged obese mice (Figure 1).
Circulating inflammatory cytokines, derived from adipose tissue, readily reach the cerebral microcirculation and likely alter the function of cerebromicrovascular endothelial cells. Here, we provide evidence that enhanced inflammatory status in aged obese mice is associated with significant BBB disruption in the hippocampus (Figure 2). The mechanisms of obesity-related BBB disruption in aged mice are likely multifaceted and may involve increased endothelial oxidative stress (10), pericyte dysfunction, and changes in tight junctions, which form an essential structural component of the BBB. Our present study suggests that although aging tends to downregulate the expression of occludin and claudin-5 proteins, these alterations are not exacerbated by obesity (Figure 2). Yet, we cannot exclude the possibility that obesity and aging affect the expression/phosphorylation of other components of tight junctions. Importantly, adiponectin induces translocation of the tight junction protein zona occludens-1 to the plasma membrane and thereby potently decreases microvascular permeability (40) largely via an AMP-activated protein kinase–dependent pathway. Previously, we reported that HFD-induced obesity significantly decreases plasma adiponectin levels in aged mice (~4 µg/mL, as compared with ~8 µg/mL in young obese mice) (10). Thus, future studies should elucidate the role of adiponectin in BBB disruption observed in these animals. On the basis of recent evidence obtained in 14-month-old apolipoprotein E–deficient mice, it can be hypothesized that factors that promote atherosclerosis in large arteries may exacerbate age-related BBB disruption in obese mice (41). In healthy young animals, pressure-induced myogenic constriction of the cerebral arteries acts as a critical homeostatic mechanism that assures that high arterial pressure does not penetrate the distal portion of the microcirculation and cause damage to the thin-walled arteriolar and capillary microvessels in the brain. Here, we report for the first time that obesity in aging is associated with dysfunction of cerebrovascular autoregulatory mechanisms that protect the brain (Figure 3). We hypothesize that cerebrovascular autoregulatory dysfunction may contribute to the impairment of the BBB in aged obese animals.
Our present study provides evidence that through the damaged BBB evident in aged obese mice, plasma constituents, including IgG, enter the brain (Figure 2). Plasma-derived factors can affect neuronal function by multiple mechanisms (29,30), including the induction of neuroinflammation (8,26,42). Recent studies suggest that plasma-derived IgG is a particularly potent stimulus for microglia activation, which is elicited by activating IgG FcγRs upon IgG binding. Importantly, obesity in aging upregulates hippocampal expression of activating FcγRs (FcγR1, FcγR3, and FcγR4; Figure 2H), which are known to be expressed in the microglia. Previous studies also report that HFD-induced obesity in the rat brain induces accumulation of IgG in the microglia (43). Other plasma constituents that can contribute to microglia activation include thrombin, fibrinogen, and inflammatory cytokines (44,45). Here, we provide evidence that in aged obese mice, BBB disruption and increased extravasation of IgG and likely other plasma constituents are associated with an exacerbated neuroinflammatory response as shown by the increased number of activated microglia (Figure 4), upregulation of inflammatory mediators, and oxidative stress (Figure 5) in the hippocampi of aged obese mice. Microglial activation, associated with BBB disruption (46,47) and oxidative stress (26), has also been observed in the hippocampi of a HFD-fed middle-aged rats and mice. In this study, we present in vitro bioassay studies showing that factors present in the circulation of aged obese mice elicit significantly more pronounced microglia activation than serum factors derived from young obese or aged lean mice (Figure 4K and L). In addition, we find that microglia activation induced by serum-derived factors is exacerbated with advanced age (Figure 4M and N) extending previous findings demonstrating age-related increases in microglia activation in humans (48) and laboratory animals (49). On the basis of the aforementioned findings, we hypothesize that increased extravasation of plasma-derived factors promotes activation of microglia in aged obese mice and that obesity-related microgliosis is further exacerbated by the age-related alterations in the capacity of circulating factors to cause microglia activation. It is also likely that the elevated inflammatory state in perivascular microglia, in turn, contributes to a compromised BBB (50). In addition, likely extravasated macrophages (which express surface markers similar to that expressed by activated microglia) are also present in the hippocampus of aged obese mice, which may exacerbate the harmful action of activated microglia. Microglia-derived proinflammatory cytokines, chemokines, proteases, and reactive oxygen species have been shown to promote neuronal dysfunction (51–53). Clinical studies also show that markers of inflammation are related to cognitive deficits in elderly patients (54). On the basis of the aforementioned studies, one can hypothesize that exacerbation of neuroinflammation and oxidative stress is causally linked to hippocampal dysfunction in aged obese mice (8,27,42).
Epidemiological studies provide evidence that in addition to the established association of obesity and metabolic disease with cerebrovascular lesions and vascular cognitive impairment, there is a direct relationship between obesity and pathogenesis of AD (reviewed in (7)). Experimental studies support this notion, by demonstrating that feeding a HFD exacerbates cerebral pathological alterations and the accompanying cognitive deficit in APP transgenic mice as well (55–57). To determine whether obesity-induced microvascular alterations and chronic low-grade neuroinflammation in aged mice were sufficient to trigger early processes involved in the development of AD, we studied hippocampal expression of genes involved in regulation of the cellular APP-dependent signaling pathways, beta-amyloid generation and processing, and the pathogenesis of tauopathy. Interestingly, neither obesity nor aging affects cerebral expression of APP (Figure 6), whose proteolysis generates beta amyloid, the main component of amyloid plaques. We have not detected consistent obesity-related changes in the expression of APP-binding proteins (Figure 6) and enzymes that are involved in cleavages of APP (Figure 7). Previous studies indicated that HFD-induced obesity increases tau phosphorylation in the mouse hippocampus (58). Further, recent studies show that in THY-Tau22 transgenic mice exhibiting HFD-induced obesity exhibit spatial learning deficits as well as the progression of hippocampal tau pathology (59). In the present study, obesity did not upregulate the expression of genes that are involved in abnormalities of microtubule-associated protein tau (Figure 8). Interestingly, the results of previous experimental studies show that brains of HFD-fed younger mice often do not exhibit overt AD histopathology (60), increases in beta amyloid (61) or phospho-tau (62). This lack of effects occurs in the presence of significant elevation in protein oxidation and lipid peroxidation (61) and suggests that obesity-related neuroinflammation may contribute to but is not sufficient to cause amyloid and tau pathologies observed in AD.
Limitations of the Study
In the present study, we analyzed hippocampal IgG content as a marker of BBB disruption. In future studies, the severity of BBB should be further analyzed using high– and low–molecular weight fluorescent tracer molecules. For microglia isolation, we used antibodies against CD54 and Iba-1, which likely resulted in the enrichment of CD54+/Iba-1+ microglia in the cell cultures. It is presently unknown whether serum-induced activation is different in a different subpopulation of microglia. As many proteins are known to be modulated at the posttranslational level in their contributions to Alzheimer pathology, further studies are needed to investigate the interaction of aging and HFD-induced obesity at the posttranslational level as well.
Conclusions
Collectively, our present and previous studies as well as investigations by other laboratories demonstrate that obesity in aging is associated with a heightened state of systemic inflammation, which exacerbates BBB disruption, neuroinflammation, and oxidative stress in the mouse hippocampus and that the aforementioned pathophysiological alterations are associated with significant cognitive decline in these animals. Future studies should elucidate the specific age-related mechanism that underlies increased sensitivity of aged cerebral vessels to inflammation-mediated damage, including the role of age-related changes in IGF-1 (63). Indeed, recent studies demonstrate that IGF-1 deficiency exacerbates the prooxidant and proinflammatory vascular effects of obesity and promotes endothelial injury in HFD-fed obese rats (16), mimicking the aging phenotype. Aging also may increase the sensitivity of the microglia to the proinflammatory effects of plasma-derived factors and these effects may be potentiated by obesity. Future studies can be designed to test this hypothesis. Both obesity and aging can lead to structural alterations in the cerebromicrovasculature, endothelial dysfunction, and/or impaired neurovascular coupling (64). The interaction between neuroinflammation and these vascular mechanisms warrants further investigation.
Funding
This work was supported by grants from the American Heart Association (to P.T., A.C., and Z.U.), the National Center for Complementary and Alternative Medicine (R01-AT006526 to Z.U.); the National Institute on Aging (AG031085 to A.C.; AG038747 to W.E.S.), the American Federation for Aging Research (to A.C.), the Oklahoma Center for the Advancement of Science and Technology (to A.C., Z.U., and W.E.S.), Hungarian Scientific Research Fund (OTKA; K 108444) and the Nemzeti Fejlesztési Ügynökség (SROP-4.2.2.a-11/1/KONV-2012-0024 and -0017 to Z.U. and A.K.), and the Ellison Medical Foundation (to W.E.S.).
Acknowledgments
The authors gratefully acknowledge Donald K. Ingram, PhD (Pennington Biomedical Research Center, Baton Rouge, LA) for his suggestions and help with the writing of the manuscript.
References
- 1. Wang YC, Colditz GA, Kuntz KM. Forecasting the obesity epidemic in the aging U.S. population. Obesity (Silver Spring). 2007;15:2855–2865 [DOI] [PubMed] [Google Scholar]
- 2. Hubert HB, Feinleib M, McNamara PM, Castelli WP. Obesity as an independent risk factor for cardiovascular disease: a 26-year follow-up of participants in the Framingham Heart Study. Circulation. 1983;67:968–977 [DOI] [PubMed] [Google Scholar]
- 3. Gustafson DR, Karlsson C, Skoog I, Rosengren L, Lissner L, Blennow K. Mid-life adiposity factors relate to blood-brain barrier integrity in late life. J Intern Med. 2007;262:643–650 [DOI] [PubMed] [Google Scholar]
- 4. Beydoun MA, Beydoun HA, Wang Y. Obesity and central obesity as risk factors for incident dementia and its subtypes: a systematic review and meta-analysis. Obes Rev. 2008;9:204–218 [DOI] [PMC free article] [PubMed] [Google Scholar]
- 5. Wolf PA, Beiser A, Elias MF, Au R, Vasan RS, Seshadri S. Relation of obesity to cognitive function: importance of central obesity and synergistic influence of concomitant hypertension. The Framingham Heart Study. Curr Alzheimer Res. 2007;4:111–116 [DOI] [PubMed] [Google Scholar]
- 6. Gorelick PB, Scuteri A, Black SE, et al. Vascular contributions to cognitive impairment and dementia: a statement for healthcare professionals from the American Heart Association/American Stroke Association. Stroke. 2011;42:2672–2713 [DOI] [PMC free article] [PubMed] [Google Scholar]
- 7. Luchsinger JA. Adiposity, hyperinsulinemia, diabetes and Alzheimer’s disease: an epidemiological perspective. Eur J Pharmacol. 2008;585:119–129 [DOI] [PMC free article] [PubMed] [Google Scholar]
- 8. Pistell PJ, Morrison CD, Gupta S, et al. Cognitive impairment following high fat diet consumption is associated with brain inflammation. J Neuroimmunol. 2010;219:25–32 [DOI] [PMC free article] [PubMed] [Google Scholar]
- 9. Zlokovic BV. Neurovascular pathways to neurodegeneration in Alzheimer’s disease and other disorders. Nat Rev Neurosci. 2011;12:723–738 [DOI] [PMC free article] [PubMed] [Google Scholar]
- 10. Bailey-Downs LC, Tucsek Z, Toth P, et al. Aging exacerbates obesity-induced oxidative stress and inflammation in perivascular adipose tissue in mice: a paracrine mechanism contributing to vascular redox dysregulation and inflammation. J Gerontol A Biol Sci Med Sci. 2013;68:780–792 [DOI] [PMC free article] [PubMed] [Google Scholar]
- 11. Fisher G, Hunter GR, Glasser SP. Associations between arterial elasticity and markers of inflammation in healthy older women. J Gerontol A Biol Sci Med Sci. 2013;68:382–388 [DOI] [PMC free article] [PubMed] [Google Scholar]
- 12. Brinkley TE, Hsu FC, Beavers KM, et al. Total and abdominal adiposity are associated with inflammation in older adults using a factor analysis approach. J Gerontol A Biol Sci Med Sci. 2012;67:1099–1106 [DOI] [PMC free article] [PubMed] [Google Scholar]
- 13. Jenny NS, French B, Arnold AM, et al. Long-term assessment of inflammation and healthy aging in late life: the Cardiovascular Health Study All Stars. J Gerontol A Biol Sci Med Sci. 2012;67:970–976 [DOI] [PMC free article] [PubMed] [Google Scholar]
- 14. Kizer JR, Arnold AM, Jenny NS, et al. Longitudinal changes in adiponectin and inflammatory markers and relation to survival in the oldest old: the Cardiovascular Health Study All Stars study. J Gerontol A Biol Sci Med Sci. 2011;66:1100–1107 [DOI] [PMC free article] [PubMed] [Google Scholar]
- 15. Crasto CL, Semba RD, Sun K, et al. Endogenous secretory receptor for advanced glycation end products is associated with low serum interleukin-1 receptor antagonist and elevated IL-6 in older community-dwelling adults. J Gerontol A Biol Sci Med Sci. 2011;66:437–443 [DOI] [PMC free article] [PubMed] [Google Scholar]
- 16. Bailey-Downs LC, Sosnowska D, Toth P, et al. Growth hormone and IGF-1 deficiency exacerbate high-fat diet-induced endothelial impairment in obese Lewis dwarf rats: implications for vascular aging. J Gerontol A Biol Sci Med Sci. 2012;67:553–564 [DOI] [PMC free article] [PubMed] [Google Scholar]
- 17. Bailey-Downs LC, Mitschelen M, Sosnowska D, et al. Liver-specific knockdown of IGF-1 decreases vascular oxidative stress resistance by impairing the Nrf2-dependent antioxidant response: a novel model of vascular aging. J Gerontol A Biol Sci Med Sci. 2012;67:313–329 [DOI] [PMC free article] [PubMed] [Google Scholar]
- 18. Csiszar A, Sosnowska D, Tucsek Z, et al. Circulating factors induced by caloric restriction in the nonhuman primate Macaca mulatta activate angiogenic processes in endothelial cells. J Gerontol A Biol Sci Med Sci. 2013;68:235–249 [DOI] [PMC free article] [PubMed] [Google Scholar]
- 19. Csiszar A, Sosnowska D, Wang M, Lakatta EG, Sonntag WE, Ungvari Z. Age-associated proinflammatory secretory phenotype in vascular smooth muscle cells from the non-human primate Macaca mulatta: reversal by resveratrol treatment. J Gerontol A Biol Sci Med Sci. 2012;67:811–820 [DOI] [PMC free article] [PubMed] [Google Scholar]
- 20. Ungvari Z, Bailey-Downs L, Gautam T, et al. Age-associated vascular oxidative stress, Nrf2 dysfunction, and NF-{kappa}B activation in the nonhuman primate Macaca mulatta. J Gerontol A Biol Sci Med Sci. 2011;66:866–875 [DOI] [PMC free article] [PubMed] [Google Scholar]
- 21. Ungvari Z, Tucsek Z, Sosnowska D, et al. Aging-induced dysregulation of dicer1-dependent microRNA expression impairs angiogenic capacity of rat cerebromicrovascular endothelial cells. J Gerontol A Biol Sci Med Sci. 2013;68:877–891 [DOI] [PMC free article] [PubMed] [Google Scholar]
- 22. Valcarcel-Ares MN, Gautam T, Warrington JP, et al. Disruption of Nrf2 signaling impairs angiogenic capacity of endothelial cells: implications for microvascular aging. J Gerontol A Biol Sci Med Sci. 2012;67:821–829 [DOI] [PMC free article] [PubMed] [Google Scholar]
- 23. Toth P, Csiszar A, Sosnowska D, et al. Treatment with the cytochrome P450 ω-hydroxylase inhibitor HET0016 attenuates cerebrovascular inflammation, oxidative stress and improves vasomotor function in spontaneously hypertensive rats. Br J Pharmacol. 2013;168:1878–1888 [DOI] [PMC free article] [PubMed] [Google Scholar]
- 24. Csiszar A, Podlutsky A, Podlutskaya N, et al. Testing the oxidative stress hypothesis of aging in primate fibroblasts: is there a correlation between species longevity and cellular ROS production? J Gerontol A Biol Sci Med Sci. 2012;67:841–852 [DOI] [PMC free article] [PubMed] [Google Scholar]
- 25. Ungvari Z, Sosnowska D, Podlutsky A, Koncz P, Sonntag WE, Csiszar A. Free radical production, antioxidant capacity, and oxidative stress response signatures in fibroblasts from Lewis dwarf rats: effects of life span-extending peripubertal GH treatment. J Gerontol A Biol Sci Med Sci. 2011;66:501–510 [DOI] [PMC free article] [PubMed] [Google Scholar]
- 26. Bruce-Keller AJ, White CL, Gupta S, et al. NOX activity in brain aging: exacerbation by high fat diet. Free Radic Biol Med. 2010;49:22–30 [DOI] [PMC free article] [PubMed] [Google Scholar]
- 27. Morrison CD, Pistell PJ, Ingram DK, et al. High fat diet increases hippocampal oxidative stress and cognitive impairment in aged mice: implications for decreased Nrf2 signaling. J Neurochem. 2010;114:1581–1589 [DOI] [PMC free article] [PubMed] [Google Scholar]
- 28. Mather K. Surrogate measures of insulin resistance: of rats, mice, and men. Am J Physiol Endocrinol Metab. 2009;296:E398–E399 [DOI] [PubMed] [Google Scholar]
- 29. Zlokovic BV. The blood-brain barrier in health and chronic neurodegenerative disorders. Neuron. 2008;57:178–201 [DOI] [PubMed] [Google Scholar]
- 30. Fernandez-Vizarra P, Lopez-Franco O, Mallavia B, et al. Immunoglobulin G Fc receptor deficiency prevents Alzheimer-like pathology and cognitive impairment in mice. Brain. 2012;135(Pt 9):2826–2837 [DOI] [PubMed] [Google Scholar]
- 31. Nimmerjahn F, Ravetch JV. Fcgamma receptors as regulators of immune responses. Nat Rev Immunol. 2008;8:34–47 [DOI] [PubMed] [Google Scholar]
- 32. Faraci FM, Heistad DD. Regulation of large cerebral arteries and cerebral microvascular pressure. Circ Res. 1990;66:8–17 [DOI] [PubMed] [Google Scholar]
- 33. Xu H, Barnes GT, Yang Q, et al. Chronic inflammation in fat plays a crucial role in the development of obesity-related insulin resistance. J Clin Invest. 2003;112:1821–1830 [DOI] [PMC free article] [PubMed] [Google Scholar]
- 34. Hocking SL, Wu LE, Guilhaus M, Chisholm DJ, James DE. Intrinsic depot-specific differences in the secretome of adipose tissue, preadipocytes, and adipose tissue-derived microvascular endothelial cells. Diabetes. 2010;59:3008–3016 [DOI] [PMC free article] [PubMed] [Google Scholar]
- 35. Surmi BK, Hasty AH. Macrophage infiltration into adipose tissue: initiation, propagation and remodeling. Future Lipidol. 2008;3:545–556 [DOI] [PMC free article] [PubMed] [Google Scholar]
- 36. Fain JN. Release of interleukins and other inflammatory cytokines by human adipose tissue is enhanced in obesity and primarily due to the nonfat cells. Vitam Horm. 2006;74:443–477 [DOI] [PubMed] [Google Scholar]
- 37. Nishimura S, Manabe I, Nagasaki M, et al. In vivo imaging in mice reveals local cell dynamics and inflammation in obese adipose tissue. J Clin Invest. 2008;118:710–721 [DOI] [PMC free article] [PubMed] [Google Scholar]
- 38. Cartier A, Côté M, Lemieux I, et al. Age-related differences in inflammatory markers in men: contribution of visceral adiposity. Metabolism. 2009;58:1452–1458 [DOI] [PubMed] [Google Scholar]
- 39. Wu D, Ren Z, Pae M, et al. Aging up-regulates expression of inflammatory mediators in mouse adipose tissue. J Immunol. 2007;179:4829–4839 [DOI] [PubMed] [Google Scholar]
- 40. Vachharajani V, Cunningham C, Yoza B, Carson J, Jr, Vachharajani TJ, McCall C. Adiponectin-deficiency exaggerates sepsis-induced microvascular dysfunction in the mouse brain. Obesity (Silver Spring). 2012;20:498–504 [DOI] [PMC free article] [PubMed] [Google Scholar]
- 41. Badaut J, Copin JC, Fukuda AM, Gasche Y, Schaller K, da Silva RF. Increase of arginase activity in old apolipoprotein-E deficient mice under Western diet associated with changes in neurovascular unit. J Neuroinflammation. 2012;9:132. [DOI] [PMC free article] [PubMed] [Google Scholar]
- 42. White CL, Pistell PJ, Purpera MN, et al. Effects of high fat diet on Morris maze performance, oxidative stress, and inflammation in rats: contributions of maternal diet. Neurobiol Dis. 2009;35:3–13 [DOI] [PMC free article] [PubMed] [Google Scholar]
- 43. Yi CX, Tschöp MH, Woods SC, Hofmann SM. High-fat-diet exposure induces IgG accumulation in hypothalamic microglia. Dis Model Mech. 2012;5:686–690 [DOI] [PMC free article] [PubMed] [Google Scholar]
- 44. Davalos D, Ryu JK, Merlini M, et al. Fibrinogen-induced perivascular microglial clustering is required for the development of axonal damage in neuroinflammation. Nat Commun. 2012;3:1227. [DOI] [PMC free article] [PubMed] [Google Scholar]
- 45. Carreño-Müller E, Herrera AJ, de Pablos RM, et al. Thrombin induces in vivo degeneration of nigral dopaminergic neurones along with the activation of microglia. J Neurochem. 2003;84:1201–1214 [DOI] [PubMed] [Google Scholar]
- 46. Granholm AC, Bimonte-Nelson HA, Moore AB, Nelson ME, Freeman LR, Sambamurti K. Effects of a saturated fat and high cholesterol diet on memory and hippocampal morphology in the middle-aged rat. J Alzheimers Dis. 2008;14:133–145 [DOI] [PMC free article] [PubMed] [Google Scholar]
- 47. Freeman LR, Granholm AC. Vascular changes in rat hippocampus following a high saturated fat and cholesterol diet. J Cereb Blood Flow Metab. 2012;32:643–653 [DOI] [PMC free article] [PubMed] [Google Scholar]
- 48. Conde JR, Streit WJ. Microglia in the aging brain. J Neuropathol Exp Neurol. 2006;65:199–203 [DOI] [PubMed] [Google Scholar]
- 49. Vaughan DW, Peters A. Neuroglial cells in the cerebral cortex of rats from young adulthood to old age: an electron microscope study. J Neurocytol. 1974;3:405–429 [DOI] [PubMed] [Google Scholar]
- 50. Mato M, Ookawara S, Sakamoto A, et al. Involvement of specific macrophage-lineage cells surrounding arterioles in barrier and scavenger function in brain cortex. Proc Natl Acad Sci U S A. 1996;93:3269–3274 [DOI] [PMC free article] [PubMed] [Google Scholar]
- 51. Gao HM, Liu B, Zhang W, Hong JS. Critical role of microglial NADPH oxidase-derived free radicals in the in vitro MPTP model of Parkinson’s disease. FASEB J. 2003;17:1954–1956 [DOI] [PubMed] [Google Scholar]
- 52. Kaneko YS, Nakashima A, Mori K, Nagatsu T, Nagatsu I, Ota A. Microglial activation in neuroinflammation: implications for the etiology of neurodegeneration. Neurodegener Dis. 2012;10:100–103 [DOI] [PubMed] [Google Scholar]
- 53. Block ML, Zecca L, Hong JS. Microglia-mediated neurotoxicity: uncovering the molecular mechanisms. Nat Rev Neurosci. 2007;8:57–69 [DOI] [PubMed] [Google Scholar]
- 54. Trollor JN, Smith E, Agars E, et al. The association between systemic inflammation and cognitive performance in the elderly: the Sydney Memory and Ageing Study. Age (Dordr). 2012;34:1295–1308 [DOI] [PMC free article] [PubMed] [Google Scholar]
- 55. Maesako M, Uemura K, Kubota M, et al. Exercise is more effective than diet control in preventing high fat diet-induced β-amyloid deposition and memory deficit in amyloid precursor protein transgenic mice. J Biol Chem. 2012;287:23024–23033 [DOI] [PMC free article] [PubMed] [Google Scholar]
- 56. Ho L, Qin W, Pompl PN, et al. Diet-induced insulin resistance promotes amyloidosis in a transgenic mouse model of Alzheimer’s disease. FASEB J. 2004;18:902–904 [DOI] [PubMed] [Google Scholar]
- 57. Maesako M, Uemura K, Kubota M, et al. Environmental enrichment ameliorated high-fat diet-induced Aβ deposition and memory deficit in APP transgenic mice. Neurobiol Aging. 2012;33:1011.e11–1011.e23 [DOI] [PubMed] [Google Scholar]
- 58. Jeon BT, Jeong EA, Shin HJ, et al. Resveratrol attenuates obesity-associated peripheral and central inflammation and improves memory deficit in mice fed a high-fat diet. Diabetes. 2012;61:1444–1454 [DOI] [PMC free article] [PubMed] [Google Scholar]
- 59. Leboucher A, Laurent C, Fernandez-Gomez FJ, et al. Detrimental effects of diet-induced obesity on τ pathology are independent of insulin resistance in τ transgenic mice. Diabetes. 2013;62:1681–1688 [DOI] [PMC free article] [PubMed] [Google Scholar]
- 60. Moroz N, Tong M, Longato L, Xu H, de la Monte SM. Limited Alzheimer-type neurodegeneration in experimental obesity and type 2 diabetes mellitus. J Alzheimers Dis. 2008;15:29–44 [DOI] [PMC free article] [PubMed] [Google Scholar]
- 61. Studzinski CM, Li F, Bruce-Keller AJ, et al. Effects of short-term Western diet on cerebral oxidative stress and diabetes related factors in APP x PS1 knock-in mice. J Neurochem. 2009;108:860–866 [DOI] [PMC free article] [PubMed] [Google Scholar]
- 62. Becker K, Freude S, Zemva J, Stöhr O, Krone W, Schubert M. Chronic peripheral hyperinsulinemia has no substantial influence on tau phosphorylation in vivo. Neurosci Lett. 2012;516:306–310 [DOI] [PubMed] [Google Scholar]
- 63. Ungvari Z, Csiszar A. The emerging role of IGF-1 deficiency in cardiovascular aging: recent advances. J Gerontol A Biol Sci Med Sci. 2012;67:599–610 doi:10.1093/gerona/gls072 [DOI] [PMC free article] [PubMed] [Google Scholar]
- 64. Girouard H, Park L, Anrather J, Zhou P, Iadecola C. Cerebrovascular nitrosative stress mediates neurovascular and endothelial dysfunction induced by angiotensin II. Arterioscler Thromb Vasc Biol. 2007;27:303–309 [DOI] [PubMed] [Google Scholar]