The Independent Hearing Aid Fitting Forum (IHAFF) protocol was developed between 1993 and 1994 during numerous weekend meetings in Denver, Tampa, Anaheim and Chicago. The protocol was the brainchild of Dennis Van Vliet and Michael Marion, who were frustrated by the gap between the ever-evolving technology and the tools available for selecting, fitting and verifying the performance of hearing aids. As clinicians, they were concerned that there was a general lack of knowledge on how to appropriately determine if their patient was a better candidate for wide dynamic range compression, compression limiting, or compression in which the compressor is activated at an intermediate level. Further, they were concerned about the decisions that clinicians were being asked to make everyday which did not need to be made just a few years ago. For example, how to appropriately adjust the compression ratio (CR), compression kneepoint (KP), release time or output in one or more channels. In addition, they were concerned that the present prescriptive formulas, which are appropriate when fitting linear hearing aids, are not appropriate when fitting hearing aids with nonlinear signal processing. Finally, Dennis and Michael did not see any activity when attending professional meetings or reading professional journals which gave them any hope that relief for their concerns was forthcoming.
Due to these concerns, Michael and Dennis believed that it was necessary to gather colleagues together who might be able to develop a protocol to help clinicians better serve their patients when dispensing hearing aids containing both linear and nonlinear signal processing. The members of the IHAFF committee were Lucille Beck, Ruth Bentler, Robyn Cox, David Fabry, Gail Gudmundsen, David Hawkins, Mead Killion, Michael Marion, Gus Mueller, Larry Revit, Michael Valente and Dennis Van Vliet. Margo Skinner was an early member of the committee but had to leave because of other commitments.
As the reader can imagine, the discussions at these meetings were stimulating, challenging, intriguing, heated and controversial. Numerous fitting and verification strategies were discussed and discarded for a variety of reasons. For example, early discussions centered around referencing all measurements (threshold and loudness judgments) to dB SPL near the eardrum (i.e., SPL-O-GRAM). However, this idea was dropped because equipment was not available to perform these tasks in a clinically efficient manner at the time of the discussions. As the reader knows, such equipment is now available (i.e., the Madsen Auracle, Etymonic Design's AudioScan, Starkey Pro-Connect, ReSound's Real Ear Loudness Mapping (RELM) and Frye real ear analyzers). Discussions were also especially prolonged around the issue of “predicting” loudness judgments from threshold as opposed to individual measurement of loudness judgments. The final IHAFF protocol requires individual measurement of loudness scaling. Important considerations such as counseling, fine-tuning, aural rehabilitation, assistive listening devices, directional microphones, remote controls or digital volume controls were discussed, but it was decided not to include these issues in the final document.
The result of those meetings, phone calls, faxes and e-mail messages is the IHAFF protocol. The primary goal of the IHAFF protocol is to “normalize” the loudness experiences of the hearing-impaired patient. Specifically, the goals of the IHAFF protocol are:
Sounds judged as “soft” by a normal listener should be audible and judged as “soft” by a hearing-impaired listener who is wearing hearing aids.
Sounds judged as “comfortable” by a normal listener should be judged as “comfortable” by a hearing-impaired listener who is wearing hearing aids.
Sounds judged as “loud” by a normal listener should be judged as “loud”, but not “uncomfortably loud” by a hearing-impaired listener who is wearing hearing aids. Also, to prevent amplified sounds from exceeding the user's uncomfortable loudness level (LDL).
Typically for a cochlear-impaired listener, the use of compression and more than one processing channel will be needed to reach these goals. That is, less gain would be supplied at the higher input levels (compression) if the patient exhibits loudness recruitment, and greater compression might well be needed in the high frequency region where typically the dynamic range between threshold and UCL is reduced in comparison to the dynamic range in the low frequency region.
This issue of Trends in Amplification is dedicated to providing the reader with a better knowledge of how to implement the IHAFF protocol. The manuscript is divided into two sections. The first section describes, in detail, how to operate the software that has been developed to assist the user to implement the IHAFF protocol. The second section illustrates the implementation of the IHAFF protocol by “walking through” the entire process with one of our patients.
THE IHAFF DOCUMENTATION AND SOFTWARE
The IHAFF protocol is delivered with a 3 1/2″ floppy disk (Version 1.1a) and a 41-page manual. The information provided within this manuscript is intended to provide an abbreviated version of the IHAFF manual. If the reader feels they require additional information they can write Dennis Van Vliet at 17021 Yorba Linda Blvd, Suite #130, Yorba Linda, CA 92886 to receive more information on how to obtain a copy of the manual and the disk. Finally, to use a mouse to activate functions in the IHAFF suite, mouse drivers must be loaded in DOS.
Downloading the Software
When the software arrives, it is easier to use the IHAFF protocol off the hard drive (usually the “C” drive) than to operate the IHAFF protocol from the floppy drives (usually the “A” and/or “B” drive). To download the software onto the “C” drive, complete the following steps:
Place the IHAFF disk in the “A” or “B” floppy drive.
At the “C” prompt (C:\>) type: “MD IHAFF”. This creates a new sub-directory. Press the ENTER button.
Type “CD\IHAFF” and press ENTER. This command changes to the IHAFF directory. At this point, C:\IHAFF> should appear on the monitor.
Type “Copy A:\∗.∗”. At this point the reader should see a listing of the files copied to the “C” drive from the “A” drive.
When the copying process is complete, type “CAV” and the reader should enter the IHAFF suite. The “CAV” acronym is short for Contour, APHAB and Viola which are sub-menus within the IHAFF suite.
IHAFF Menus
It might be helpful at this point to provide the reader with an overview of the functions for the six main menus of the IHAFF suite which appear along the top of the screen. The various menus can be accessed by clicking on the menu with a mouse or pressing the [Alt] key in combination with the highlighted letter for the menu. For example, [Alt] + “F” will access the “File” menu. To move across the main menu, the reader can use the < or > arrow keys. The F1 key will access a “Help” menu and [Alt] + “X” will exit the IHAFF suite. Several menus require input from the clinician (for example, the “File” and “Setup” menus). In these cases, the clinician interacts with a “dialog box”. The clinician can move around the dialog box either with the mouse or by pressing the [Tab] key. Pressing [Shift] + [Tab] will move the cursor in the opposite direction. Pressing the [Enter] key will accept and save the entered data (“O.K.”) and pressing the [Esc] key will prevent data from being saved (“Cancel”). In the dialog boxes there may be four different forms of input from the clinician. There may be a “radio button” () which the clinician will click in order to set that option. For example, in the Stimulus sub-menu of the Contour menu there is a radio button for the clinician to click if they want the entered thresholds to be in dB SPL or dB HL. There may be “check boxes” [ ] to highlight your selection, after which the user can press the spacebar to toggle the selection “on” and “off”. There are “input lines” where the clinician can enter text (for example, comments). Finally, there are “push buttons” such as “OK” or “Cancel”.
A. File Menu
This menu is used to Create new patient files (up to eight characters), Load an old patient file (the user can either type the file name or highlight the filename in the “Files” window), Save the current patient file or save the current file and provide a New name for the file. This latter option activates the “Save data file as” dialog box and is used to save a copy of the data file under a different file name. Thus, there will be two copies of the data file under two different file names.
B. Patient Information Menu
This is the menu where the clinician, after opening a new file, can enter the name of the patient, date of birth (DOB), date of service, social security number (SSN), identification number (ID#) and the name of the clinician. There is also a section for the clinician to write in any pertinent comments.
C. Contour Menu
This menu is where the clinician enters the thresholds (dB HL) measured with an insert earphone at 250, 500, 1000, 2000, 3000 and 4000 Hz for each ear. The clinician can measure thresholds using conventional earphones (i.e., TDH series), but the insert earphone is the preferred transducer because it is calibrated re: a 2 cm3 coupler. This is important because data (i.e., loudness scaling via the Contour test and the results from the Visual Input/Output Locator Algorithm or VIOLA) entered into the IHAFF software are referenced to the performance of the hearing aid measured in a 2 cm3 coupler. This is also the menu where the clinician accepts the default corrections for converting the dB HL thresholds into dB SPL as measured in a HA-1 2 cm3 coupler. For example, if the entered values were 20 dB HL at 250, 500, 1000, 2000, 3000 and 4000 Hz, then the software automatically converts the entered dB HL thresholds into values which would have been measured in a HA-1 2 cm3 coupler. In this example, the resulting values would be 35.5, 28.5, 23.5, 26.5, 25.5 and 21.5 dB SPL (ANSI S3.6-1989). On the other hand, if the data were entered using a TDH-39 headset, the resulting values would be 40.7, 29.9, 25.5, 25.2, 25.7 and 19.5 dB SPL (Hawkins, 1992). If the data were entered using a TDH-49 or 50 headset, the resulting values would be 41.7, 31.9, 26.0, 27.2, 25.2, and 20.5 dB SPL (Hawkins, 1992). However, since the publication of the IHAFF protocol, ANSI-1996 (ANSI, S3.6-1996a) has been released. This new standard would convert the same 20 dB HL measured using an insert earphone into values of 34.5, 26.0, 20.0, 22.5, 29.5 and 20.0 dB SPL. Future updates of the IHAFF software will probably incorporate this change.
It is the belief of the authors that the clinician should take the time to measure the calibrated values of the insert earphone used in their clinic just as clinicians are required to measure the performance of conventional earphones in a 6 cm3 coupler to assure that the audiometer adheres to the current ANSI-1996 (ANSI S3.6-1996a) standard. The individual clinic values can be entered into the IHAFF suite. To calibrate an insert earphone, the clinician would simply couple the bottom of the foam eartip (be certain it is thoroughly sealed) to the top of the HA-1 coupler so that the eartip opening is centered over the cavity sound inlet hole. With the attenuator dial reading held constant at 70 dB HL, the output measured in the 2 cm3 coupler should be 84.5 dB SPL at 250 Hz, 76.0 dB SPL at 500 Hz, 70.0 dB SPL at 1000 Hz, 72.5 dB SPL at 2000 Hz, 72.5 SPL dB at 3000 Hz and 70 dB SPL at 4000 Hz. ANSI S3.6-1996 allows for the measured value to be within +/− 3 dB of the standard value at 125–5000 Hz and within +/− 5 dB at 6000 Hz and higher.
Using this procedure, the insert earphone in our clinic had measured values of 86.0, 77.0, 72.0, 73.0, 73.0, and 72 dB SPL for the left earphone and 86.0, 77.0, 73.0, 73.0, 73.0 and 71.0 dB SPL for the right earphone at 250–4000 Hz. Thus, in this menu of the software the authors replaced the default values with the values measured for our insert earphone connected to the audiometer used for measuring threshold and loudness judgments. As the reader can see, the insert earphones in our clinic were within the allowable range from 250 to 4000 Hz for both earphones, but slightly different from the default values. Finally, insert earphones are delivered with either 10 or 50 ohm input impedance. It is important for the input impedance of the insert receiver to correctly match the load impedance at the output of the audiometer. For example, the 10 ohm insert earphone should be used with the following audiometers:
Amplaid
Beltone: all but 100 series
Dahlberg
GSI 1701
Qualitone
Madsen
Maico 32/41 portables
Saico
Tracor RA-216
On the other hand, the 50 ohm insert earphone should be used with the following audiometers:
Beltone 100 series
Fonix 3100
Frye FA 10
GSI 10,16, 61 and 1702
If the reader has any doubt as to which insert earphone is correct for their audiometer he or she may contact Etymotic Research, 61 Martin Lane, Elk Grove Village, IL 60007 (708) 228-0006, FAX (708) 226-6836.
This menu is also used to inform the software if the entered values are measured in dB HL (the software automatically converts the dB HL values to dB SPL in an HA-1 2 cm3 coupler) or if the clinician has already completed the conversion on the Contour worksheet (to be discussed later). In this latter case, the conversion is not completed by the software. This menu reports the measured dB SPL values for each of the seven loudness categories (“very soft (vs)”, “soft (sft)”, “comfortable, but slightly soft (css)”, “comfortable (com)”, “comfortable, but slightly loud (csl)”, “loud, but O.K. (lok)” and “uncomfortably (ucl)”) which were measured when the Contour test was performed automatically via the software with the audiometers mentioned below. This menu also allows the clinician to control how long the patient has to respond (in milliseconds) to the stimuli when the Contour test is performed automatically via a computer connected to select audiometers (Madsen OB 822, Frye FA-10, Fonix 3100, GSI 10 and 16 and the Beltone 2000). Finally, this menu allows the clinician to view the loudness results in the form of equal loudness contours illustrating threshold and the seven loudness categories mentioned above for the frequencies (at a minimum; 500 and 3000 Hz are recommended) and ear(s) in which the Contour test was performed. Unfortunately, the equal loudness contours cannot be printed because a print option is not available within this segment of the IHAFF suite. However, generic screen dump programs may be used if the user wants a printout of the equal loudness contours. Finally, the Contour Test has undergone revisions by Robyn Cox, Ph.D. at her Hearing Aid Research Laboratory at the University of Memphis since the publication of the IHAFF protocol. These revisions can be obtained by contacting Robyn Cox, Ph.D. at www.ausp.memphis.edu/harl.
D. VIOLA (Visual Input/Output Locator Algorithm) Menu
This menu allows the clinician to configure, graph and print the VIOLA results. The Configure sub-menu allows the clinician to enter the thresholds values (dB HL) for the seven loudness categories from the Contour worksheet for each ear and for each test frequency. The Hearing aid type sub-menu allows the clinician to specify whether the fitting is a behind-the-ear (BTE), in-the-ear (ITE), in-the-canal (ITC) or completely-in-the-canal (CIC) hearing aid. This allows the software to make the necessary corrections for differences in SPL in microphone locations between the four hearing aid designs. This sub-menu also allows the clinician to determine whether he/she wants the calculations for the resulting VIOLA input/output graphs to be based upon the Pearsons SPL (default) (Pearsons et al, 1977) or for overall input levels of 40, 65 and 90 dB SPL or 40, 65 and 105 dB SPL. Cox (personal communication, 1997) reports that the data provided by using the Pearsons SPL input levels are more accurate and should always be used.
The Graph sub-menu allows the clinician to see the VIOLA input/output graphs. These will be described in greater detail later. However, for now, this is where the clinician determines and enters the required gain at 40 dB, the first compression kneepoint (KP1), the first compression ratio (CR1), the second compression kneepoint (KP2), the second compression ratio (CR2) and the maximum output for each of the test frequencies.
The Print sub-menu allows the VIOLA graphs to be printed for each ear. There are two input/output frequencies plotted per printout. To assist in choosing the frequency-gain response of the hearing aid, the software automatically calculates the gain at 60 dB SPL and the slope of the input/output curve (dB/octave). Finally, VIOLA has undergone revisions by Robyn Cox, Ph.D. at her Hearing Aid Research Laboratory at the University of Memphis since the publication of the IHAFF protocol. These revisions can be obtained by contacting Robyn Cox, Ph.D. at www.ausp.memphis.edu/harl.
E. APHAB (Abbreviated Profile of Hearing Aid Benefit) Menu
The Questionnaire sub-menu allows the clinician to enter information about the patient in the Patient information sub-menu. This includes the name of the patient, which form was used (A or B) and allows for some general comments. This sub-menu also allows the clinician to enter the hearing aid experience of the patient (< 6 weeks; between 6 weeks to 11 months; 1–10 years or > 10 years), how long the patient uses the hearing aids each day (< 1 hour; 1–4 hours; 4–8 hours; 8–16 hours), and the age of the patient (< 35 years; between 35–49 years; between 50–64 years; > 65 years). Finally, this sub-menu asks the clinician to specify whether he/she is going to enter the APHAB results for the unaided condition only, aided condition only, or both conditions.
The Clinician edit sub-menu allows the clinician to enter the data (letters A-G) from the APHAB scoresheet after the patient has completed the unaided and/or aided conditions. The Client edit sub-menu allows the patient to answer the 24 APHAB items for the unaided and aided conditions using the keyboard of the computer.
The Options sub-menu allows the clinician to view (Graph) and Print the unaided problem score, aided problem score and the benefit scores for the ease of communication (EC), reverberation (RV), background noise (BN) and aversiveness of sounds (AV) subscales. The results can be viewed in tabular (unaided and aided problem scores and benefit score) or graphic format. This will provide the patient's unaided and aided problem scores in comparison to the 20th and 80th percentile rank; and the patient's benefit score in comparison to the 5th, 20th, 35th, 50th, 65th, 80th and 95th percentile rank for each of the four subscales.
F. Setup Menu
This menu allows the clinician to specify if the software will be communicating with an audiometer. IHAFF allows a computer interface via connection to the serial port of the audiometers mentioned above for automatic measurement of the Contour test. If the clinician does not have an audiometer with this capability then he/she can perform the Contour test manually using the worksheet which will be described later. This sub-menu also allows the clinician to inform the software which port (COM 1 or 2) will be used to connect the audiometer to the computer to perform the automatic Contour test, which port (LPT 1, 2 or 3; COM 1 or 2) the printer is connected to, and whether the printer is an Epson 9 or 25 pin printer or an HP laserjet II or III. Finally, this sub-menu allows the clinician to decide if the resolution of the printing is to be low, mid or high.
EXAMPLE OF THE IHAFF PROTOCOL IMPLEMENTED ON A PATIENT
Full implementation of the IHAFF protocol is composed of ten steps. The ten steps include:
Pre-fitting measurements
Loudness growth measurement using the Contour Test
Administering an inventory of unaided communication problems (APHAB)
Selecting a hearing aid using VIOLA
Fitting and verification using 2 cm3 coupler measures and adjustments
Presenting warble-tones in sound-field at 20–30 dB HL
Presenting speech in sound-field at 65 and 85 dB SPL
Real ear aided measures (REAR) using a composite signal ranging from 50 to 80 dB SPL
Real ear measures using a 90 dB SPL pure-tone sweep (RESR90)
Measurement of fitting outcome using the aided APHAB to determine a benefit score
A. Pre-Fitting Measurements
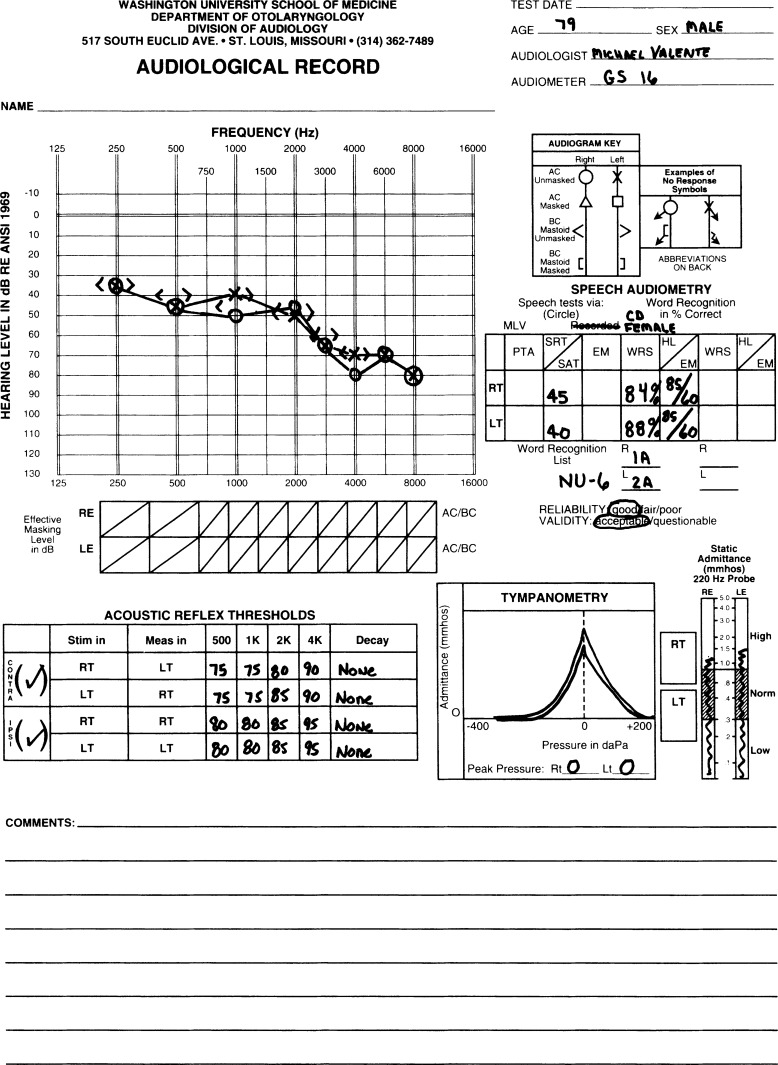
Figure 1 reveals the audiogram for a 79 year-old retired physician. Thresholds were measured with a 50 ohm insert earphone and the results revealed a mild to moderate-severe bilaterally symmetrical sensorineural hearing loss gradually sloping in configuration Speech audiometry revealed a bilateral moderate loss for the speech recognition threshold (terminology re: ANSI S3.6-1996a) and was consistent with the pure-tone results. Word recognition scores revealed slight difficulty bilaterally using a compact disc (CD) recording of the NU-6 words lists spoken by a female talker. Tympanometry revealed slightly elevated static compliance bilaterally due to monomeric eardrums reportedly resulting from eardrum perforations following otitis media during childhood. Acoustic reflex thresholds to contralateral and ipsilateral stimulation at 500–4000 Hz were indicative of cochlear pathology. The patient has worn binaural hearing aids for many years, but most recently he has worn binaural two-memory digitally programmable ITE hearing aids with full dynamic range compression.
Figure 1.
Audiogram for the sample patient used to illustrate the IHAFF protocol
B. Loudness Growth Measurement Using the Contour Test
As mentioned earlier, the loudness growth measurements of the IHAFF protocol was considered by the IHAFF members to be essential in order to appropriately select the compression characteristics of hearing aids. Much discussion was centered on whether or not the IHAFF protocol should recommend that loudness judgments be predicted from the audiometric thresholds or whether or not the group should recommend individual measures of loudness judgments. Although not all members of the committee were in agreement, the final decision was to strongly recommend the individual measurement of loudness scaling. This was based on the large volume of research which reported the inability to adequately predict individual loudness judgments from threshold (Kamm et al, 1978; Dillon et al, 1984; Hawkins et al, 1987; Pascoe, 1988; Valente et al, 1994; Valente et al, 1997).
The loudness growth procedure recommended by the IHAFF protocol is the Contour Test developed at the Hearing Aid Research Laboratory at the University of Memphis. As mentioned earlier, the Contour Test can be performed automatically via the IHAFF software and the specific audiometers mentioned earlier, or the Contour Test can be performed manually and the values later entered into the software. The Contour test can be performed at as many frequencies as are desired between 250 and 4000 Hz, but at a minimum, 500 and 3000 Hz are recommended. These two frequencies are recommended for several reasons. First, they represent typical mid-points for low and high frequency channels in a two-channel hearing aid. Second, evaluating at least 500 and 3000 Hz was based on the need to evaluate the low frequency region (i.e., 500 Hz) where the dynamic range is typically wide and the high frequency region (i.e., 3000 Hz) where the dynamic range is typically narrow. Finally, these two frequencies were selected to “sample” a low and high frequency region so as to make decisions whether or not to use compression in either or both channels in hearing aids having two-channels. It takes approximately five minutes per frequency to administer the Contour test after the clinician has gained some experience. Thus, the Contour test can add approximately 20 minutes for a binaural fitting. The members of the IHAFF committee felt a twenty minute investment of “up-front time” would be a good investment in reducing adjustment problems after the fitting.
For these measurements, the stimuli are frequency specific pulsed warble tones from 250 to 4000 Hz in octave and mid-octave intervals or speech noise. The stimulus duration is 200 milliseconds for warble tones and 4–5 seconds for speech noise. The procedure utilizes an ascending approach and the starting level is approximately 5 dB above threshold. The loudness scaling test at any frequency ends when the patient indicates that the loudness of the stimulus is “uncomfortable” (i.e., #7). If the hearing threshold at a frequency is less than 50 dB HL (i.e., wide dynamic range) then the step size for each presentation is 5 dB. On the other hand, if the threshold is 50 dB HL or poorer (i.e., narrow dynamic range) then the step size is 2 or 2.5 dB. There is one practice run at 1000 Hz. The initial IHAFF documentation recommended four ascents at each test frequency, but the revised IHAFF protocol recommends three ascents per test stimulus. The level assigned to each loudness category (#1 through #7) is the median value of intensity levels assigned to that category across the three runs. The recommended transducer is the insert earphone. The instructions to the patient are as follows:
“The purpose of this test is to find your judgments of the loudness of different sounds. You will hear sounds that increase and decrease in volume. You must make a judgment about how loud the sounds are. Pretend you are listening to the radio at that volume. How loud would it be? After each sound, tell me which of these categories best describes the loudness. Keep in mind that an uncomfortably loud sound is louder than you would ever choose on your radio no matter what mood you are in”.
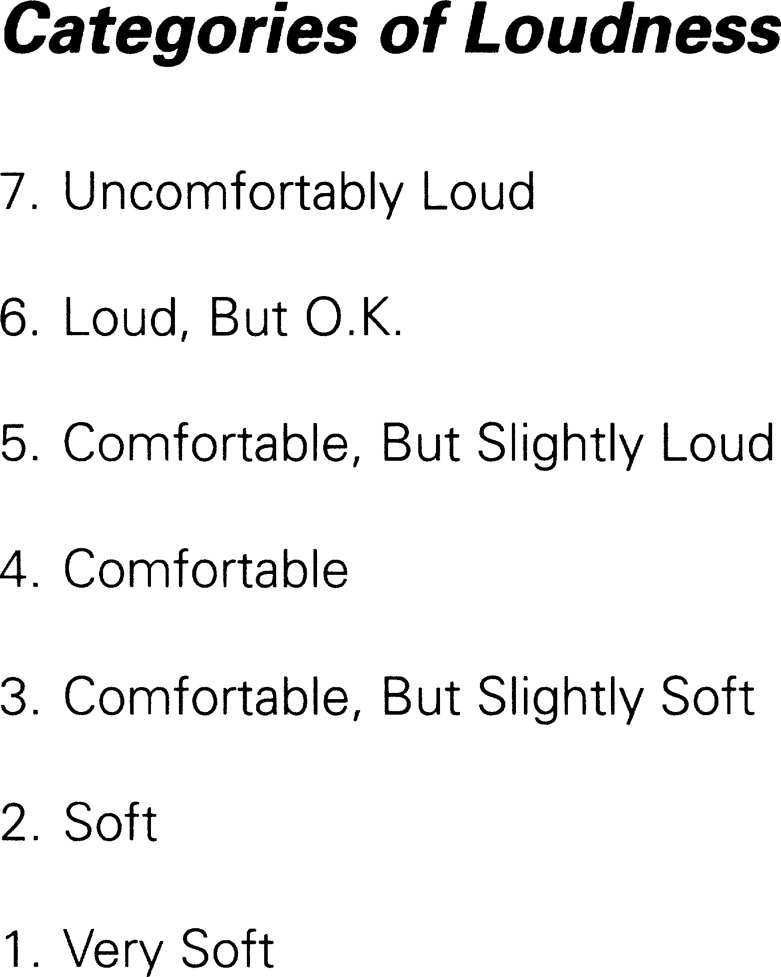
Figure 2 illustrates the seven loudness categories along with the assigned numerical value. This sheet is provided to the patient as the loudness scaling procedure is implemented. The patient has the choice of calling out the number (#1–7) or calling out the specific category which adheres to his/her perception of the loudness of the signal.
Figure 2.
Loudness categories used in the IHAFF protocol.
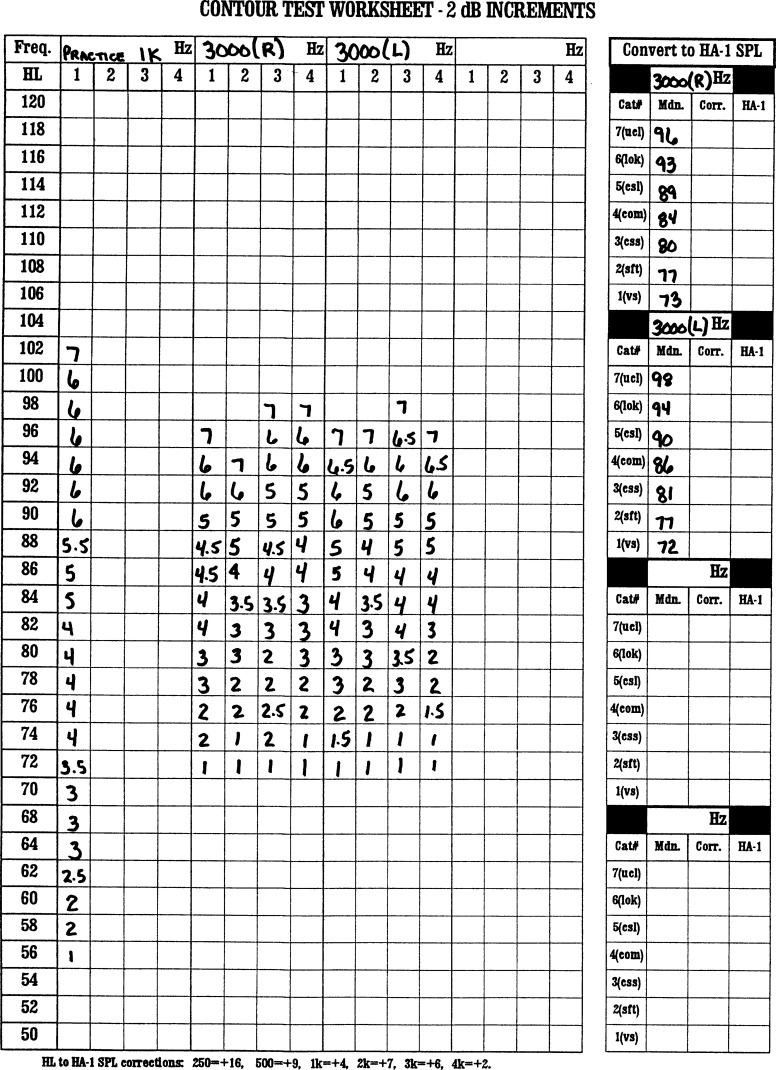
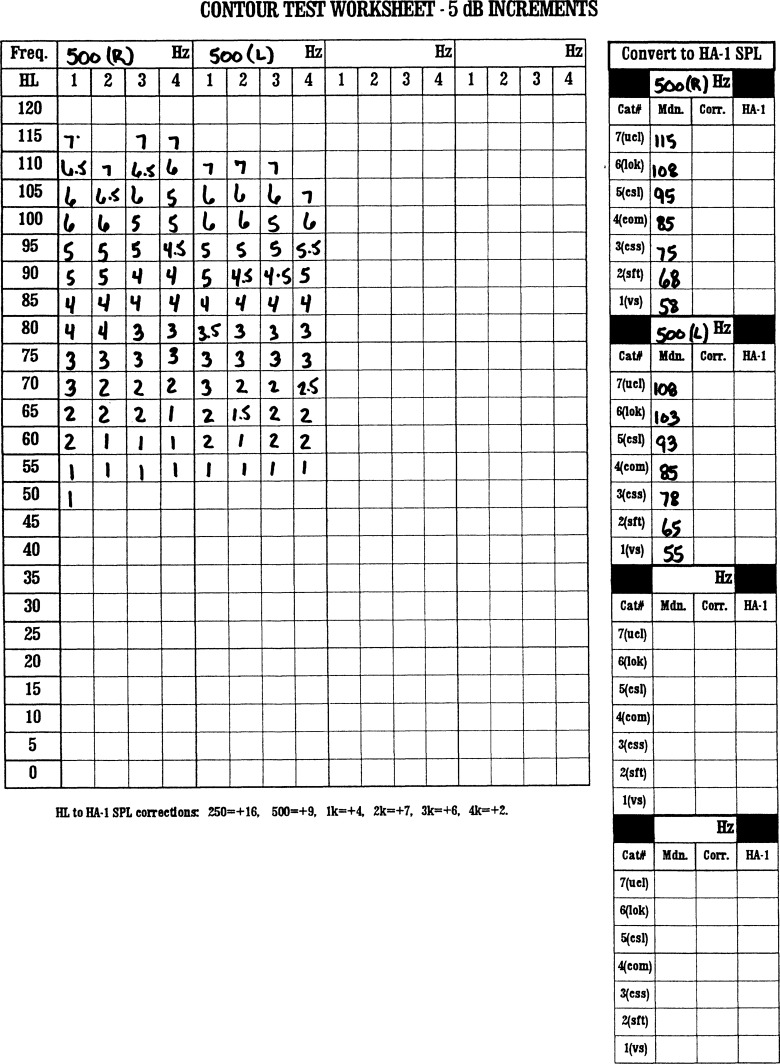
Figures 3 and 4 reveal the results of the Contour test for our sample patient. Figure 3 reveals the practice run at 1000 Hz as well as the results at 3000 Hz for each ear. Note that the 2 dB worksheet was used because the threshold at 3000 Hz was 65 dB HL. The practice run for the right ear at 1000 Hz began at 56 dB HL because his threshold was 50 dB HL. At this presentation level, the patient reported that the loudness was a #1 (very soft). The stimulus was increased in 2 dB steps. For each increase a number was placed in the box corresponding to the patient's loudness judgment. The intensity was increased until the patient reported that the stimulus evoked a loudness judgment of #7 (uncomfortable). In this case, the intensity level evoking a response of #7 was 102 dB HL. This same procedure was followed at 3000 Hz for the right and left ears. For each ear, the starting point was 72 dB HL because threshold was 65 dB HL. The intensity was increased in 2 dB steps and for each presentation the subject reported a loudness judgment and that number was placed in the appropriate box. Each of the four ascents for each ear stopped when the intensity level evoked a response of #7. Note that in some cases the patient selected a point halfway between categories (e.g., “4” or “5” would be recorded as a “4.5”)
Figure 3.
Contour worksheet at 3000 Hz for the sample patient.
Figure 4.
Contour worksheet at 500 Hz for the sample patient.
At the box to the right (“convert to HA-1 SPL”), the median value for each of the seven loudness categories is placed. Thus, for the right ear at 3000 Hz, the median value for “very soft” was 73 dB HL, while the median value for “uncomfortable” was 96 dB HL. This results in a dynamic range 23 dB wide. For the left ear, the median value for “very soft” was 72 dB HL, while the median value for “uncomfortable” was 98 dB HL, resulting in a dynamic range 26 dB wide, g Figure 4 reports the same information at 500 Hz for each ear. Notice that the 5 dB worksheet was used because the thresholds at this frequency were less than 50 dB HL. In the boxes to the right, note that the dynamic range for the right ear is 57 dB wide (115–58), while the dynamic range for the left ear is 53 dB wide (108-55).
The audiometric thresholds (in dB HL) for the right and left ears are entered into the Contour menu of the IHAFF software. The software automatically converts these values into dB SPL in an HA-1 2 cm3 coupler based on the “audiometer correction” values which are in the boxes to the right in that menu. Also, be sure to check the “dB HL” box at the lower left of the screen so that the software is aware that the values entered from the keyboard are in dB HL and not in dB SPL. The values in the “audiometer correction” boxes are the default values for converting dB HL to dB SPL in an HA-1 coupler based on the interim values reported in the ANSI-1989 standard. These are the same values appearing at the bottom of the Contour worksheet. However, as mentioned earlier, the reader should replace these values by typing in the values reported in ANSI-1996 (ANSI 1996a) and cited above, or, better yet, check the calibration of your insert earphone and place these values in the boxes. If the clinician utilized TDH 39 headsets, then the values of 20.7, 9.9, 5.5, 5.2, 5.7 and −0.5 dB SPL (Hawkins, 1992) should be placed in the “audiometer correction boxes for 250, 500, 1000, 2000, 3000 and 4000 Hz, respectively. On the other hand, if the clinician used TDH 49 or 50 headsets, then the values of 21.7, 11.9, 6.0, 7.2, 5.2 and 0.5 dB SPL (Hawkins, 1992) should be placed in the “audiometer calibration” box. At this point, the clinician can place the cursor over the “Graph” sub-menu of the Contour menu and the equal loudness contours for each ear at the test frequencies can be viewed.
The median values in the “convert to HA-1 SPL” boxes on the Contour worksheet are then entered into the Configure sub-menu in the Viola menu. These values are entered for each loudness category into the appropriate boxes at each test frequency and each ear. The clinician must also click onto the radio button to indicate which type of hearing aid will be selected (BTE, ITE, ITC or CIC) and which speech level (default is “Pearson SPL”) the clinician wants the VIOLA software to calculate the input/output curves. For our patient, the authors selected a ITE fitting and the “Pearson SPL”.
C. Unaided APHAB
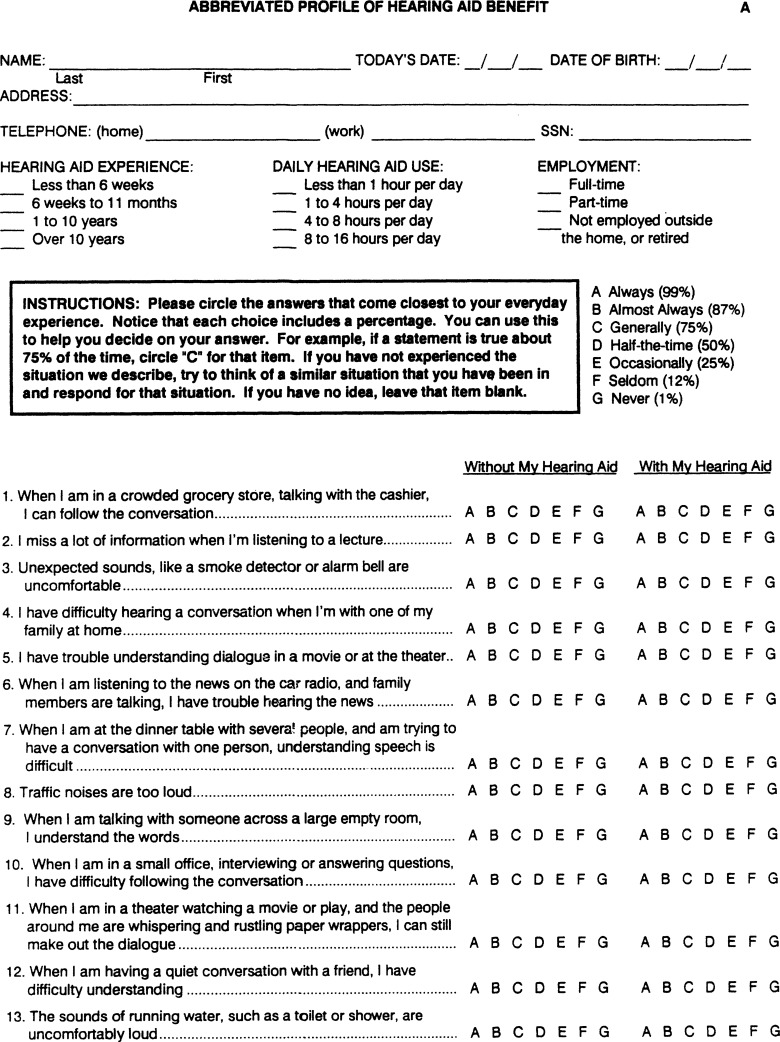
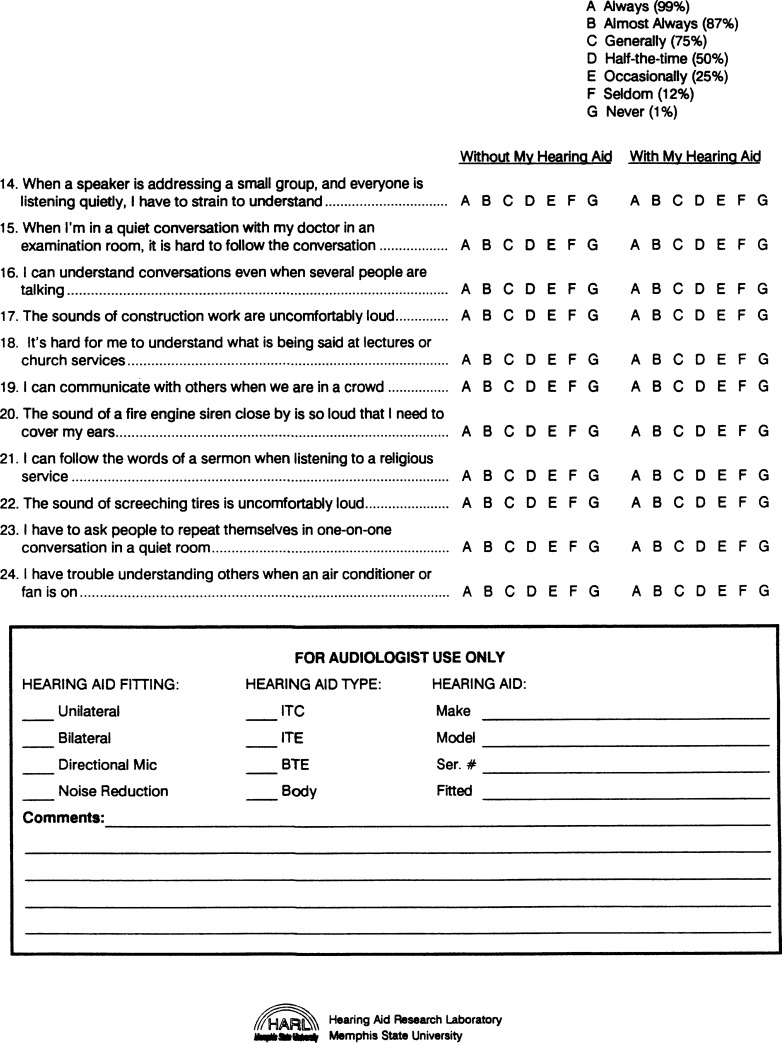
One of the major accomplishments of the IHAFF protocol is the inclusion of a standardized measure of hearing aid benefit to serve as a mechanism to verify the performance of the hearing aids. The outcome measure selected by the IHAFF protocol is the Abbreviated Profile of Hearing Aid Benefit (APHAB) (Cox and Alexander, 1995). The APHAB (see Figure 5) is a self-assessment inventory in which patients report the amount of trouble they are experiencing in a variety of communication situations or with environmental sounds. The APHAB was designed to serve as a standardized test to quantify the disability associated with the hearing impairment of the patient. The APHAB consists of 24 items that are scored in four subscales (ease of communication or EC; reverberant conditions or RV; background noise or BN and aversiveness to loud sounds or AV). For each subscale there is an unaided problem score (in %), aided problem score (in %) and the resulting benefit score (unaided - aided). If the resulting benefit score is positive, then performance with the hearing aid was perceived as being better than the performance without the hearing aid. If the resulting benefit score is negative, then the performance with the hearing aid was perceived as being poorer than the performance without the hearing aid.
Figure 5.
APHAB questionnaire (Form A). (Reprinted with permission from Robyn M. Cox).
For each item, the patient is asked to circle a letter between A to G which states how often the patient thinks the statement is true. For example, circling the letter “A” would indicate a response of “Always” or 99% of the time; a “B” would indicate a response of “Almost Always” or 87% of the time; a “C” would indicate a response of “Generally” or 75% of the time; a “D” would indicate “Half the time” or 50% of the time; a “E” would indicate “Occasionally” or 25% of the time; a “F” would indicate “Seldom” or 12% of the time and a “G” would indicate “Never” or 1% of the time. The patient is instructed as follows:
“Please circle the answers that come closest to your everyday experience. Notice that each choice includes a percentage. You can use this to help you decide your answer. For example, if a statement is true 75% of the time, circle “C” for that item. If you have not experienced the situation we describe, try to think of a similar situation that you have been in and respond to that situation. If you have no idea, leave that item blank.”
The patient is also reminded to read each item carefully because sometimes a response of “always” means a lot of problems and sometimes a response of “always” will mean few if any problems. If a patient is having difficulty understanding the questionnaire, the clinician can help him/her complete it.
It is highly recommended that the unaided APHAB be administered before or at the time the hearing aids are initially fit. The aided segment is administered after the patient has had the time to wear the hearing aids for two to five weeks to allow for possible acclimatization effects and ensure that the patient has had adequate experience to judge the performance of the hearing aids. To maximize validity and reliability, the patient should be allowed to view his/her responses to the unaided portion while completing the aided portion. In addition, the patient should be urged to review their responses to the unaided portion and be allowed to change his/her response if he/she feels it is necessary. The unaided and aided data (letters A-G for each of the two conditions) are entered into the APHAB menu (Client or Clinician edit) and the software calculates the unaided problem score, aided problem score and the benefit score for each of the four subscales. The Client edit allows the clinician to enter his/her responses to the 24 questions of the APHAB via the keyboard, while the Clinician edit allows the clinician to enter the responses of the patient from the APHAB score sheet. The interpretation of these results will be discussed in greater detail in section J (Aided APHAB and Benefit Scores).
D. Hearing Aid Selection Using VIOLA
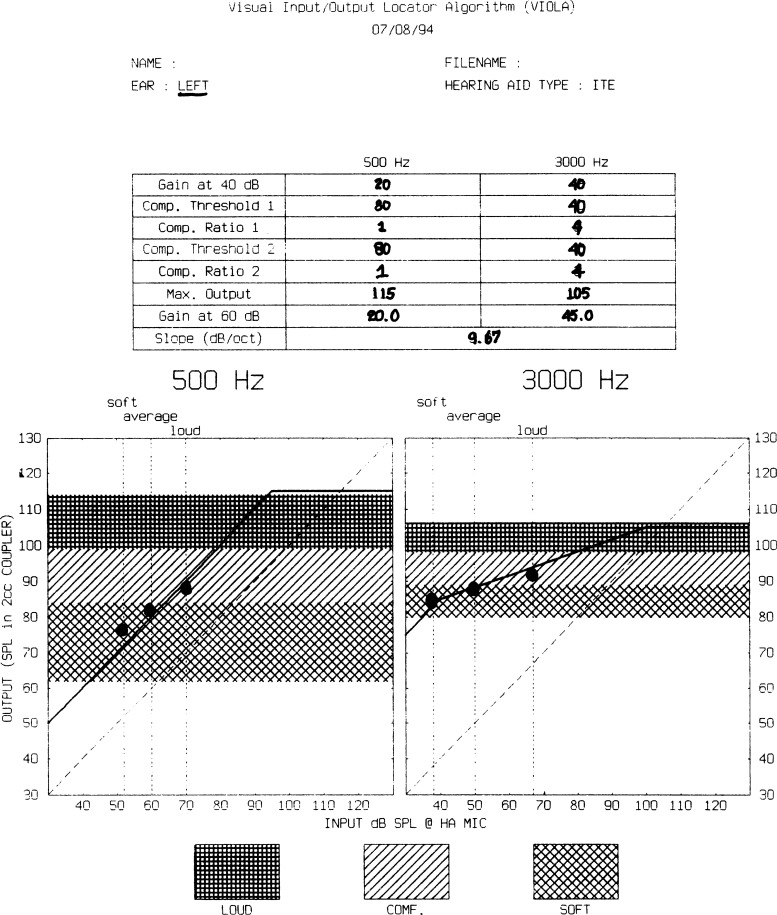
Figure 6 reveals the VIOLA graph for the left ear for our sample patient. However, in the initial VIOLA graph on the monitor, the values in Figure 6 in the various boxes under 500 and 3000 Hz as well as the solid line intersecting the three “dots” do not appear. The authors will describe in the next section the meaning of these values as well as the intersecting line. This VIOLA graph is the tool used by the clinician to determine the electroacoustic characteristics of the hearing aid to allow “soft” speech (overall level = 50 dB SPL) to be judged as “soft” and be audible; to allow “average” speech (OL = 65 dB SPL) to be judged as “comfortable” and to allow “loud” speech (OL = 85 dB SPL) to be judged as “loud, but O.K.” To create the VIOLA graph, the intensity levels (dB HL) for the right and left ear at 500 and 3000 Hz for the seven loudness categories from the Contour worksheet are entered into the Configuration sub-menu of the Viola menu. Data may only be entered in this area if “non attached” is selected under the Setup for audiometers. Then the Graph sub-menu is accessed and the graph the reader sees in Figure 6 appears on the monitor.
Figure 6.
Initial VIOLA graph for the left ear for the sample patient.
The following is provided to help the reader better understand how to use the VIOLA graph:
Each “VIOLA graph” represents an input/output performance of the hearing aid as measured in an HA-1 2 cm3 coupler at one frequency. The “x” axis represents the input intensity at the microphone of the hearing aid. Remember that the type of hearing aid fit (BTE, ITE, ITC or CIC) was entered earlier in the Configuration sub-menu of the Viola menu. The “y” axis represents the output measured in an HA1-2cm3 coupler. The dashed diagonal line is a “zero-gain locus“. The vertical difference between each dot and the vertical line is the required coupler gain at that input level to achieve the goals of IHAFF.
There is one “VIOLA graph” for each of the two frequencies tested during the Contour test.
The lower hatched area represents the “soft zone” (i.e., “very soft”; “soft”; “comfortable, but slightly soft”); the middle hatched area represents the “comfortable zone” (i.e., “comfortable, but slightly soft”; “comfortable”; “comfortable, but slightly loud”) and the upper hatched area represents the “loud zone' (i.e., “comfortable, but slightly loud”; “loud, but O.K.”, “uncomfortably loud”) for the frequency-specific warble tones. In Figure 6, the range from the lower level of the “soft zone” (∼65 dB SPL at 500 Hz and ∼80 dB SPL at 3000 Hz) to the upper level of the “loud zone” (∼115 dB SPL at 500 Hz and 106 dB SPL at 3000 Hz) represents the listener's dynamic range. It is apparent in Figure 6 that the dynamic range at 500 Hz is considerably wider than the dynamic range at 3000 Hz as is typical of many cochlear-impaired patients who have greater loudness recruitment and greater sensitivity loss in the higher frequencies.
-
Note that the first dot, which represents the targeted output for “soft speech” (overall input level = 50 dB SPL), resides in the lower range of the “soft” zone for both 500 and 3000 Hz. “Soft” speech is defined as a level that is 5 dB lower than the levels produced by talkers speaking at “casual” vocal effort in an anechoic room. At this level the 1/3 octave band levels in the free-field at one meter in front of the speaker are 40, 42, 32, 30, 27, and 28 dB SPL at 250, 500, 1000, 2000, 3000 and 4000 Hz. Further, note that the second dot, which represents the targeted output for “average speech” (overall input level = 65 dB SPL), resides in the upper section of the “soft” zone. “Average” speech is defined as the mean level of talkers speaking with “normal” and “raised” vocal effort. At this level, the 1/3 octave band levels in the free-field at one meter in front of the speaker are 55, 58, 53, 48, 45 and 43 dB SPL at 250, 500, 1000, 2000, 3000 and 4000 Hz. Finally, notice that the third dot, which represents the targeted output for “loud speech” (overall input level = 85 dB SPL), resides in the middle of the “comfort” zone. “Loud” speech is defined as being 5 dB higher than the mean level of talkers speaking at “loud” and “shouted” vocal effort. At this level, the 1/3 octave band levels in the free-field at one meter in front of the speaker are 66, 74,76, 72, 68, and 56 dB SPL at 250, 500,1000, 2000, 3000 and 4000 Hz.
The calculations used for placing the “dots” are based on the data in the following table (Cox, 1995):Frequency Soft Average Loud 250 .01(s) .50(s) .87(s) 500 .39(s) .90(s) .48(c) 1000 .24(s) .85(s) .67(c) 2000 .29(s) .82(s) .64(c) 3000 .27(s) .82(s) .59(c) 4000 .26(s) .71(s) .50(c) For example, for a “soft” speech signal, the 500 Hz 1/3 octave band should be amplified to a point that is .39 of the range of the patient's “soft” (s) judgment for warble tones. Fortunately, the reader does not have to be concerned about these calculations because the software performs these calculations automatically once the data from the Contour test has been entered into the VIOLA Configure sub-menu.
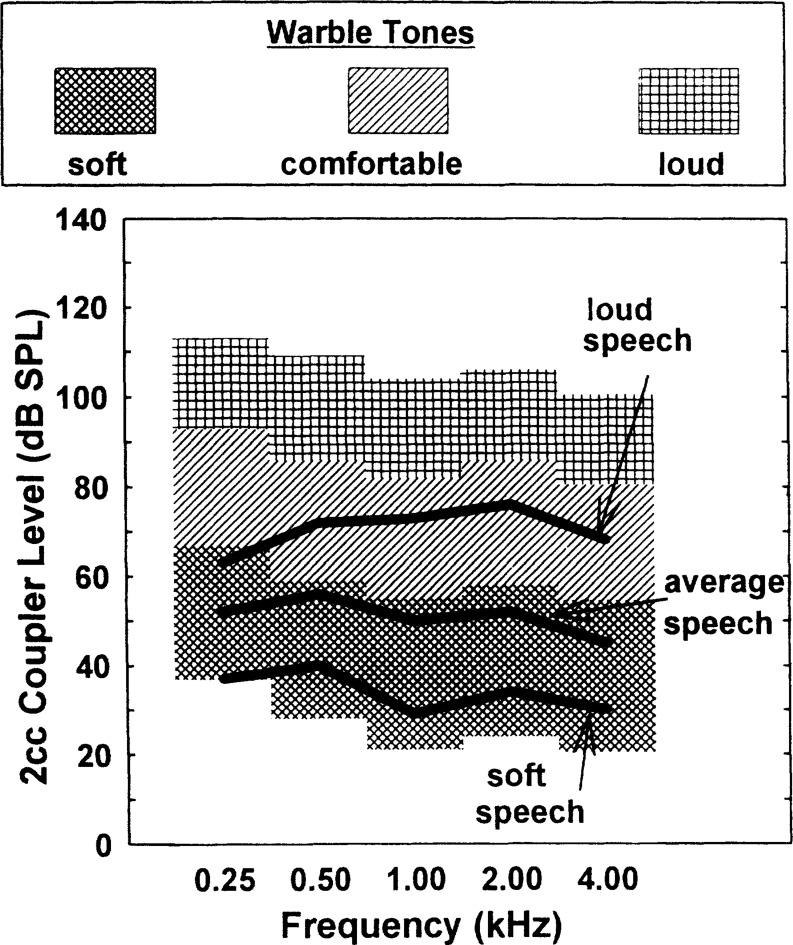
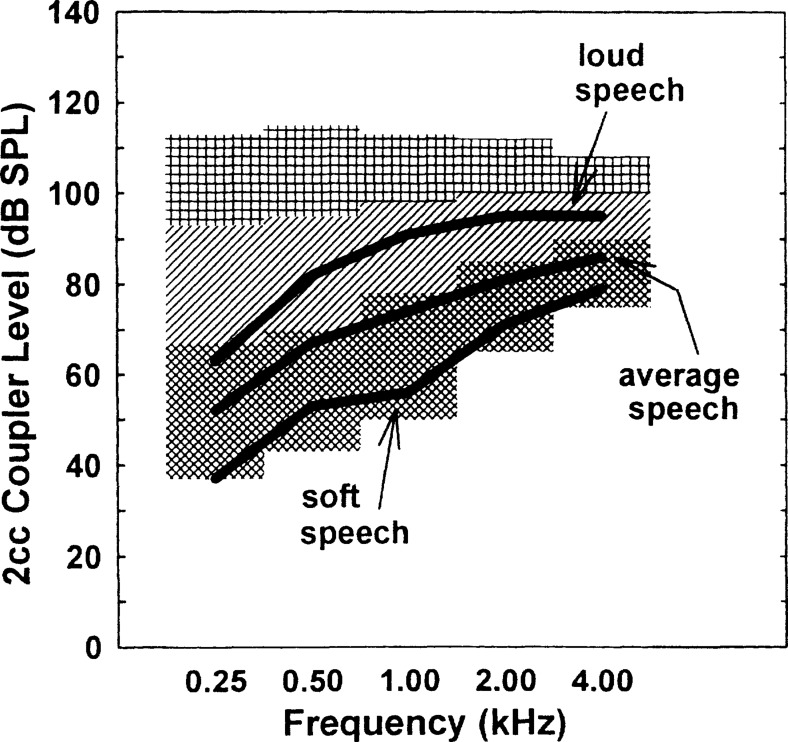
Figure 7 reveals the relationship between loudness judgments for soft, average, and loud speech superimposed upon the loudness judgments for warble tones (thatched areas) for 45 normal hearing listeners (Cox, 1995). Figure 7 illustrates the effect of loudness summation across bandwidth, power summation within speech, crest factor differences between speech and frequency-specific stimuli, and duration differences between speech samples and the frequency-specific stimuli used to measure loudness perception (Cox, 1995). That is, the loudness judgment for a broad-band signal (i.e. speech) is different than the loudness judgment for frequency-specific signals. Specifically, the loudness judgment for “soft” speech would be equal to the loudness judgments for “very soft” frequency-specific stimuli. The loudness judgment for “average” speech would be equivalent to loudness judgments of “comfortable, but slightly soft” (i.e., upper region of the soft zone) for frequency-specific stimuli. Finally, the loudness judgment for “loud” speech would be equivalent to loudness judgments of “comfortable” for frequency-specific stimuli. Figure 8 shows an example of application of this relationship to one hearing-impaired listener. That is, the VIOLA software automatically corrects for loudness summation and the other factors mentioned above, and provides amplification goals for typical speech inputs which will hopefully restore normal loudness sensation to the hearing-impaired listener. Thus, the goal of the VIOLA software is to restore normal loudness perception to the hearing-impaired patients so that amplified “soft” speech will be perceived as “soft”, “average” speech will be perceived as “comfortable” and “loud” speech will be perceived as “loud, but not uncomfortably loud” as the patient uses his hearing aid. There is much discussion as to whether or not achieving these goals will also provide the amplification necessary to achieve maximum intelligibility of speech. The reader is urged to read the excellent article by Byrne (1996) which succinctly discusses the advantages and disadvantages of a fitting goal aimed at restoring normal loudness perception (i.e., loudness normalization) to hearing-impaired patients. There is a significant amount of ongoing research attempting to find the answer to that question.
In Figure 6, the three dots on the three vertical lines represent “output targets” at each test frequency for “soft” speech (∼75 dB SPL at 500 Hz; ∼85 dB SPL at 3000 Hz); “average” speech (∼82 dB SPL at 500 Hz and ∼90 dB SPL at 3000 Hz) and “loud” speech (∼90 dB SPL at 500 Hz and ∼92 dB SPL at 3000 Hz). Where the “dot” meets the “x” axis is the input level at the microphone of the hearing aid for “soft”, “average”, and “loud” speech at each test frequency based on the data by Pearsons et al (1977). For example, the input level for “soft” speech at 500 Hz is ∼52 dB SPL and ∼38 dB SPL at 3000 Hz. The input level for “average” speech at 500 Hz is ∼60 dB SPL, while at 3000 Hz it is ∼50 dB SPL. For “loud” speech the input level is ∼70 dB SPL at 500 Hz, while at 3000 Hz it is ∼67 dB SPL.
Figure 7.
Relationship between typical speech input levels and loudness perceptions for normal-hearing listeners (Cox, 1995; Reprinted with permission from The Hearing Journal 48(2):10,39–44).
Figure 8.
Relationship between typical speech input levels and loudness perceptions for hearing-impaired listeners (Cox, 1995; Reprinted with permission from The Hearing Journal 48(2):10,39–44).
At this point in the IHAFF procedure, the clinician is faced with the need to make decisions concerning what electroacoustic characteristics are required to achieve the targeted goals indicated by the three dots for each test frequency. The clinician will look at the top of Figure 6 and see that for each frequency, he/she must determine a] gain at 40 dB; b] compression threshold 1; c] compression ratio 1; d] compression threshold 2; e] compression ratio 2 and f] the maximum output. The clinician need not worry about determining the gain at 60 dB SPL or the slope. These latter two electroacoustic characteristics are automatically computed by the VIOLA software. The following section will hopefully help the clinician make these decisions. In looking at Figure 6:
To determine the gain at 40 dB: at 500 Hz look at the 40 dB SPL input along the abscissa (x axis or the input level to the microphone of the hearing aid). At that point, draw an imaginary vertical line to the point where it intersects the first horizontal line of the thatched soft region. Now, draw an imaginary horizontal line and see where this line intersects the ordinate (y axis or output measured in an HA-1 coupler). At 500 Hz, the imaginary horizontal line would intersect at ∼60 dB SPL. Thus, the input is 40 dB SPL and the output is 60 dB SPL. Therefore, the gain is 20 dB. Type “20” in the box “gain at 40 dB” on the VIOLA screen on your monitor. At 3000 Hz, the output at the 40 dB SPL input is ∼80 dB SPL. Therefore, type “40” (i.e., 80–40) in the box “gain at 40 dB”.
To determine compression ratio: for now, let's skip determining the threshold kneepoint and discuss determining the compression ratio. By viewing the slope (or angle) of the three dots, it becomes fairly easy to determine if the compression characteristics should be linear or nonlinear at each test frequency. For example, if a straight line were drawn through the three dots for 500 Hz in Figure 6, the angle would be approximately 45 degrees, or a linear function (nearly parallel to the dashed line). If the angle were less than 45 degrees, then the patient would require nonlinear amplification; specifically, compression. The clinician can very easily calculate the compression ratio by dividing the input range (x axis) by the output range (y axis). For example, at 500 Hz, the range of the input from the first to the third dot is ∼18 dB (70-52 dB SPL), while the range of the output from the first to the third dot is ∼15 dB (96-72 dB SPL). If the clinician divides 18/15 (input/output or x/y), the product is a CR of 1.2:1 which is very close to linear (i.e., for each 1 dB increase at the input there is a 1 dB increase in the output). Now at 3000 Hz, the range of the input is ∼29 dB (67-38 dB SPL) and the range of the output is ∼7 dB (92-85 dB SPL). This would result in a CR at 3000 Hz of 4.1:1 (29/7). That is, for every 1 dB increase at the input there is a .4 dB increase at the output. Because of the increased hearing loss and the resulting reduced dynamic range in the high frequency region, the patient requires linear amplification in the low frequency region and nonlinear amplification in the high frequency region to restore normal loudness perception. Thus, the clinician can now place a “1” in the boxes for compression ratio 1 (CR1) and compression ratio 2 (CR2) at 500 Hz to yield linear amplification in the low frequency region. Also, the clinician can place a “4” in the boxes for CR1 and CR2 at 3000 Hz to create nonlinear amplification in the high frequency region. The clinician can now see why it might be advantageous for the patient to have access to a two-channel hearing aid where the compression characteristics in the low and high frequency region can be adjusted independently to correct for differences in the dynamic range between the two frequency regions. The reader must understand that numerous strategies are available for “connecting” the three dots. The strategy described in this section is only one of many available strategies.
-
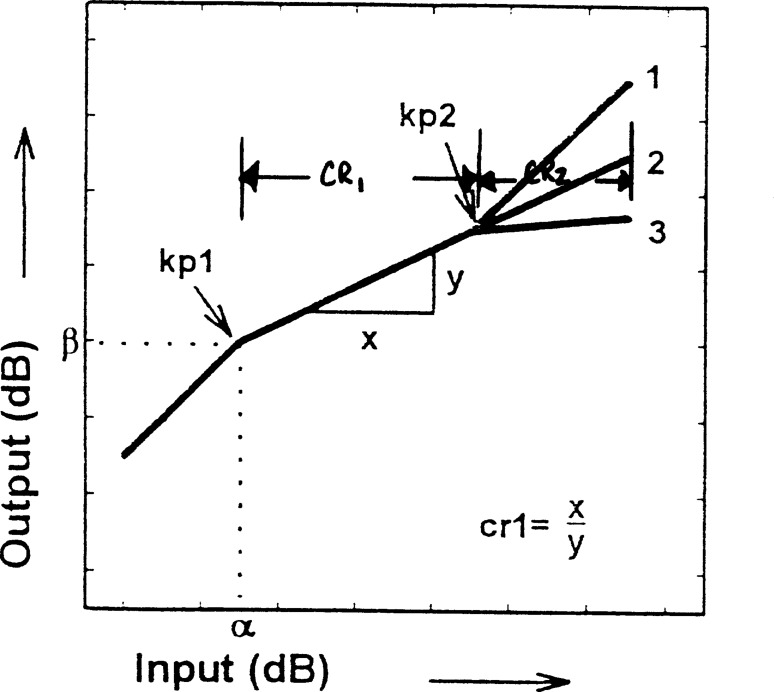
To determine the compression kneepoint: there is no easy calculation available in VIOLA to determine the two compression kneepoints (KP1 and KP2). Each kneepoint creates a point where the slope of the I/O curve changes. Figure 9 may help the reader visualize some of the possible I/O curves (Cox, 1995). Below the first kneepoint (KP1), the hearing aid will function as a linear amplifier (i.e., any change in input will create an equal change in output). Between the first and second kneepoint (KP2), there usually will be some compression of the input (i.e., a increase in input will cause a smaller change in the output). For input levels above KP2, the hearing aid may return to linear signal processing (line 1: K-Amp® signal processing where KP2 is 90 dB SPL and CR2 is “1”); remain unchanged (line 2: where CR1 and CR2 are equal) or apply greater compression (line 3: curvilinear compression).
When selecting input compression as the desired method of compression, the threshold of the kneepoint(s) is read off the x axis (input). If selecting output compression as the preferred method of compression, the threshold of the kneepoint(s) is read off the y axis (output). In fact, when the clinician entered the calculated KP, he/she must enter the letter “o” if output compression is desired (eg. “95o”). If the clinician desires input compression, then he/she merely needs to enter the number. There is no need to enter the letter “i”.
As a general rule, if the CR is linear or near linear, place a high value for the kneepoint in the compression threshold box (i.e., 80–85 dB SPL). If the CR is nonlinear (i.e., greater than 2:1) place a lower value for the kneepoint in the compression threshold box (i.e., 40–45 dB SPL), so compression will occur at lower speech-level inputs.
To determine the maximum output: at 500 Hz in Figure 6, look at the upper horizontal line of the “loud” hatched area and see where this line intersects the ordinate (y axis or the output of the hearing aids measured in a HA-1 2 cm3 coupler). At 500 Hz, the imaginary horizontal line would intersect at ∼115 dB SPL. Thus, the maximum output is ∼115 dB SPL. Type “115” in the box “Max Output” on the VIOLA screen of your monitor. At 3000 Hz, the maximum output is ∼105 dB SPL. Therefore, type “105” in the box “Max. Output”. In looking at these values, it becomes even clearer as to why the patient could be better helped by having a hearing aid where the output can be programmed differently in the high-frequency channel than in the low frequency channel.
Figure 9.
Elements of an input/output function used in VIOLA (Cox, 1995; Reprinted with permission from The Hearing Journal 48(2):10,39-44).
Now that the clinician has placed his/her initial calculations into the six boxes for each frequency, what does he/she do next? Press F9 and VIOLA will immediately calculate and draw a line showing how your calculations of the six parameters match the prescriptive target created by the three dots (see Figure 6). It is not shown in Figure 6, but on the VIOLA screen the clinician actually has three columns for each of the two frequencies. Thus, he/she can place his/her initial calculation in the first column and press F9 to determine how close the line approximates the three dots. He/she can then place different values in columns 2 and 3 and press F9 to see if his/her fine-tuning strategies from the initial values provide a line that is closer to the three dots. Or, the clinician can place into one of the columns the known compression and output characteristics of a selected hearing aid at the two test frequencies to see how close or far it may be from the target. If nothing else, the VIOLA software is a magnificent learning tool for the clinician to develop a greater knowledge of how changing the compression characteristics can change the performance of a hearing aid.
E. Fitting and Verification Using 2 cm3 Coupler Measures and Adjustments
It is important for the reader to remember that the VIOLA graph is an input/output curve for frequency-specific stimuli as measured in a HA-1 2 cm3 coupler. It would be very helpful for the clinician if the “final” VIOLA graph could be “downloaded” to a commercially available hearing aid analyzer to serve as a “prescriptive target” when the clinician accesses the input/output menu of their hearing aid analyzer. Then, all that would be required would be for the clinician to attach the hearing aid to the 2 cm3 coupler and rotate the potentiometers or program the hearing aid until the measured input/output curve arrives as close to the prescribed VIOLA input/output curve at each test frequency as is possible. This concept is not unlike how clinicians currently create a prescribed real ear insertion gain (REIG) target with their real ear analyzer and then place the hearing aid in the ear canal and rotate the potentiometers or program the hearing aid until the measured REIG comes as close to the prescribed REIG as is possible.
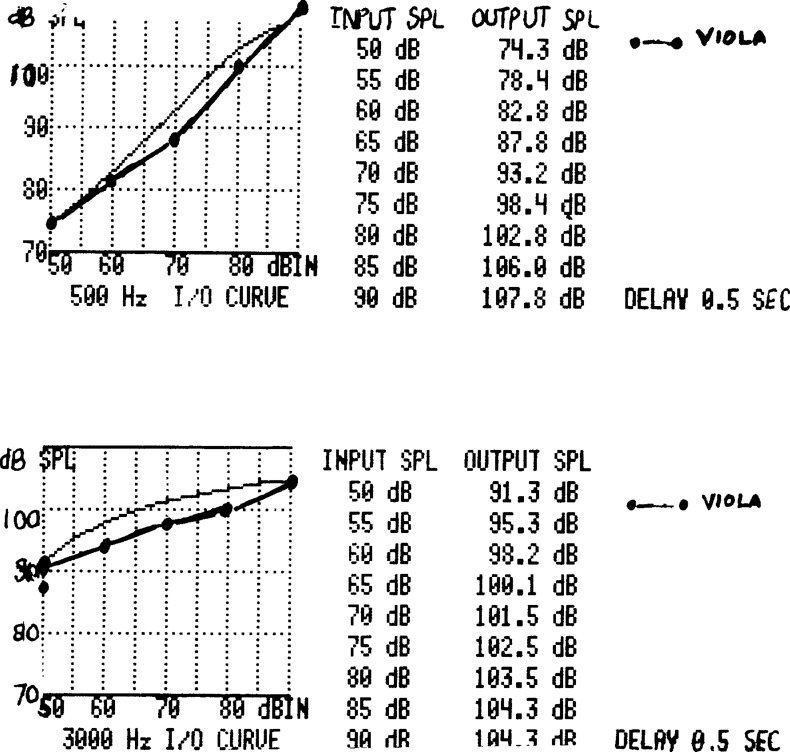
Unfortunately, to the authors' knowledge, no equipment is currently available allowing the clinician to have access to a VIOLA input/output target. Figure 10 is the input/output curve for the left ear at 500 Hz (upper) and 3000 Hz (lower) for the hearing aid fitted for our patient. The solid line connected by dots is the input/output curve transferred manually from the VIOLA graphs at 500 and 3000 Hz for each ear. The thinner line is the measured input/output curve at each frequency. The authors simply programmed the hearing aid while the hearing aid was in an HA-1 coupler until we could achieve an input/output curve that arrived as close to the “target” as was possible. As can be seen, the measured input/output curves in all cases resulted in an output which was somewhat greater than was prescribed by VIOLA. In retrospect, and with some additional experience with VIOLA, the authors would now “err” on the side of adjusting the hearing aid so the output is lower than prescribed by VIOLA. The reason for this is that VIOLA version in the IHAFF protocol does not correct for binaural summation (i.e., 3–5 dB less gain is required for a binaural fitting in comparison to the same loudness perception for a monaural fitting).
Figure 10.
Target and measured input/output curve for the left ear at 500 and 3000 Hz.
After the authors achieved this goal, we locked the parameters into the hearing aid. As the reader can imagine, this method is very inefficient and potentially error-prone. Perhaps one day, if the validity of the IHAFF protocol is found to be acceptable, manufacturers of hearing aid analyzers will see the benefit of incorporating “target” input/output curves into their hearing aid analyzers. It certainly would allow this segment of the IHAFF protocol to be much more efficient and probably make the IHAFF protocol more acceptable to clinicians.
Another goal of the IHAFF protocol is that the frequency response of the hearing aid be as wide as possible and that harmonic distortion should be less than 10% at 500, 800 and 1600 Hz for a 90 dB SPL input. To verify this, the hearing aid is placed in an HA-1 coupler and the performance measured relative to the ANSI S3.22-1987 (now ANSI S3.22-1996b) standard. Figure 11 reveals the performance of the left hearing aid fitted to our subject. As the reader can see, harmonic distortion was less than 10% at 500, 800 and 1600 Hz and the bandwidth is 273–7100 Hz.
Figure 11.
Electroacoustic measures of the left hearing aid.
Since the time the authors fit these hearing aids, the ANSI S3.42-1992 standard option was made available on our hearing aid analyzer. Thus, at our facility we run both the ANSI S3.22-87 and ANSI S3.42-92 standards on all hearing aids. For the ANSI S3.42-1992 standard, a broad-band signal is introduced at 50, 60, 70 and 80 dB SPL and the smoothness of the frequency response at those four input levels can be observed. What we hope to see is that the frequency response at 80 dB SPL is as smooth as the frequency response at 50 dB SPL. This would inform the clinician that the hearing aid is not producing excessive amounts of intermodulation distortion (Revit, 1994).
F. Presenting Warble Tones in Sound Field at 20–30 dB HL
Another goal of the IHAFF protocol is that speech presented at a low input level (overall level = 50 dB SPL) should be judged as “soft” and, of course, should also be audible. In a method advocated by Mead Killion, the patient, wearing his/her hearing aids, would be seated at 0° azimuth and at least one meter from a loudspeaker while warble tones or narrow bands of noise centered at octave/interoctave intervals from 250 to 4000 Hz are presented at 20 to 30 dB HL (i.e., this is not threshold determination, but rather the signals are presented at 20 to 30 dB HL and either the patient hears the signal or does not). Although the IHAFF protocol is not clear as to whether these measures are performed monaurally (with the non-test ear plugged) or binaurally, the authors suggest that the measures be performed on each ear separately and then binaurally. This is suggested so that if the subject should lose one hearing aid or is left with only one hearing aid while the other is being repaired, the clinician will know that at least the monaural fit is still providing adequate benefit. If the electroacoustic characteristics of the hearing aids are adjusted appropriately, then the patient responds that he heard all of the signals presented at 20–30 dB HL from 250 to 4000 Hz. If the patient reports hearing these signals, then, according to Mead, this would verify that soft speech is audible. An alternative would be to present a speech signal (i.e., connected discourse) at an overall level of 50 dB SPL (approximately 34 dB HL) and the patient should report that the speech signal is “very soft”, “soft”, or “comfortable, but slightly soft”.
For this procedure to be meaningful, it is essential that the sound-field is calibrated to the ANSI-1996 standard. Using the procedure suggested in ANSI-1996:
The test signal must be an FM warble tone or narrow band noise.
The loudspeaker must be at head height. The distance from the loudspeaker to the patient must be at least one meter. The position in the sound field where the patient will be seated is referred to as the “referencepoint”.
For calibration, the patient and patient's seat is absent and the sound pressure levels (SPL) produced by the loudspeaker is measured at positions 0.15 meters from the “reference point” in the left-right and up-down axis. The SPLs should not deviate more than +/− 2 dB from the SPL at the reference point.
Again, with the patient and patient's seat absent, the difference of the SPLs from the loudspeaker measured at points on the reference axis 0.10 meters in front and behind the “reference point” should not deviate from the theoretical value given by the inverse square law by more than +/− 1 dB for any of the test signals.
A free-field microphone (not pressure microphone) should be placed on a microphone stand and connected to an extension cable and a sound level meter. This procedure places the clinician out of the sound field and prevents diffraction effects of the signals bouncing off the clinician and being picked up by the free-field microphone, thus contaminating the measures. The grille of the microphone should be placed in a horizontal position (i.e., facing the ceiling) to the loudspeaker, and at the “reference point”. Using these procedures, the values in the following Table (+/− 3 dB at 250–4000 Hz; +/− 5 dB at 6000 Hz) should be measured by the sound level meter with the attenuator of the audiometer set for 70 dB HL. The first column represents data for binaural listening while the second column represents data for monaural listening with the loudspeaker at a 0° azimuth. For the interested reader, ANSI-1996 also provides normative data for when signals are delivered at 45 and 90° azimuths.
| Freq (Hz) | Binaural | Monaural |
|---|---|---|
| 250 | 81.0 | 83.0 |
| 500 | 74.0 | 76.0 |
| 1000 | 72.0 | 74.0 |
| 1500 | 70.5 | 72.5 |
| 2000 | 68.5 | 70.5 |
| 3000 | 64.0 | 66.0 |
| 4000 | 63.5 | 65.5 |
| 6000 | 72.5 | 74.5 |
| 8000 | 81.5 | 83.5 |
| Speech | 84.5 | 86.5 |
Of course, the clinician should be certain that the ambient noise levels inside the sound booth should adhere to the ANSI-1991 standard for maximum permissible ambient noise levels and that the linearity of the attenuator adheres to the ANSI-1996 standard (ANSI, 1996a).
When warble tones from 250 to 4000 Hz were presented to our sample patient at 20 to 30 dB HL, the patient reported that he heard the 250 and 2000 Hz signals at 25 dB HL, the 500, 1000 and 4000 Hz signals at 20 dB HL, but that he did not hear the 3000 Hz signal when presented at 20 to 30 dB HL. This would indicate, using the procedure advocated by Mead, that the speech spectrum is audible from 250 to 4000 Hz (with the exception of 3000 Hz) and would be expected to be judged by the patient as being “very soft”, “soft” or “comfortable, but slightly soft”. As an alternative, the authors also presented female connected discourse at 50 dB SPL. Our sample patient indicated that he felt that the signal was “soft”.
G. Presenting Speech in Sound Field at 65 and 85 dB SPL
When female connected discourse was presented at 65 dB SPL the patient reported that he felt that the loudness was between “comfortable, but slightly soft” and “comfortable” (#3–4 categories of loudness). When female connected discourse was presented at 85 dB SPL the patient reported that the loudness was between “comfortable, but slightly loud” and “loud, but O.K.” (#5–6 categories of loudness). In the IHAFF protocol, the sample of speech is presented for approximately 15 seconds and it is not a bad idea to repeat the procedure to check for reliability of responses. Again, although not specified by the IHAFF protocol, we perform this segment monaurally and binaurally for the reasons discussed above. Finally, the IHAFF protocol does not specify what the speech signal should be. It can be male or female connected discourse or other speech samples. Some clinics use the speech-weighted composite signal from their real ear analyzers as the test signal presented at 65 and 85 dB SPL. Some clinics use the narrow band sweep from the 3M SoundPro presented at 65 and 85 dB SPL. The only important parameter is that the signal is calibrated so that the intensity at the “reference point” is 65 and 85 dB SPL.
H. REAR Measures at 50,60, 70 and 80 dB SPL
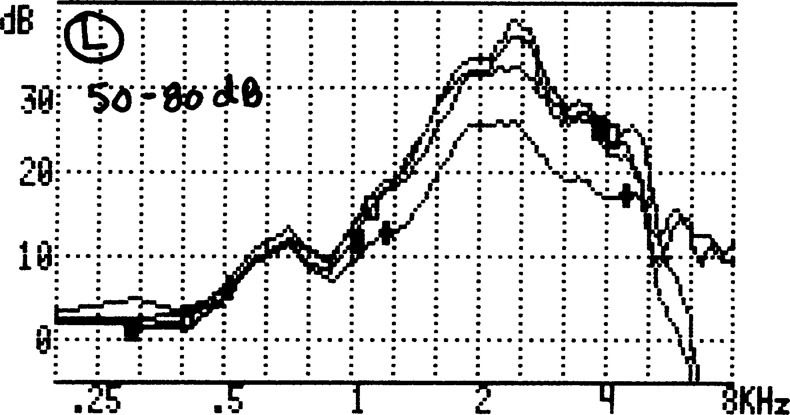
The IHAFF protocol recommends that real ear insertion gain (REIG) or real ear aided response (REAR) should be measured at multiple input levels so that if can be verified that the frequency response at input levels of 80 to 85 dB SPL is as smooth as the frequency response at an input level of 50 dB SPL. Figure 12 illustrates the REIG for input levels of 50 (upper curve), 60, 70 and 80 dB SPL (lower curve) for our sample patient. As the reader can see, the frequency response at an input level of 80 dB SPL is as smooth as the frequency response at an input level of 50 dB SPL.
Figure 12.
REAR measures at 50, 60, 70 and 80 dB
I. RESR90
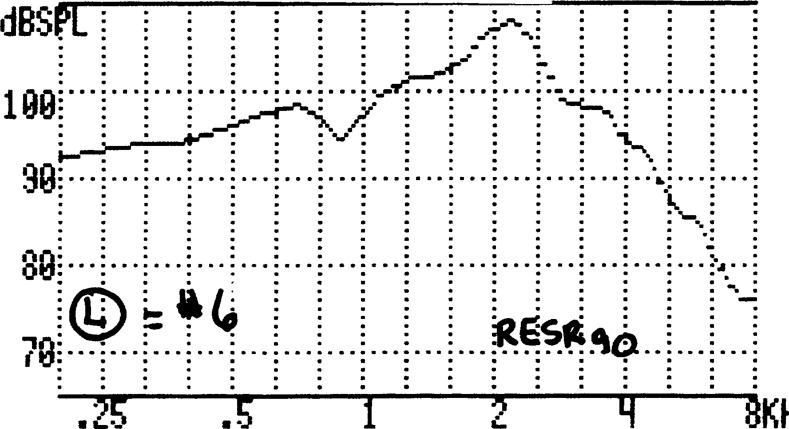
The IHAFF protocol recommends that a real ear saturation response (RESR) be measured using a pure-tone sweep presented at 90 dB SPL (RESR90). Figure 13 reveals the RESR90 for the left ear for our sample patient. The subject reported a loudness judgment of between #6 (“loud, but O.K.”) for this 90 dB SPL stimulus. This verifies that the saturation output of the hearing aid appears to be set appropriately. If the patient would have reported a #7 (“uncomfortably loud”), then strategies to reduce the saturation output of the hearing aid would have been implemented and the process repeated.
Figure 13.
RESR90 measures for the left ear.
J. Aided APHAB and Benefit Score
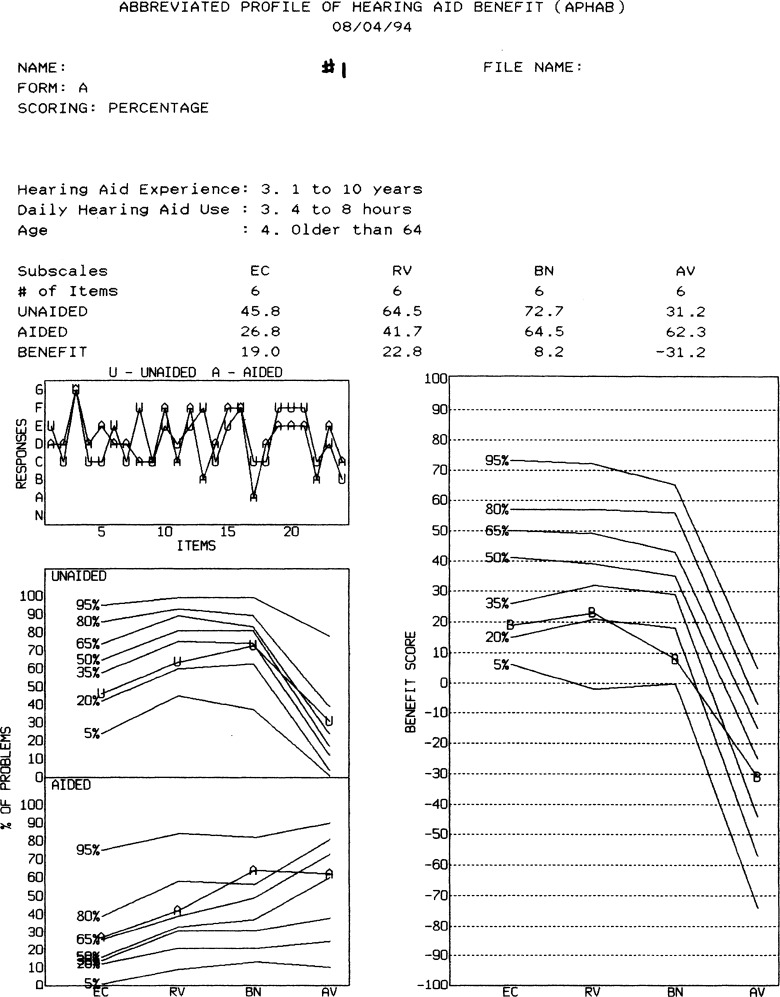
When the patient returned after wearing the hearing aids for four weeks, he was asked to complete the aided segment of the APHAB. The results of the unaided and aided APHAB were entered into the APHAB menu by accessing the Questionnaire sub-menu. It is here that we entered the Patient information (i.e., used Form A; worn aids for 1–10 years; uses the hearing aids for 4–8 hours a day; is older than 64 years and that the clinician wants to enter both the unaided and aided results). At this point the clinician entered the Clinician edit sub-menu to enter the letters A-G for the both the unaided and aided responses for the 24 items. Afterwards, the clinician can access the Options sub-menu to see the unaided, aided and benefit results (Graph) or obtain a hardcopy printout (Figure 14) by accessing the Print sub-menu.
Figure 14.
APHAB results for our sample patient.
Figure 14 reports the APHAB results for our sample patient. The upper section reports the raw data for the unaided problem score (%), aided problem score (%) and benefit score (%) for the four subscales in a tabular format. The first box in the upper left is a graph which reports the response pattern across for the seven letters (A-G; N = no response) for the 24 items (the abscissa) for both the unaided (U) and aided (A) conditions. In looking at this response pattern, the clinician is hoping to see a fairly random-looking pattern. A systematic pattern should lead the clinician to view the results with caution.
The middle box to the left reports the unaided problem scores (U) for the four subscales (abscissa). Also provided is the 5th through 95th percentile of responses by a standardized norm group of experienced, regular users of linear amplification (see Cox and Alexander, 1995, for information on this group). In Figure 14, our sample patient reports experiencing problems 45.8% of the time when listening unaided in relatively easy listening situations (EC); 64.5% of the time when listening unaided in conditions where reverberation was present; 72.7% of the time when listening unaided in background noise, and aversive sounds were reportedly a problem 31.2% of the time. These results also show that the patient's problem score lies between the 20th and 35th percentile for the EC, RV, and BN subscales and between the 65th and 80th percentile for the AV subscale.
The lower box to the left in Figure 14 reports the aided problem score (A) for the four subscales (abscissa). Also provided is the 5th through 95th percentile of responses by the standardized group of experienced successful users of linear amplification. In this case, the patient is reporting that he experienced problems “only” 26.8% of the time when listening aided in relatively easy listening situations (EC); 41.7% of the time when listening in conditions where reverberation was present; 64.5% of the time when listening in background noise and aversive sounds were a problem 62.3% of the time. The results also show that the patient's aided problem score lies between the 65th and 80th percentile for the EC and RV subscales; between the 80th and 95th percentile for the BN subscales and between the 50th and 65th percentile for the AV subscale.
The large box to the right in Figure 14 reports the benefit score (B) for the four subscales (unaided - aided). Also provided is the 5th through 95th percentile of responses by the standardized group of experienced successful users of linear amplification. In this case, our sample patient received a benefit of 19% when listening in relatively easy listening situations (EC); 22.8% when listening in conditions where reverberation was present; and 8.2% when listening in background noise. However, aversive sounds were as annoying as when he did not wear the hearing aids. The results also show that this patient's benefit score lies between the 20th and 35th percentile for the EC and RV subscales; between the 5th and 20th percentile for the BN subscale and between the 35th and 50th percentile for the AV subscale.
There are several ways to use the information provided by the results of the APHAB. First, the unaided APHAB might be useful as a predictor of benefit from amplification and at least two patterns have been identified (Cox, 1996). First, if the unaided scores for the EC, RV and BN subscales are above the 35th percentile and the score for the AV subscale is below the 65th percentile, the patient is saying that he/she is experiencing significant communication problems, but aversive environmental sounds are not a problem. It is probable that this patient will benefit from either linear amplification or nonlinear amplification. A second pattern is where the unaided scores for the EC, RV and BN subscales are below the 35th percentile and the score for the AV subscale is above the 65th percentile. In this case the patient is saying that he/she is having little communication difficulties and environmental sounds are very bothersome. It is probable that this patient will not benefit as significantly from linear amplification, but may benefit more from nonlinear amplification. Our patient fits into the second pattern because his unaided scores for the EC, RV, and BN subscales were at or below the 35th percentile and the score for the AV subscale was below the 65th percentile. We fit him with a binaural set of behind-the-ear hearing aids with wide dynamic range compression and he was very pleased with the hearing aids.
A second use of the APHAB is to compare the results between two different hearing aid fittings. For example, if a clinician wants to know if a patient perceives that he/she performs significantly better with one hearing aid fitting compared to another hearing aid fitting on any one of the subscales (EC, BN or RV), there would have to exist a difference of at least 22% between the two fittings in order to say that the differences are probably “real” and not due to chance (Cox, 1996). If the clinician wants to look at only the AV subscale, then the differences between the two hearing aid fittings would have to be at least 31% between the two fittings in order for the clinician to state that these differences are “real” and not due to chance.
Another way to do this is to use the combined scores for the EC, RV and BN subscales. If the aided EC, RV and BN scores are better for one hearing aid fitting than for the other (i.e., new fitting in comparison to the patient's previous fitting) by at least 5%, then there is a 91% probability that this reflects a true difference. On the other hand, if the benefit EC, RV and BN scores are better for one hearing aid fitting than the other by at least 5%, then there is an 89% probability that this reflects a true difference. Furthermore, if the aided EC, RV, and BN scores are better for one hearing aid fitting than for the other by at least 10%, then there is a 98% probability that this reflects a true difference. If the benefit EC, RV and BN scores are better for one hearing aid fitting than the other by at least 10%, then there is a 96% probability that this reflects a true difference.
A third use of the APHAB is the use of the benefit score for determining the efficacy of a hearing aid fitting. To determine if a benefit score truly reflects benefit, the clinician will have to see a score of at least 22% for the EC or RV or BN subscales in order to be reasonably certain that the difference in scores between the unaided and aided conditions is significant. For a more global assessment, the clinician will have to see a benefit score of at least 5% for the EC, RV and BN subscales in order to be reasonably certain that the benefit score between the unaided and aided conditions is significant. If this degree of difference is present, then the clinician can conclude that there is a 89% probability that they reflect a “true” benefit. Even greater confidence can be derived if the benefit scores are at least 10% greater for the aided condition in comparison to the unaided condition. If these degree of differences are present, then the clinician can conclude that there is a 96% probability that they reflect a true benefit.
FINAL THOUGHTS
The IHAFF protocol is a living document which hopefully will be improved over time. For example, one of the major reasons for resistance to the IHAFF protocol is the lack of familiarity of clinicians in viewing the performance of hearing aids as an input/output curve at individual frequencies. This resistance is compounded by the fact that hearing aid analyzers are not available to provide the IHAFF prescriptive VIOLA targets when the clinician analyzes the input/output performance of the hearing aid. Currently, this process requires the clinician to “visually” transfer the I/O graph from VIOLA to the I/O graph of their hearing aid analyzer (see Figure 10). This process is time-consuming, inefficient and prone to produce errors.
A second major reason for the lack of wide acceptance of the IHAFF protocol is continued resistance to performing loudness scaling as part of the process of selecting and fitting hearing aids. Many clinicians are still not convinced that the time taken to perform loudness scaling results in a better fit than if the loudness judgments are predicted from thresholds. Further, there are still clinicians who believe that loudness scaling is unreliable. The authors, on the other hand have used loudness scaling as part of their hearing aid fitting process for over a decade and are convinced of the need to obtain these measures on each subject. Although it is probable that in approximately 75% of the cases, the loudness thresholds for an individual can be adequately predicted from threshold, there is no way to determine if an individual patient falls into the 75% or the 25% category. The authors have been involved with many cases where there were significant differences in loudness judgments between a patient's ears (intraaural differences) even though thresholds were symmetrical. Therefore, it is difficult to feel comfortable in predicting loudness scaling between patients (inter-aural differences). Clinicians are now charging fees for fitting hearing aids which are two to three times greater than they were several years ago. As professionals, we cannot continue to provide the same level of service for present technology hearing aids as we did when we were ordering simple custom ITE or ITCs in which we filled in the audiogram and asked the manufacturer to select the electroacoustic characteristics. If, as a profession, we are seeking greater autonomy, we also need to be more autonomous in the manner in which we provide services to our patients.
Fortunately, or unfortunately, we as clinicians, tend to be creatures of habit. That is, we tend to “stick with” those things with which we are familiar and are sometimes hesitant, even reluctant, to accept anything which is unfamiliar. We can all think of colleagues who continued for quite some time to evaluate the performance of hearing aids using functional gain measures even though a real ear analyzer was situated in the same sound suite. Further, we can think of colleagues who continued to write their reports and manuscripts with an electric (or manual) typewriter even though a computer was in the next room. Hopefully, as time goes on, we will lose our technophobia and embrace new technology as exciting and full of possibilities
To alleviate some of the resistance to the IHAFF protocol because of lack of familiarity of viewing hearing aid performance as an I/O graph, it is possible to “convert” the VIOLA graphs into a series of coupler (output and gain) and real ear (REAR and REIG) frequency response curves. Implementing these conversions in hearing aid and real ear analyzers may be a way to bridge the gap between those who reject the IHAFF protocol because it is unfamiliar and the IHAFF members' belief that the contents of the protocol provide a better “mousetrap.”
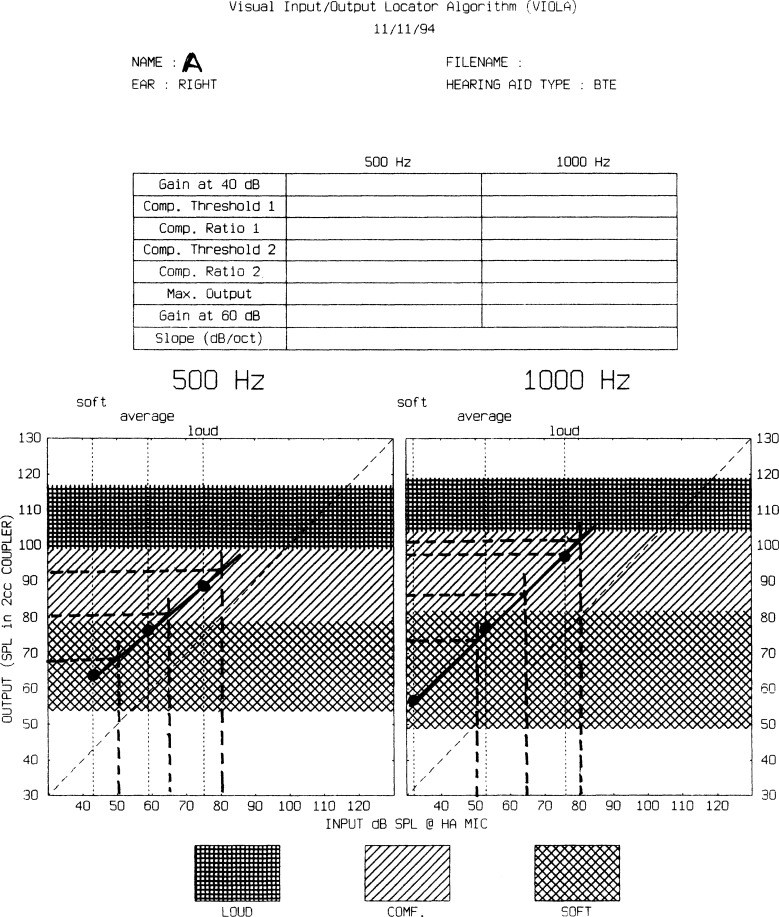
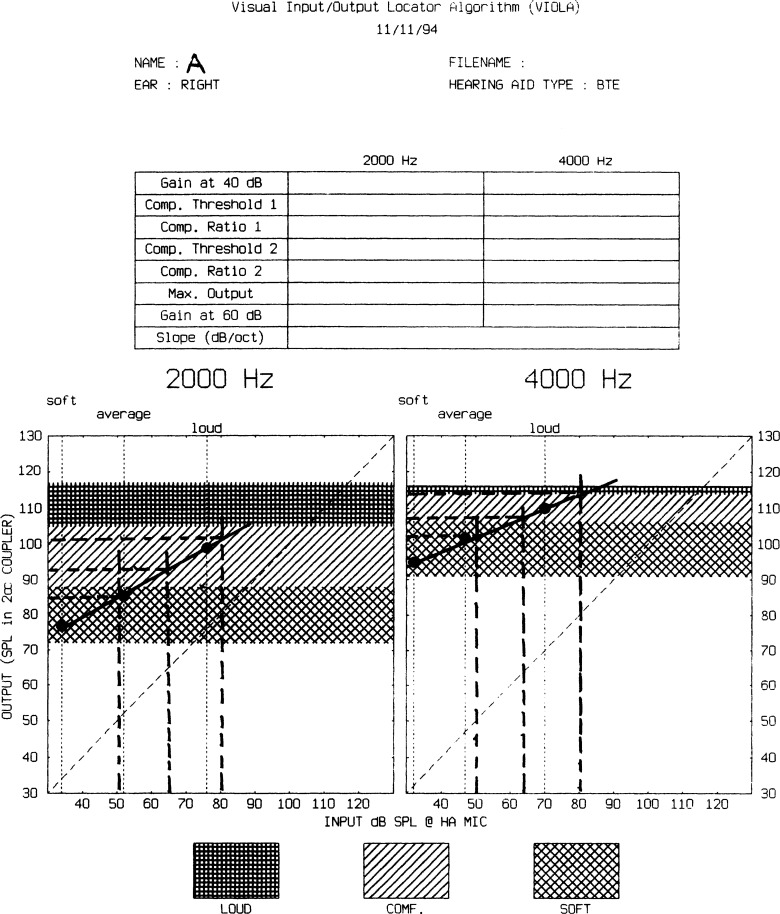
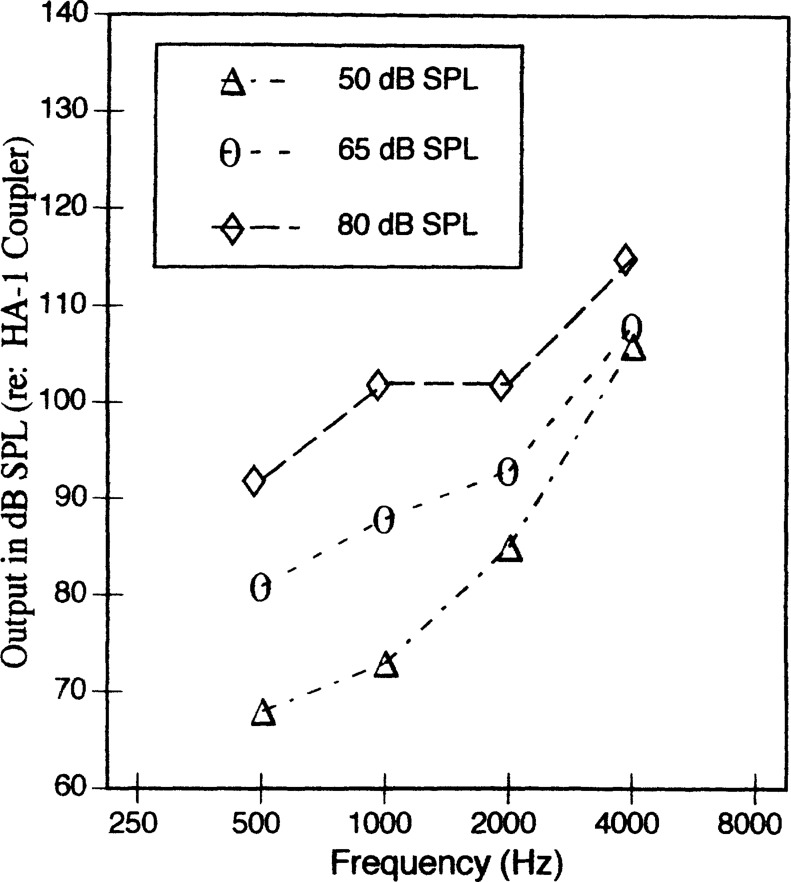
Figures 15–20 are offered as examples of how this could be accomplished. Figures 15 and 16 report the VIOLA results from 500 to 4000 Hz for a patient who will be fit with binaural BTEs (i.e., the microphone corrections for a BTE are already included in the coupler output target). First, for purposes of illustration, a straight line is drawn to connect the three dots. Second, dashed vertical lines are drawn for inputs of 50, 65 and 80 dB SPL. Third, dashed horizontal lines are drawn at each of the three vertical lines to intersect the y axis. Thus, for each of the three input levels there is a corresponding output (in dB SPL measured in a 2 cm3 coupler) from 500 to 4000 Hz. This generates a table which contains the following approximate values representing the target aided coupler response:
| Input | 500 Hz | 1000 Hz | 2000 Hz | 4000 Hz |
|---|---|---|---|---|
| 50 | 68 | 73 | 85 | 106 |
| 65 | 81 | 88 | 93 | 108 |
| 80 | 92 | 102 | 102 | 115 |
Figure 15.
VIOLA graph at 500 and 1000 Hz. See text for explanation of the horizontal and vertical dashed lines.
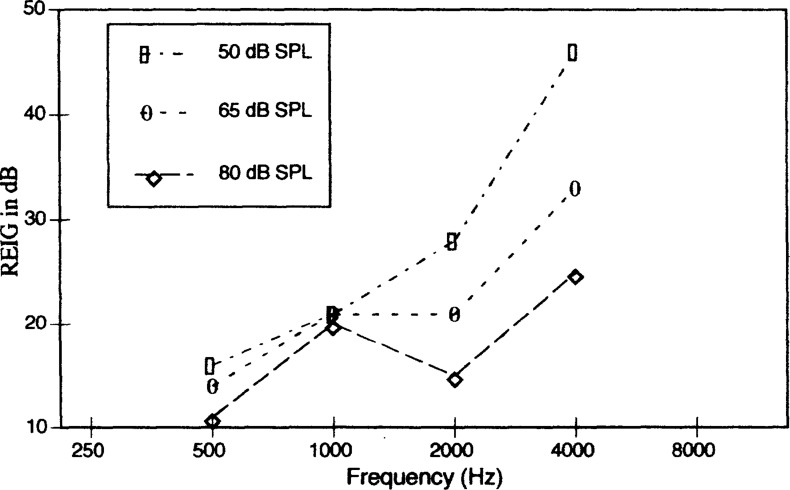
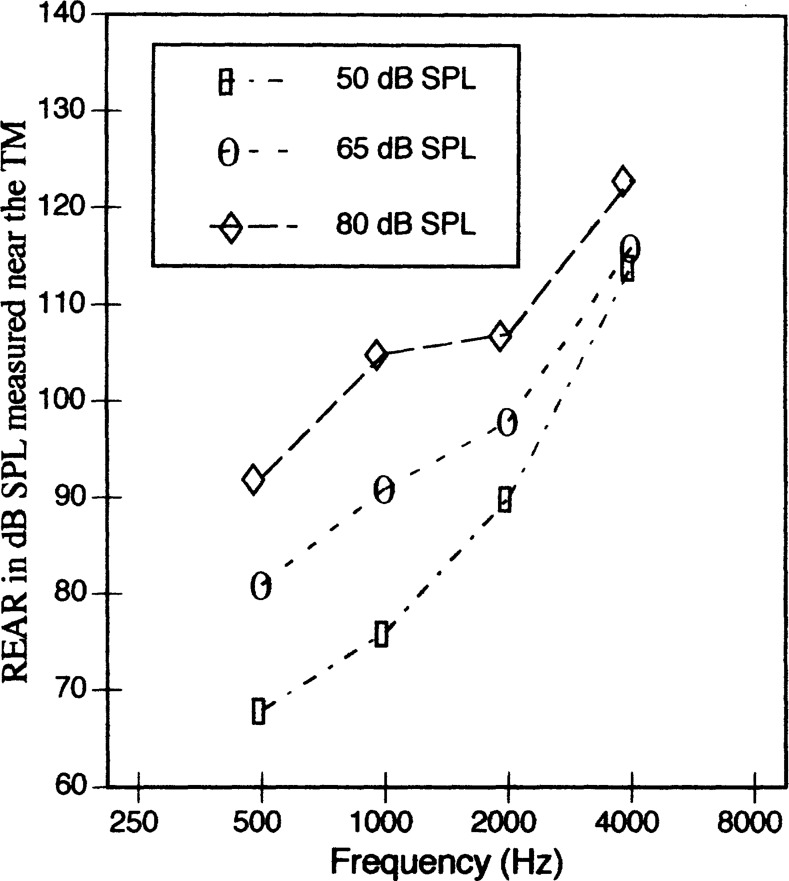
Figure 20.
Target REIG curves for 50, 65 and 80 dB.
Figure 16.
VIOLA graph at 2000 and 4000 Hz. See text for explanation of the horizontal and vertical dashed lines.
In this scenario, the clinician would enter the thresholds (in dB HL) for the seven loudness categories just as was required in the Configure sub-menu of the VIOLA menu into a similar menu on the hearing aid analyzer. Figure 17 illustrates how these values could be converted into an output frequency response and serve as a target for coupler output for the three input levels. Next the clinician would couple the hearing aid to the HA-1 coupler and rotate the potentiometers or program the hearing aid so that the measured output curves, using a sweep pure-tone, arrives as close as possible to the VIOLA prescriptive targets for the three input levels.
Figure 17.
Target coupler output curves for 50, 65 and 80 dB.
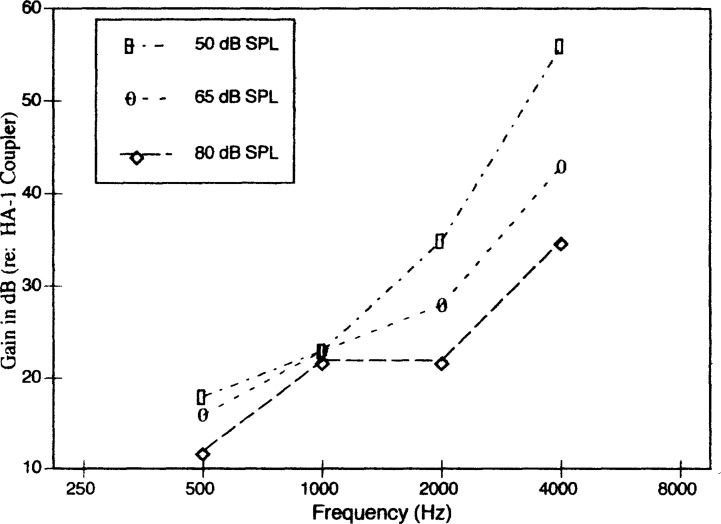
The values in the table can be converted to coupler gain responses for the three input levels by subtracting the input from the output. Figure 18 illustrates how these three curves might appear on the screen of the hearing aid analyzer. The clinician would couple the hearing aid to the HA-1 coupler and rotate the potentiometers or program the hearing aid so that the measured gain curves arrived as close as possible to the VIOLA prescriptive targets for the three input levels.
Figure 18.
Target coupler gain curves for inputs 50, 65 and 80 dB.
Further, the coupler output values could be converted to real ear aided response (REAR) by adding the average real ear to coupler differences (RECD) (Hawkins, 1992), or the individual's RECD measured values. Now the clinician would couple the hearing aid to the ear canal and rotate the potentiometers or program the hearing aid so that the measured output curves, using a sweep pure-tone, arrived as close as possible to the VIOLA REAR prescriptive targets for the three input levels. Figure 19 illustrates how this would appear on the monitor of the real ear analyzer. Finally, the coupler gain can be converted into real ear insert gain (REIG) targets by adding the average coupler response for flat insertion gain (CORFIG) values (Hawkins, 1992). Figure 20 illustrates how this would appear on the monitor of the real ear analyzer. Of course the performance of the actual hearing aid on the individual ear may appear different than the REAR or REIG targets because of differences in a] the presence or absence of damping; b] tubing length and diameter; c] vent length and diameter; d] earmold or shell dimensions; e] length and diameter of the ear canal; f] residual volume from the end of the earmold or shell to the eardrum; and g] impedance of the eardrum and middle ear. Viewing the performance of the hearing aid in either or all of these four manners might be more acceptable to clinicians because it more familiar to clinicians to view the performance of hearing aids in this manner.
Figure 19.
Target REAR curves for 50, 65 and 80 dB.
A point which must be kept in mind is that the validity of the IHAFF protocol has not been investigated. That is, there is no data to support the belief that user satisfaction and benefit from amplification will be better when fit using the IHAFF protocol than if the hearing aids were fit using FIG6 (Gitles, 1995), DSL i/o (Seewald et al, 1996) or any other prescriptive approach. However, many of the current prescriptive rules, both for linear and nonlinear amplifiers, were also never validated before being introduced for use by clinicians. Examples include the Libby 1/3, 1/2 and 2/3 rules; POGO, FIG6 and DSL i/o. Research certainly needs to be completed to determine if implementing any given prescriptive rule consistently results in greater user satisfaction and benefit than another prescriptive rule. However, the IHAFF protocol has a strong underlying theoretical basis and can therefore be implemented with some degree of confidence.
Finally, although the IHAFF protocol has been in existence for only a relatively short time, segments of the IHAFF protocol are already incorporated into the Madsen Auracle and Starkey Pro-Connect hearing aid and real ear analyzers. Many of the concepts which generated the IHAFF protocol have also led, in part, to the development of FIG6 and DSL i/o. Clinicians are now more cognizant of the fact that prescriptive targets appropriate for linear amplification are not necessarily sufficient when verifying the performance of hearing aids with nonlinear signal processing at a variety of input levels. More clinicians and university training programs are beginning to consider implementing loudness scaling as part of the fitting process. Already, then, the IHAFF protocol has had a significant impact on how clinicians view the process of selecting and fitting hearing aids.
ACKNOWLEDGMENTS
The information within this manuscript contains very little original information. This manuscript is merely a compilation of the hard work and efforts of the other members of the IHAFF committee. The authors would like to acknowledge the efforts of Lu Beck, Ruth Bentler, Robyn Cox, Dave Fabry, Gail Gudmundsen, Dave Hawkins, Mead Killion, Michael Marion, Gus Mueller and Larry Revit in allowing the information within this manuscript to be available for the reader. The authors would also like to acknowledge Lisa G. Potts, M.S. at Washington University School of Medicine for creating many of the figures included in this manuscript. Finally, the authors would like to acknowledge the comments and suggestions provided by Robyn Cox, Larry Revit and Carol Sammeth on an earlier draft of this paper. Their insights significantly improved the quality of the paper appearing in this journal.
REFERENCES
- American National Standards Institute. (1989). American National Standard for Specifications of Audiometers. (ANSI S3.6–1989). New York: ANSI [Google Scholar]
- American National Standards Institute. (1991). American National Standard for Maximum Permissible Ambient Noise Levels for Audiometric Test Rooms. (ANSI S3.1–1991). New York: ANSI [Google Scholar]
- American National Standards Institute. (1992). American National Standard for Testing Hearing Aids with a Broad-Band Noise Signal. (ANSI S3.42–1992). New York: ANSI [Google Scholar]
- American National Standards Institute. (1996a). American National Standard for Specification of Audiometers. (ANSI S3.6–1996). New York: ANSI [Google Scholar]
- American National Standards Institute. (1987). American National Standard for Specification of Hearing Aid Characteristics. (ANSI S3.22–1987). New York: ANSI [Google Scholar]
- American National Standards Institute. (1996b). American National Standard for Specification of Hearing Aid Characteristics. (ANSI S3.22–1996). New York: ANSI [Google Scholar]
- Byrne D. (1996). Hearing selection for the 1990s: Where to? J Amer Acad Audiol 7: 377–395 [PubMed] [Google Scholar]
- Cox RM. (1996). Administration and application of the APHAB. Phonak Focus.
- Cox RM. (1995). Using loudness data for hearing aid selection: the IHAFF approach. Hear J 48 (2): 10, 39–44 [Google Scholar]
- Cox RM, Alexander GC. (1995). The abbreviated profile of hearing aid benefit. Ear Hear 16: 176–186 [DOI] [PubMed] [Google Scholar]
- Dillion H, Chew R, Deans M. (1984). Loudness discomfort level measurements and their implications for the design and fitting of hearing aids. Austral J Audiol 6 (2):73–79 [Google Scholar]
- FIG6. (1996). Hearing Aid Fitting Protocol. Operating Manual. Elk Grove Village: Etymotic Research [Google Scholar]
- Gitles TC, Niquette PT. (1995). FIG6 in ten. Hear J 2 (10): 28,30. [Google Scholar]
- Hawkins DB, Walden BE, Montgomery A, Prosek RA. (1987). Description and validation of an LDL procedure designed to select SSPL90. Ear Hear 8: 162–169 [DOI] [PubMed] [Google Scholar]
- Hawkins DB. (1992). Corrections and transformations relevant to hearing aid selection. In: Mueller HG, Hawkins DB, Northern JL, eds. Probe Microphone Measurements: Hearing Aid Selection and Assessment. San Diego: Singular Publishing Group, Inc, 251–268 [Google Scholar]
- Kamm C, Dirks D, Mickey MR. (1978). Effect of sensorineural hearing loss on loudness discomfort level and most comfortable loudness judgments. J Speech Hear Res 21: 668–681 [DOI] [PubMed] [Google Scholar]
- Manual of the Independent Hearing Aid Fitting Forum (IHAFF). (1994). [DOI] [PMC free article] [PubMed]
- Pascoe DP. (1988). Clinical measurement of the auditory dynamic range and their relation to the formulas for hearing aid gain. In Jensen JH, ed, Hearing Aid Fitting: Theoretical and Practical Views. 13th Danavox Symposium. Copenhagen: Stougaard Jensen, 129–152 [Google Scholar]
- Pearsons KS, Bennett RL, Fidell S. (1977). Speech levels in various noise environments. EPA Report 600/1–77-025.
- Revit L. (1994). Using coupler tests in the fitting of hearing aids. In: Valente M, ed. Strategies for Selecting and Verifying Hearing Aid Performance. New York: Thieme Medical Publishers, 64–87 [Google Scholar]
- Seewald RC, Cornelisse LE, Ramji KV, Sinclair ST, Moodie KS, Jamieson DG. (1996). DSL v4.0 for Windows: A Software Implementation of the Desired Sensation Level (DSL [i/o]) Method for Fitting Linear Gain and Wide-Dynamic-Range Compression Hearing Instruments. Ontario: Hearing Healthcare Research Unit [Google Scholar]
- Valente M, Potts LG, Valente M, Vass W, Goebel J. (1994). Intersubject variability of the real ear sound pressure level: conventional and insert earphones. J Amer Acad Audiol 5: 390–398 [PubMed] [Google Scholar]
- Valente M, Potts LG, Valente M. (1997). Differences and intersubject variability of loudness discomfort levels (LDL) measured in sound pressure level and hearing level for the TDH-50P and ER-3A. J Amer Acad Audiol 8: 59–67 [PubMed] [Google Scholar]
- Van Vliet D. (1995). A comprehensive hearing aid fitting protocol. Audiol Today 7: 11–13 [Google Scholar]


