

INTRODUCTION
The hearing aid fitting process is evolving dramatically. There have been significant advances in hearing aid design, as well as in the clinical methods used for audiological assessment, and for the selection and fitting of hearing aids. Hearing healthcare professionals can now precisely measure relevant audiometric and acoustic characteristics for the client to be fitted. The range of available amplification options that may be considered for a given client has increased greatly. The challenge for hearing healthcare professionals is in achieving the best match between client needs and hearing aid characteristics in order to ensure a beneficial fitting for the individual. Unfortunately, although the information that can be collected and applied in the hearing aid fitting process continues to grow, the clinical time available to perform these measurements and select, fit and verify the hearing aid has not.
This article describes one manufacturer's approach to the hearing aid fitting process. Audioscan has implemented the Speechmap/DSL fitting system in the RM500 real-ear hearing aid analyzer. This quick, easy-to-use fitting system combines state-of-the-art assessment procedures with novel ‘speech-like’ signals to bring uniformity and increased accuracy to the fitting of the new generation of hearing instruments.
WHAT IS SPEECHMAP/DSL?
The Desired Sensation Level (DSL) method (Cornelisse et al, 1994, 1995; Seewald, 1995) is a systematic eardrum sound pressure level (SPLogram) approach to the hearing aid fitting process that seeks to ensure amplified speech will be audible and comfortable while loud sounds will not be uncomfortable. In developing the DSL method, Richard Seewald and colleagues have attempted to take into account factors unique to the individual in such areas as audiometric assessment, electroacoustic selection, fitting and verification.
The Audioscan RM500 real-ear hearing aid analyzer is shown in Figure 1. This portable, easy-to-use system was introduced to the hearing healthcare market in late 1988 and entered production in early 1989. Development of the RM500 was based on the belief that real-ear measurements were (and still are) an essential part of the hearing aid fitting process. Audioscan introduced Speechmap for the fitting of compression hearing aids, in 1992. It pioneered the use of time-varying test signals and displayed measured real-ear aided response curves and estimated threshold, most comfortable loudness (MCL), and uncomfortable loudness level (UCL) data on an SPLogram. This SPLogram approach, also used in the DSL method, facilitates the hearing aid selection and fitting process because it transforms all relevant audiometric and electroacoustic variables to an eardrum SPL reference.
Figure 1:

The Audioscan RM500 real-ear hearing aid analyzer.
Speechmap/DSL is a joint development of Audioscan and the Hearing Health Care Research Unit at The University of Western Ontario. It combines the novel time-varying test signals of Speechmap with DSL's attention to individual factors to provide a comprehensive method for fitting all types of hearing aids and FM systems to both children and adults.
OVERVIEW OF THE HEARING AID FITTING PROCESS
The hearing aid fitting process may be viewed as a sequential series of well-integrated stages (Seewald, 1995; Sinclair et al, 1997). Figure 2 illustrates and defines this process flow.
Figure 2:

The Speechmap/DSL hearing aid fitting process.
Speechmap/DSL addresses each of these stages by providing:
automatic conversion of audiometric data from dB HL to dB SPL at the eardrum using age-appropriate average or measured client-specific conversion factors for the audiometric transducer used,
fast, automated processes for measurement of client-specific real-ear-to-dial difference (REDD) and real-ear-to-coupler difference (RECD) values,
2cc coupler targets for gain and SSPL90 incorporating age-appropriate or client-specific RECD and hearing aid-specific conversion factors, including microphone location and CIC deep insertion effects,
automatic conversion of test box measurements of hearing aid output to estimated output at the eardrum (aided SPLogram) using age-appropriate or client-specific RECD, including deep insertion effects,
novel, time-varying test box signals which incorporate hearing aid microphone location and vocal effort effects for soft, average and loud speech, and
novel, time-varying real-ear test signals which incorporate vocal effort effects for soft, average and loud speech.
The Speechmap/DSL fitting process integrates all these features with a consistent user interface and SPLogram data display. The following sections explain how each of these features is applied.
Assessment for Hearing Aid Fitting
As outlined in Figure 2, the first stage of the hearing aid fitting process is assessment. Because hearing aids ultimately deliver sound to the eardrum, accurate threshold and UCL data in terms of eardrum SPL are essential for successful hearing aid fitting. The dB HL audiogram has limitations when used for defining hearing levels for the purpose of choosing an appropriate hearing aid (Seewald et al, 1993). This is because audiometers are calibrated in dB HL referenced to normal average adult hearing threshold. The greater the individual's ear acoustics deviate from those of the average adult, the greater the inaccuracy in precisely defining the client's thresholds and UCLs in dB SPL at the eardrum.
Generally, when TDH headphones are used to measure hearing, the degree of accuracy with which eardrum sound pressure level (SPL) values can be predicted from dB HL values is within a range of about 12 dB between 750–1500 Hz and within a range of about 20 dB at other frequencies (Hawkins et al, 1990). Figure 3 shows a client's thresholds and UCLs in dB HL. Using average transformation values, the predicted eardrum SPLs for threshold and UCL can be calculated. Calculations used to transform dB HL threshold and UCL values to SPL eardrum reference are shown in Tables 1 and 2 respectively, and the results are plotted in Figure 4. For a given individual, it can be anticipated that the actual threshold and UCL values could lie within the range shown by the dashed lines if using insert phones and within the range shown by the dot-dash lines if using TDH phones. As shown, on average, a 60 dB HL threshold at 2000 Hz would be 75 dB SPL at the eardrum. However, for a given individual, the eardrum threshold could be 65 dB SPL or 85 dB SPL. Amplification-related decisions would be different for a threshold of 65 dB SPL than for a threshold of 85 dB SPL. Output-limiting considerations would also differ given a 20 dB range. Insert earphones are a preferable transducer for defining hearing loss because the range of variability in predicting eardrum SPL threshold values using average transformations is smaller (Hawkins et al, 1990; Gauthier and Rapisardi, 1992; Zelisko et al, 1992). However, for either transducer, there is considerable inaccuracy in predicting eardrum thresholds and UCLs from HL data for a given individual when average transformation values are used. The predictive accuracy is even poorer for infants and children when adult average conversion factors are used.
Figure 3:

Threshold and UCL values plotted in dB HL as a function of frequency (kHz).
Table 1.
An example of the conversion from threshold measurements in dB HL to eardrum SPL at threshold.
| Frequency (Hz) |
|||||||||
|---|---|---|---|---|---|---|---|---|---|
| 250 | 500 | 750 | 1000 | 1500 | 2000 | 3000 | 4000 | 6000 | |
| Threshold (dB HL) | 20 | 25 | 30 | 35 | 50 | 60 | 70 | 75 | 70 |
| (+) Real-Ear-to-Dial Difference (dB) | 19 | 13 | 10 | 9 | 10 | 15 | 16 | 15 | 16 |
| (=) Eardrum Threshold (dB SPL) | 39 | 38 | 40 | 44 | 60 | 75 | 86 | 90 | 86 |
Table 2.
An example of the conversion from UCL measurements in dB HL to eardrum SPL at UCL.
| Frequency (Hz) |
|||||||||
|---|---|---|---|---|---|---|---|---|---|
| 250 | 500 | 750 | 1000 | 1500 | 2000 | 3000 | 4000 | 6000 | |
| UCL (dB HL) | 78 | 90 | 94 | 98 | 100 | 102 | 106 | 106 | 100 |
| (+) Real-Ear-to-Dial Difference (dB) | 19 | 13 | 10 | 9 | 10 | 15 | 16 | 15 | 16 |
| (=) Eardrum UCL (dB SPL) | 97 | 103 | 104 | 107 | 110 | 117 | 122 | 121 | 116 |
Figure 4:

Threshold and UCL values transformed to eardrum SPL values as a function of frequency (kHz). The two standard deviation range for insert earphones and TDH headphones (Hawkins et al, 1990) are plotted for comparison purposes.
The Speechmap/DSL fitting system attempts to reduce the errors associated with the traditional HL audiogram approach by converting all relevant variables to an eardrum SPL reference, and by providing procedures to quickly and accurately measure individualized HL to SPL transformations.
The minimum assessment data required by Speechmap/DSL includes (1) a pure tone audiogram; (2) an indication of the audiometric transducer used to obtain it and (3) the age of the client. To accommodate the fitting of amplification for children, threshold must be entered at minimally two frequencies, but octave and interoctave frequencies from 250 to 6000 Hz are accepted. From this information, eardrum SPL at threshold and UCL will be estimated using age-appropriate average data (Cornelisse et al, 1994, 1995). If measured UCL data are available, they will be used in place of the estimates. Specific procedures for measuring threshold and UCL will not be discussed here. Readers interested in UCL measurement procedure instructions are directed to Mueller and Bright (1994).
To improve the accuracy of assessment data, the Speechmap/DSL fitting system assists the hearing healthcare professional to quickly measure the individual's unique ear transform values and uses this information to accurately predict eardrum SPL values for threshold and UCL. The REDD (the difference, in dB as a function of frequency, between the SPL produced by a transducer at an individual's eardrum and the audiometer dial reading) is measured when headphones have been used. The RECD (the difference, in dB as a function of frequency, between the SPL produced by an insert earphone at an individual's eardrum and in a 2cc coupler) is measured when insert earphones are used. These client-specific conversion factors are used to convert threshold and UCL values in HL to eardrum SPL levels. This enables precise definition of the individual's auditory area for the purposes of selecting and fitting amplification. Results of a recent study utilizing the Speechmap/DSL fitting system REDD and RECD measurement procedures showed agreement between predicted and measured real-ear
SPL values within 2.5 dB from 250 to 4000 Hz for the RECD, and within 3.6 dB for the REDD (Scollie et al, 1998). The measurement procedures for, and application of, REDD and RECD are covered in Appendix A and B respectively.
HEARING AID SELECTION
1. Deriving Real-Ear Hearing Aid Performance Criteria for Amplified Speech and Maximum Hearing Aid Output
The threshold and UCL values, in dB SPL near the eardrum as a function of frequency, define the client's residual auditory area. The DSL method equations, stored within the software of the Speechmap/DSL fitting system, are applied to the auditory area information to calculate desired eardrum SPL levels for amplified speech and maximum hearing aid output (Cornelisse et al, 1994, 1995). As outlined in Figure 2, these real-ear hearing aid performance criteria are the first step in the selection stage of the hearing aid fitting process.
Displaying Assessment and Selection Information: The Unaided SPLogram
Figure 5 illustrates an unaided SPLogram used in the Speechmap/DSL fitting system. Audiometrie test results and target criteria for real-ear performance are displayed in terms of dB SPL near the eardrum as a function of frequency. For this case, the client has a reduced dynamic range of hearing compared to normal. The goal in hearing aid fitting for this individual is to amplify speech to levels above threshold, but limit amplification so that loud sounds do not exceed uncomfortable loudness levels.
Figure 5:

Unaided SPLogram used in the Speechmap/DSL fitting system.
2. Calculation of 2cc Coupler Targets
The first stage of the selection process results in the generation of real-ear targets of amplified speech and maximum hearing aid output. The eardrum SPL reference is advantageous for the hearing healthcare professional and for counselling the client. However, most hearing aid manufacturers express the electroacoustic performance of hearing aids in terms of 2cc coupler values measured in a test box. Hearing aid performance in the real ear differs from performance in the test box because the sound reaching the hearing aid microphone is different in the two cases (microphone location effects [MLE]), and because the real ear presents a different acoustic load to the hearing aid than does the 2cc coupler (the real-ear-to-coupler difference [RECD]). The Speechmap/DSL fitting system automatically applies hearing aid-specific MLE and age-appropriate average or individually measured RECD values to convert the dB SPL eardrum target criteria to 2cc coupler (test box) gain and SSPL90 values. Tables 3 and 4 provide the hearing aid-specific MLE and age-appropriate RECD values used in the Speechmap/DSL system.
Table 3.
Microphone location effects used in the Speechmap/DSL fitting system.
| Mic Location Effects (dB) | Frequency (Hz) |
||||||||
|---|---|---|---|---|---|---|---|---|---|
| 250 | 500 | 750 | 1000 | 1500 | 2000 | 3000 | 4000 | 6000 | |
| BTE | 0.5 | 1.2 | 0.9 | 0.3 | 2.5 | 4.1 | 2.8 | 3.7 | 1.6 |
| ITE | 0.5 | 1.8 | 2.0 | 1.5 | −0.3 | 3.8 | 3.3 | 4.3 | 0.4 |
| ITC | 0.3 | 0 | 0.4 | 1.2 | −1.9 | 2.1 | 3.5 | 6.4 | −1.8 |
| CIC | 0 | 0 | 0 | 1.0 | 1.0 | 2.5 | 6.0 | 11.0 | 3.0 |
| Body Aid | 3.0 | 4.0 | 2.0 | 0 | −4.0 | −4.0 | 0 | 0 | 0 |
Table 4.
Average age-appropriate RECD values (referenced to an ITE coupler) used in the Speechmap/DSL fitting system. The RECD values for CIC hearing aids (referenced to an ITE coupler) are also shown.
| Average RECD (dB) | Frequency (Hz) |
||||||||
|---|---|---|---|---|---|---|---|---|---|
| 250 | 500 | 750 | 1000 | 1500 | 2000 | 3000 | 4000 | 6000 | |
| <12 months | 7.2 | 9.4 | 10.1 | 11.9 | 13.3 | 13.7 | 17.5 | 20.7 | 23.2 |
| 13–24 months | 9.1 | 9.8 | 10 | 11.5 | 12.5 | 13.4 | 15.1 | 17.6 | 16.3 |
| 25–48 months | 5.8 | 7.4 | 8.8 | 10.7 | 12 | 12.4 | 14.5 | 15.3 | 16.2 |
| 49–60 months | 4.6 | 7.6 | 8.6 | 8.7 | 10.8 | 11.9 | 13 | 14.1 | 15.6 |
| >60 months | 4 | 4.2 | 4.4 | 5.2 | 6.5 | 8 | 10.2 | 12.2 | 14.5 |
| RECD used for CICs | 5.8 | 8.2 | 9.8 | 10.9 | 12.5 | 13.9 | 17 | 19.9 | 22.9 |
The schematics in Figures 6, 7 and 8 illustrate how the dB SPL eardrum target criteria are converted to 2cc coupler (test box) gain and SSPL90 values.
Figure 6:

Equation used to transform real-ear targets for amplified speech to corresponding 2cc coupler gain values.
Figure 7:

Equation used to calculate 2cc coupler fullon gain values
Figure 8:
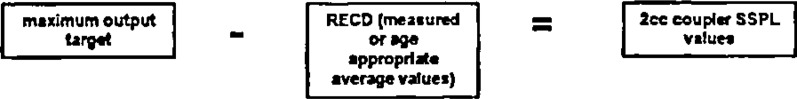
Equation used to transform real-ear maximum output targets to SSPL90 values.
The above conversions specify 2cc coupler gain for linear operation and assume that the hearing aid is saturated with a 90 dB SPL input. The effects of deep insertion are automatically handled by applying the appropriate MLE and increasing the RECD values when a CIC type hearing aid is indicated.
When individual RECD measurements cannot be obtained, Speechmap/DSL provides age-appropriate average RECD values (Feigin et al, 1989). This is an important consideration when fitting amplification for children where 2cc coupler measurements must often be relied on because the child will not cooperate for real-ear measurements. To improve the accuracy of 2cc coupler targets, Speechmap/DSL provides a fast, automated process for measuring individual RECD values. This process is described in detail in Appendix B.
FITTING AND VERIFICATION
At the end of the selection stage, a hearing aid with appropriate coupling is selected for the client. The next stage in the process is fitting and verification. At this stage the selected hearing aid is adjusted until the measured hearing aid performance meets the target criteria developed from the assessment data.
Two important considerations exist at the fitting and verification stage of the Speechmap/DSL fitting process. Firstly, where is the hearing aid verification going to be performed? Secondly, what input signal levels should be used in the verification process? The following discussion will address these considerations as they relate to the fitting and verification of compression hearing aids.
1. Verification Modes
The Speechmap/DSL fitting system offers two verification modes: real-ear measurement mode (REM) and simulated real-ear measurement mode (S-REM).
Real-Ear Measurement Mode
Insertion gain measurements are not used in the verification process of the Speechmap/DSL fitting system. There are three reasons for this:
Insertion gain target criteria and measurement results do not allow a direct comparison between the electroacoustic performance of the hearing aid and the auditory characteristics of the client to be fitted.
For compression hearing aids, an insertion gain target is only valid for one particular input signal. Different targets are required for each different type (not just level) of input signal.
Insertion gain is meaningful only in the context of sound-field audiometry. Insertion gain indicates the improvement in the sound-field audiogram resulting from the insertion of a functioning hearing aid. An insertion gain fitting target implicitly assumes a sound-field audiogram. The use of an insert or headphone audiogram often results in a requirement for unnecessary gain in the region of the ear canal resonance.
The Speechmap/DSL fitting system transforms all audiometric and electroacoustic variables to an eardrum SPL reference. This allows for direct comparisons between measured hearing aid performance and the client's residual auditory area. A loudspeaker delivers appropriate test signals to the client; hearing aid output (REAR, real-ear aided response) is measured at the eardrum using a probe microphone. This is an advantageous approach when fitting compression instruments because hearing aid performance measured with multiple input signals (soft, average, and loud conversational speech) can quickly be evaluated relative to the client's dynamic range of hearing.
Simulated Real-Ear Measurement (S-REM) Mode
Clinically, the 2cc coupler can be utilized for verification purposes (Moodie et al, 1994; Seewald, 1995; Moodie, 1996). A major advantage of this approach is that it significantly reduces the amount of time and degree of cooperation required in the fitting and verification process. A second benefit is the control over the acoustic environment achieved by working in a test box. This reduces errors caused by acoustic reflections and by the activation of signal processing circuits by ambient noise. The Speechmap/DSL fitting system provides a unique method of verifying hearing aid performance in the 2cc coupler—simulated real-ear measurement mode (S-REM) (Sinclair et al, 1996). This verification option is available because we have defined the difference between the individual's ear and the 2cc coupler (i.e., the RECD).
The schematic shown in Figure 9 illustrates how the Speechmap/DSL fitting system uses the RECD in combination with 2cc coupler measurements to verify hearing aid performance.
Figure 9:

Equation used in simulated real-ear measurement mode to transform 2cc coupler measurements of hearing aid performance to real-ear predictions for fitting and verification purposes.
The test signal is defined in an undisturbed sound field and is then modified by the appropriate hearing aid microphone location effects. In this way, any non-linear processing in the hearing aid is applied to the microphone location effects, as it would be in the real-ear case. Table 5 provides the input stimulus levels used for fitting and verification purposes in the Speechmap/DSL system. The hearing aid-specific MLE values that are applied to the input signals were provided in Table 3. The RECD that is appropriate for the selected hearing aid type and coupler type to be used (ITE or BTE) is applied to the measured 2cc coupler output to derive predicted real-ear output. For example, the RECD applied for a BTE hearing aid assumes that it is connected to a BTE (HA-2) coupler while that applied for a CIC accounts for the deeper insertion typical of these hearing aids.
Table 5.
Sound field stimulus levels used in the Speechmap/DSL fitting system.
| STIMULUS LEVELS | Frequency (Hz) |
overall rms | ||||||||
|---|---|---|---|---|---|---|---|---|---|---|
| (dB SPL) | 250 | 500 | 750 | 1000 | 1500 | 2000 | 3000 | 4000 | 6000 | |
| Child Average | 62.2 | 63.9 | 60.1 | 55.2 | 50.9 | 49.7 | 45.0 | 41.5 | 41.6 | 70 |
| Adult Average | 60.0 | 62.0 | 57.2 | 55.0 | 52.7 | 49.0 | 46.8 | 46.0 | 45.2 | 70 |
| Adult Loud | 60.0 | 68.6 | 73.5 | 76.0 | 75.6 | 71.3 | 66.4 | 63.3 | 59.1 | 85 |
| Adult Soft | 45.5 | 47.0 | 40.0 | 37.5 | 36.7 | 34.8 | 29.4 | 29.6 | 32.1 | 55 |
| MPO* | 85 or 90 | 85 or 90 | 85 or 90 | 85 or 90 | 85 or 90 | 85 or 90 | 85 or 90 | 85 or 90 | 85 or 90 | 85 or 90 |
The MPO stimulus consists of a an 85 ms pulsed tone at 85 dB SPL in REM mode or at 90 dB SPL in S-REM mode.
A study examining the correlation between predicted real-ear hearing aid performance using similar equations and actual measurements of real-ear performance has shown the predictions to be accurate (Seewald et al, 1994).
2. What Input Signals Should be Used for Verification Purposes?
When adjusting compression hearing aids to make speech audible and comfortable, it is important that the test signals reflect overall level, temporal and spectral properties of soft, average and loud speech to the extent possible.
At present, the most frequently recommended input signal levels and measurement methods for the fitting of compression hearing aids include:
pure-tone input signals with measurements of gain and/or output,
broad-band input signals with measurements of gain and/or output,
pure-tone input/output (I/O) functions, and
broad-band input/output (I/O) functions.
Unfortunately such static gain measurements do not accurately predict gain for real speech inputs. Figure 10 compares average gain for four wide-dynamic-range compression instruments for a swept 70 dB tone, 70 dB SPL composite noise (speech-weighted broad-band noise as per ANSI S3.42) in 1/3 octave bands, and 70 dB SPL real speech in 1/3 octave bands (Stelmachowicz et al, 1996). It can be seen that, at 4000 Hz, there is 9 dB more gain for real speech than for the pure-tone signal and 6 dB more gain than for the broad-band speech-weighted signal. Having this knowledge, we might believe that if we missed our target at 4000 Hz by approximately 9 dB while using a 70 dB pure-tone input signal it would be okay because speech is going to provide 9 dB more gain at that frequency. However, clients do not listen to gain, they listen to output. Figure 11 shows the average outputs calculated for the same four wide-dynamic-range compression hearing aids for the same three inputs. Note that at 4000 Hz, the calculated output for the speech signal is 34 dB less than that for the pure-tone signal and 17 dB less than the output for the speech-weighted broad-band noise. The listener receives less output for speech than for the other test signals because the 1/3 octave band level of the average speech input at 4000 Hz is only 46 dB and the gain of the hearing aid is reduced because compression is activated by the 70 dB overall rms level. The gain for the 70 dB SPL swept tone is also reduced by the compression, but the input at 4 kHz is 24 dB higher (70–46) than the 1/3 octave band level for speech and therefore, output for speech is less than the output obtained for the pure-tone input signal.
Figure 10:

Mean gain (dB) measured as a function of frequency (Hz), with four WDRC instruments using a swept 70 dB tone and 70 dB SPL speech-weighted (composite) noise relative to 70 dB SPL real speech (Stelmachowicz et al, 1996).
Figure 11:

Mean calculated output (dB SPL) measured as a function of frequency (Hz), with four WDRC instruments using a swept 70 dB tone and 70 dB SPL speech-weighted (composite) noise relative to 70 dB SPL real speech.
Similarly, static input/output (I/O) curves do not predict the output of compression hearing aids for speech. Figure 12 illustrates this point. The figure shows an I/O curve measured for a compression hearing aid using a 3150 Hz steady tone compared to the 3150 Hz 1/3 octave band levels for a speech passage having the same overall rms levels. The horizontal axis is the overall long-term rms level of the input signal (either speech or a 3150 Hz pure tone). The vertical axis is the long-term average output level of the hearing aid measured in a 1/3 octave band at 3150 Hz for the two test signals. The 1/3 octave band level at 3150 Hz for speech with an overall rms of 70 (average conversational speech) is approximately 47 dB. Using a 47 dB pure-tone input to this hearing aid to simulate speech would lead one to believe that the hearing aid output in the 3150 Hz 1/3 octave band would be 103 dB SPL. However, the actual hearing aid output in the 3150 Hz 1/3 octave band is 90 dB SPL. Similarly, for speech with an overall rms level of 85 dB, a pure-tone input signal at the 1/3 octave band level for 85 dB speech (66 dB SPL) predicts a hearing aid output in the 3150 Hz 1/3 octave band of 108 dB SPL when in fact the measured output for speech in this band is 93 dB SPL. The speech spectrum used has been frequency weighted as a function of level as shown in Figure 14.
Figure 12:

I/O curve measured for a compression hearing aid using a 3150 Hz steady tone compared to 31501/3 octave band levels for speech.
Figure 14:

Test levels (sound-field SPL) for Audioscan's loud, average and soft swept burst-biased tones as a function of frequency (kHz).
In an attempt to better predict hearing aid output for real speech signals Audioscan has developed amplitude-modulated tones for use with compression hearing aids. The Audioscan SWEPT test signal consists of 16 or 64 tones presented in sequence, with each tone constructed as in Figure 13. The 75 ms burst preceding each tone sets the gain of the compression circuit as it would be set by repeated speech peaks while the measurement of hearing aid output occurs during recovery, with the input at the 1/3 octave band level for the speech being simulated. The measurement takes about 30 ms after a delay of approximately (40/frequency) seconds. The frequency weightings used for soft (55dB) average (70 dB) and loud (85 dB) are shown in Figure 14. The corresponding values as a function of frequency for each curve are shown in Table 5. The DYNAMIC test signal consists of 64 tones at 1/3 octave frequencies presented at 12 dB above and 18 dB below the long-term average band levels of Figure 14. The order of presentation and the duration of each tone are based on the order and duration of significant 1/3 octave band levels in the phrase “Joe took father's shoe-bench out. She was waiting at my lawn”. An additional signal (MPO) consisting of a series of 85 ms tone bursts at 85 or 90 dB estimates worst case output in response to loud environmental sounds.
Figure 13:

Construction of the Audioscan burst-biased tone average level (70 dB SPL) as a function of time (msec).
Figures 15 through 20 show how well the amplitude-modulated signals estimate performance as compared with real speech for six different compression hearing aids. In each figure, the dashed lines show long term average hearing aid output levels measured in 1/3 octave bands for the rainbow passage (The Hair Cells and Hearing Aids CD by C.I. Berlin) while the solid lines show levels measured using the Audioscan test signals described above. The lower dashed curve is the level exceeded by 80% of the speech samples in each band, the middle dashed curve is the average over the entire speech passage and the upper dashed curve is the level exceeded by 1% of the samples in each band. The upper and lower solid curves (MAX and MIN) show the dynamic range as measured using the Audioscan DYNAMIC test signal while the middle solid curve (AVG) is the long-term average speech spectrum as measured by the Audioscan SWEPT test signal.
Figure 15:

Predicted real-ear hearing aid performance (dB SPL) as a function of frequency (Hz) for the Oticon Digifocus™ hearing aid using Audioscan Speechmap/DSL test signals (DYNAMIC and SWEPT) compared with real speech (RAINBOW).
Figure 20:

Figure 19: Predicted real-ear hearing aid performance (dB SPL) as a function of frequency (Hz) for the Widex Senso™ hearing aid using Audioscan Speechmap/DSL test signals (DYNAMIC and SWEPT) compared with real speech (RAINBOW).
Figure 16:

Predicted real-ear hearing aid performance (dB SPL) as a function of frequency (Hz) for the Qualitone K-AMP hearing aid using Audioscan Speechmap/DSL test signals (DYNAMIC and SWEPT) compared with real speech (RAINBOW).
Figure 17:

Predicted real-ear hearing aid performance (dB SPL) as a function of frequency (Hz) for the Resound BT2™ hearing aid using Audioscan Speechmap/DSL test signals (DYNAMIC and SWEPT) compared with real speech (RAINBOW).
Figure 18:

Predicted real-ear hearing aid performance (dB SPL) as a function of frequency (Hz) for the Siemens Music™ hearing aid using Audioscan Speechmap/DSL test signals (DYNAMIC and SWEPT) compared with real speech (RAINBOW).
Figure 19:

Predicted real-ear hearing aid performance (dB SPL) as a function of frequency (Hz) for the Unitron SoundFX® hearing aid using Audioscan Speechmap/DSL test signals (DYNAMIC and SWEPT) compared with real speech (RAINBOW).
Displaying Verification Information: The Aided SPLogram
For verification purposes, the measured real-ear performance or predicted real-ear performance is displayed on an aided SPLogram. Measured performance can be quickly evaluated relative to the target criteria developed at the selection stage for the client to be fitted. Figures 21 through 23 illustrate the aided SPLogram results obtained for a compression hearing aid using different speech-like input signal levels (soft, average and loud conversational speech) and loud environmental sounds (MPO).
Figure 21:

Aided SPLogram obtained using average SWEPT AVERAGE burst-biased tone and MPO inputs.
Figure 23:

Aided SPLogram obtained using DYNAMIC SOFT stimulus.
The bars shown in Figures 22 and 23 are the result of the Speechmap/DSL fitting system DYNAMIC test stimulus. Since the input dynamic range at each 1/3 octave frequency has been constrained to 30 dB, compression will result in bars shorter than 30 dB while expansion will result in bars longer than 30 dB.
Figure 22:

Aided SPLogram obtained using DYNAMIC LOUD stimulus.
For this case example, the SWEPT AVG input closely approximates the Speechmap/DSL target criteria, and loud environmental sounds remain below UCL (Figure 21). There is little compression occurring for soft speech-like input levels (Figure 23), and more compression occurring for loud speech-like input levels (Figure 22). Soft speech has been amplified so that more than half of its dynamic range lies above threshold, which can be expected to produce good understanding of sentences in quiet. Loud speech has been compressed to remain within the individual's residual auditory area. Based on these results we would conclude that this is an appropriate electroacoustic fitting for the client under consideration.
Evaluation of Aided Performance
If the hearing aid fitting process has been approached in a conscientious and systematic manner, it is expected that the client will derive anticipated benefit from the amplification characteristics provided. Procedures to evaluate aided performance may include (1) speech perception measures and (2) self-report procedures. Clinical speech perception measures attempt to predict long-term performance within the client's everyday communication environment. Self-report procedures assess the self-perceived benefit derived from amplification. The Connected Speech Test (CST) (Cox and Alexander, 1992), Speech Perception in Noise (SPIN) (Bilger et al, 1984) and the Profile of Hearing Aid Benefit (PHAB) (Cox and Gilmore, 1990) are examples of available speech perception measures and self-report procedures.
SUMMARY
The Speechmap/DSL fitting system is an integrated approach to fitting hearing aids that takes advantage of the signal generation and measurement capabilities of the Audioscan RM500 real-ear hearing aid analyzer. By combining auditory-area mapping with unique, time-varying test signals and fast automated RECD and REDD measurement procedures, it provides a complete fitting package that addresses many of the sources of error inherent in more traditional methods.
ACKNOWLEDGEMENTS
This work has been supported by a grant from the Ontario Ministry of Health to the Ontario Rehabilitation Technology Research and Development Consortium. We express appreciation to Richard Seewald and colleagues of the Hearing Health Care Research Unit at The University of Western Ontario. Their collaboration on the Speechmap/DSL fitting system project helped to ensure its success. Comments provided by Richard Seewald and Michael Valente on earlier versions of this article are gratefully acknowledged.
APPENDIX A
REAL-EAR TO DIAL DIFFERENCE (REDD) MEASUREMENT PROCEDURE
The REDD is defined as the difference, in dB, as a function of frequency, between the SPL at the individual's eardrum and the audiometer dial setting that produced it. When headphones have been used for audiometry, a measured REDD may be used to provide a more accurate definition of the individual's auditory area for the purpose of hearing aid fitting. The following steps outline the Speechmap/DSL REDD measurement procedure:
a probe-tube is placed within 6mm of the individual's eardrum
the same headphones used for obtaining audiometric data are placed over the client's ears
the audiometer dial frequency is set to 250 Hz and a 70 dB HL continuous stimulus is presented
the RM500 real-ear measurement system measures the SPL delivered at the individual's eardrum by the headphone, calculates the REDD (SPLtm − 70) and plots it on screen
the RM500 signals the operator to advance the audiometer frequency setting and the process is repeated for all octave and interoctave audiometric test frequencies
the measurement time required is approximately 10 seconds
Figure 24 illustrates the Speechmap/DSL screen used for measuring the REDD. An individual's measured REDD is displayed. The average adult REDD is also displayed for comparative purposes.
Figure 24:

Measured REDD as a function of frequency (kHz). Average REDD is plotted for comparison purposes.
If headphones have been indicated as audiometric transducers, the Speechmap/DSL fitting system uses the entered dB HL threshold and UCL values and the individual's measured REDD data to calculate the predicted threshold levels in eardrum SPL as a function of frequency. Table 6 shows how these calculations are conducted for a case example. Table 7 shows the average REDD values used by the Speechmap/DSL fitting system for comparison purposes.
Table 6.
Calculation of eardrum threshold levels (dB SPL) for four frequencies from collected dB HL data and measured REDD values.
| Frequency (Hz) |
||||
|---|---|---|---|---|
| 500 | 1000 | 2000 | 4000 | |
| Threshold (dB HL) | 25 | 35 | 60 | 75 |
| (+) Measured REDD (dB) | 18 | 16 | 18 | 10 |
| (=) Eardrum Threshold (dB SPL) | 43 | 51 | 78 | 85 |
Table 7.
Average REDD values used in the Speechmap/DSL fitting system.
| Frequency (Hz) |
|||||||||
|---|---|---|---|---|---|---|---|---|---|
| 250 | 500 | 750 | 1000 | 1500 | 2000 | 3000 | 4000 | 6000 | |
| Average REDD (dB) | 19 | 13 | 10 | 9 | 10 | 15 | 16 | 15 | 16 |
APPENDIX B
RECD MEASUREMENT PROCEDURE
The RECD is defined as the difference, in dB, as a function of frequency, between the SPL produced by an insert transducer at the eardrum and in a 2cc coupler.
Adult ear canal volumes are in the range of .65 to 1.75cc. Children's ear canal volumes are smaller, and range from .3 to 1.0cc (Hall and Chandler, 1994). Hearing aid performance measured on a 2cc coupler will not accurately reflect real-ear performance (Feigin et al, 1989). The hearing aid will generally produce higher output in the ear of the listener than in the 2cc coupler, because the ear of the individual is smaller in volume than the coupler. This is an important consideration when fitting amplification for children where 2cc coupler measurements are often relied upon because the child will not cooperate for real-ear measurements.
When insert earphones have been used for audiometry, a measured RECD may be used to provide a more accurate definition of the individual's auditory area for the purpose of hearing aid fitting. Measured RECD values may also be used to provide more accurate 2cc coupler targets for hearing aid specification and may be used to more accurately predict real-ear hearing aid performance from 2cc coupler measures. If an RECD measurement cannot be obtained, the Speechmap/DSL software applies age-appropriate average values at these steps in the fitting process (Bentler and Pavlovic, 1989; Feigin et al, 1989).
The RECD measurement is one of the most important components of the Speechmap/DSL fitting system (Seewald et al, 1996; Seewald, 1997). It enables precise:
definition of hearing levels and UCL in dB SPL at the eardrum,
specification of hearing aid gain and SSPL90 for selection purposes,
fitting and verification in the controlled environment of the test box.
The following steps outline the Speechmap/DSL fitting system RECD measurement procedure. On-screen instructions are provided on the Audioscan RM500 to facilitate measurement of the RECD. The RECD measurement can be performed at the time of the hearing assessment; the values can be printed and re-entered when the client is seen on subsequent visits.
Coupler Portion of the RECD Measurement
The coupler portion of the RECD measurement procedure can be conducted prior to having the client present. These data are stored as long as power is applied.
an insert earphone is driven by an electrical signal from the auxiliary speaker jack
the insert earphone tubing is coupled to the BTE coupler
the 2cc coupler response of the insert earphone is measured and stored
Real-Ear Portion of the RECD Measurement
the probe-tube is inserted into the ear of the client as in a normal real-ear measurement
the insert earphone tubing is coupled to the custom earmold tubing or standard foam eartip
the earmold (RECD is measured using the earmold when assessment measures have been made with earmold) or foam eartip is inserted over the probe tube in the client's ear
the insert earphone is driven by the same electrical signal as for the coupler measurement
the real-ear response of the insert earphone is measured
the RECD is automatically calculated by subtracting the stored coupler response from the real-ear response
Figure 25 illustrates the RECD measured for an adult subject. The average adult RECD is also displayed for comparative purposes.
Figure 25:

Measured RECD as a function of frequency (kHz). Average RECD is plotted for comparison purposes.
The RECD measurement should be repeated whenever a child has grown, when a new earmold is obtained and if a change in middle ear status has occurred (i.e., myringotomy tubes are present) [Westwood and Bamford, 1995; Sinclair et al, 1996; Martin et al, 1997].
Table 8 demonstrates how the Speechmap/DSL fitting system calculates user gain values for the case example using measured RECD data.
Table 8.
Calculation of 2cc coupler user gain values at four frequencies for the case example.
| Frequency (Hz) |
||||
|---|---|---|---|---|
| 500 | 1000 | 2000 | 4000 | |
| Amplified speech target (dB SPL) | 71 | 75 | 94 | 103 |
| (−) Speech input levels (dB SPL) | 62 | 55 | 49 | 46 |
| (−) Measured RECD (dB) | 4 | 7 | 10 | 8 |
| (−) BTE mic. location effects (dB) | 1 | 0 | 4 | 4 |
| (=) 2cc coupler user gain target (dB) | 4 | 13 | 31 | 45 |
NOTE
Audioscan is a registered trademark of Etymonic Design Inc.
Speechmap is a registered trademark of Etymonic Design Inc.
DSL is a registered trademark of The University of Western Ontario.
REFERENCES
- American National Standards Institute. (1992). American National Standard Testing Hearing Aids with a Broad-Band Noise Signal. ANSI S3.42. New York: American National Standards Institute [Google Scholar]
- Bentler RA, Pavlovic CV. (1989). Transfer functions and correction factors used in hearing aid evaluation and research. Ear Hear 10(1):58–63 [DOI] [PubMed] [Google Scholar]
- Bilger R, Neutzel J, Rabinowitz J, Rzeczkowski C. (1984). Standardization of a test of speech perception in noise. J Speech Hear Res 27: 32–48 [DOI] [PubMed] [Google Scholar]
- Cox RM, Alexander GC. (1992). Maturation of hearing aid benefit: Objective and subjective measurements. Ear Hear 13(3):131–141 [DOI] [PubMed] [Google Scholar]
- Cox RM, Gilmore C. (1990). Development of the profile of hearing aid performance. J Speech Hear Res 33: 343–357 [DOI] [PubMed] [Google Scholar]
- Cornelisse LE, Seewald RC, Jamieson DG. (1994). Wide-dynamic range compression hearing aids: The DSL[i/o] approach. Hear J 47(10):23–26 [Google Scholar]
- Cornelisse LE, Seewald RC, Jamieson DG. (1995). The input/output formula: A theoretical approach to the fitting of personal amplification devices. J Aconst Soc Amer 97: 1854–1864 [DOI] [PubMed] [Google Scholar]
- Feigin JA, Kopun JG, Stelmachowicz PG, Gorga MP. (1989). Probe-tube microphone measures of ear-canal sound pressure levels in infants and children. Ear Hear 10(4):254–258 [DOI] [PubMed] [Google Scholar]
- Gauthier EA, Rapisardi DA. (1992). A threshold is a threshold is a threshold … or is it? Hear Instrum 43(3):26–27 [Google Scholar]
- Hall JW, Chandler D. (1994). Tympanometry in clinical audiology. In Katz J. (ed): Handbook of Clinical Audiology (Fourth Edition), Baltimore, MD: Williams & Wilkins, 283–299 [Google Scholar]
- Hawkins DB, Cooper WA, Thompson DJ. (1990). Comparisons among SPLs in Real Ears, 2 cm3 and 6 cm3 Couplers. J Amer Acad Audiol 1: 154–161 [PubMed] [Google Scholar]
- Martin HC, Munro KJ, Langer DH. (1997). Real-ear to coupler differences in children with grommets. Brit J Audiol 31: 63–69 [DOI] [PubMed] [Google Scholar]
- Moodie KS. (1996). A practical approach to hearing aid selection. BSA News 18: 6–8 [Google Scholar]
- Moodie KS, Seewald RC, Sinclair ST. (1994). Procedure for predicting real-ear hearing aid performance in young children. Amer J Audiol 3: 23–31 [Google Scholar]
- Mueller HG, Bright KE. (1994). Selection and verification of maximum output. In: Valente M. (ed): Strategies for Selecting and Verifying Hearing Aid Fittings, New York: Thieme Medical Publishers, 38–63 [Google Scholar]
- Scollie SD, Seewald RC, Cornelisse LE, Jenstad LM. (1998). Validity and repeatability of level-independent HL to SPL transforms. Ear Hear 19(5):407–413 [DOI] [PubMed] [Google Scholar]
- Seewald RC. (1995). The desired sensation level (DSL) method for hearing aid fitting in infants and children. Phonak Focus 20, Stofa, Switzerland: Phonak A/G. [Google Scholar]
- Seewald RC. (1997). Amplification: A child-centered approach. Hear J 50(3):61 [Google Scholar]
- Seewald RC, Moodie KS, Sinclair ST, Cornelisse LE. (1996). Traditional and theoretical approaches to selecting amplification for infants and young children. In Bess FH, Gravel JS, Tharpe AM. (eds): Amplification for Children with Auditory Deficits, Nashville: Bill Wilkerson Center Press, 161–191 [Google Scholar]
- Seewald RC, Moodie KS, Zelisko DLC. (1993). Critique of current approaches to the selection and fitting of hearing aids. JSLPA Monogr Suppl. 1: 29–38 [Google Scholar]
- Seewald RC, Sinclair ST, Moodie KS. (1994). Predictive accuracy of a procedure for electroacoustic fitting in young children. Poster presentation at The American Academy of Audiology Convention, Richmond VA, April
- Sinclair ST, Beauchaine KL, Moodie KS, Feigin JA, Seewald RC, Stelmachowicz PG. (1996). Repeatability of a real-ear-to-coupler-difference measurement as a function of age. Amer J Audiol 5(3):52–56 [Google Scholar]
- Sinclair ST, Moodie KS, Seewald RC. (1997). Pediatric Hearing Instrument Fitting. Phonak Video Focus #2 Booklet, Stofa, Switzerland: Phonak A/G. [Google Scholar]
- Sinclair ST, Seewald RC, Cole WA. (1996). A new real-ear fitting system: Because no two ears are alike. Hear Rev 3(6):46–48 [Google Scholar]
- Stelmachowicz PG, Kopun J, Mace AL, Lewis DE. (1996). Measures of hearing aid gain for real speech. Ear Hear 17(6):520–527 [DOI] [PubMed] [Google Scholar]
- Westwood G, Bamford J. (1995). Probe-tube microphone measurements with very young infants: Real-ear to coupler differences and longitudinal changes in real-ear unaided response. Ear Hear 16(3):263–273 [DOI] [PubMed] [Google Scholar]
- Zelisko DL, Seewald RC, Whiteside S. (1992). Comparing three procedures for predicting ear canal SPL at LDL. ASHA:34(10). [Google Scholar]