Abstract
Purpose
Human Immunodeficiency Virus (HIV) patients develop non-infectious retinopathy characterized by retinal cotton wool spots (CWS) and micro vascular abnormalities. Ophthalmoscopically CWS fade with time. We hypothesized that structural changes should be permanent and possibly visible well after ophthalmoscopic resolution. We used simultaneous spectral domain optical coherence tomography/ scanning laser ophthalmoscope (SD-OCT/SLO) to allow co-localization of the lesions and determine the extent and location of residual damage after ophthalmoscopic resolution of the lesions.
Design
Retrospective, non-interventional case series.
Participants
Eight eyes of seven human immunodeficiency virus (HIV) patients with nineteen resolved retinal cotton wool spots.
Methods
Nineteen retinal cotton wool spots were imaged between 2 and 16 (median 7.84) years after the acute lesions using simultaneous SD-OCT and scanning laser ophthalmoscope (SLO) examinations. The areas of the previous CWS were scanned by overlaying the color retinal image over the SLO image and scanning at high resolution in the horizontal plane thru the resolved lesion. Each CWS lesion had a control area taken from the same eye within 2 disc diameters of the lesion. The thickness of each of the retinal layers was compared between lesions and control areas using a paired t-test using multi-test correction.
Main Outcome Measures
Thickness of the retinal nerve fiber layer (NFL), ganglion cell layer (GCL), inner plexiform layer (IPL), inner nuclear layer (INL), outer plexiform layer (OPL) and outer nuclear (ONL) layers.
Results
The largest loss of thickness was seen in the retinal GCL with a 43% reduction in thickness. There was a statistically significant thinning of the retinal NFL, GCL, IPL, INL and OPL. The median thickness differences ranged from 5 to 7 microns. This difference was highly statistically significant. Another striking finding was the displacement of the ONL towards the retinal surface resulting in an apparent increase in thickness of the ONL by over 15 % (median difference of 12 microns).
Conclusions
Our data using ultrahigh resolution and high speed OCT/SLO shows and quantifies the presence of permanent retinal destruction associated with retinal cotton wool spots in HIV disease.
Introduction
The fundamental lesion causing a cotton wool spot (CWS) is believed to be precapillary arteriolar closure and this occlusive phenomenon is at a similar location in diabetes, hypertension or human immunodeficiency virus (HIV) disease.1 The fundamental cause in HIV may be different than in other systemic diseases (perhaps viral immune complexes),2 and the patient population is also different as HIV patients typically are younger and may have vessels that are not generally as diseased as patients with diabetes and other diseases. Thus, CWS may be more limited in extent or may reabsorb more quickly in HIV than in other diseases.3, 4 McLeod characterized CWS as sentinel lesions rather than ischemic lesions resulting from retinal terminal arteriolar occlusion. He hypothesized that there was a blood flow abnormality as the cause of the ischemia rather than a simple infarct.5
Since retinal infarctions should leave permanent structural damage, it is interesting to note that thinning of the retinal NFL has been reported in both diabetes and HIV disease in the absence of retinitis.6–12 HIV patients with low immune status do develop non–infectious HIV retinopathy, manifested as retinal cotton wool spots (CWS), micro vascular occlusions with capillary nonperfusion, and intra-retinal hemorrhages.1–3, 9, 12 The retinal microvasculopathy of HIV disease is characterized by ultra-structural changes including basal lamina thickening, swelling of endothelial cells, narrowing and occlusion of vascular lumina, and degeneration of pericytes.13
Damage to the inner retina from retinovascular disease in HIV patients is presumed to damage the ganglion cell layer and the retinal nerve fiber layer13 and is most common in patients with low CD4 T cell counts.14, 15 Histologically, CWSs are found in the retinal nerve fiber layer NFL. They originally were described as the accumulation of cytoid bodies—globular structures 10 to 20 um in diameter. Using the silver carbonate method, Wolter16, 17 showed that cytoid bodies are axonal enlargements and that some nerve fibers were interrupted as they passed through the CWSs. Studies by electron microscopy have shown that the cytoid body is formed by proliferation and degeneration of axoplasmic organelles, such as mitochondria, neurofilaments, and endoplasmic reticulum.18–20 Clinically, CWSs disappear in 4 to 12 weeks,21, 22 and according to pathology reports, they leave a localized area of inner ischemic atrophy, as well as loss of nerve fiber, ganglion cell, inner plexiform, and inner portion of the inner nuclear layers. Glial cell proliferation may produce a scar.23 Such glial cell proliferation would be expected to produce a change in the inner retinal density and reflectivity on optical coherence tomography (OCT) because of gliosis and scarring.
Our group and others have demonstrated that even in the era of highly active antiretroviral therapy (HAART) there is both retinal morphological damage8, 9, 24 and visual functional changes in patients with HIV ocular disease.25–28 Furthermore, several retinal hemorheologic abnormalities have been identified in both compromised and immune recovered HIV patients; these include decreased deformability of blood cellular components,29, 30 and decreased retinal perfusion.31–33 They can be contributory to the most frequent clinical signs: cotton wool spots and intra-retinal hemorrhages. However, the precise pathogenesis of vascular and tissue changes in HIV retinopathy is still unknown.
Previously we have shown that OCT imaging using a third generation time-domain instruments (Stratus OCT) as well as coronal scan OCT imaging (OTI SLO/OCT) could be used to identify the CWS and their short term sequellae.34, 35 In that study acute CWS on OCT appeared hyperreflective in the inner retina with a dramatically increased average decibel reflectivity. As the lesions resolved we could continue to identify a slightly hyper reflective nodular area at the sites of the lesions up to three months after they were initially seen. With time, the reflectivity of the inner retina in the area of cotton wool spots became closer to normal. The purpose of our study was to analyze the long-term changes in areas of healed CWS using new technology: the Spectral Domain OCT. We used a spectral-domain OCT and simultaneous confocal SLO imaging (SD-OCT/SLO), the Heidelberg Spectralis (Heidelberg Engineering, Vista California). This instrument was particularly useful because it allows simultaneous imaging of the retinal vascular landmarks with the OCT and allows precise co-localization of the areas of old healed cotton wool spots as documented on initial color fundus photographs.
Methods
This was a retrospective study of HIV patients who were determined by clinical examination and fundus photographs to have retinal cotton wool spots prior to 2006 and who were alive and available for re-examination 2 years or more after the CWS were initially documented. The initial lesions were identified from a database (FileMaker Pro 9.0v1, FileMaker Inc., Santa Clara, CA) that has been in use at the University of California San Diego (UCSD) AIDS Ocular Research unit at the UCSD Jacobs Retina center. We were able to image 7 patients who had had CWS. All patients had CD 4 T cell counts, determined within 3 months of the initial identification of the lesions and we found that the CD4 T cell counts were below 100×106/L in all patients. The median age of the patients at the time of retinal cotton wool spots was 46 years (range 40 to 53). All of the patients were male. Informed consent was obtained after prior approval of the study by the UCSD Human Research Protection Program.
A total of 19 cotton wool spot lesions in 8 eyes of 7 patients were identified by review of charts and confirmation by examination of fundus photographs taken at the time of original clinical examination. Table 1 shows the distribution of the lesions and patient demographics. These patients were imaged consecutively at the UCSD Jacobs Retina Center and the Shiley Eye Center between April and August 2008 after identification of retinal cotton wool spots from a photographic database and a database of HIV patients with cotton wool spots. Mean follow up was 7.84 years after the appearance of their initial lesions (range 2 to 16 years). All cotton wool spots were confirmed by examination of stereo color transparency slides taken with a color fundus camera (Canon USA, Lake Success, NY or Topcon Incorporated, Paramus, New Jersey) and recorded on ASA 100 35 mm film. (Figure 1 A–E) All patients had a repeated medical and ophthalmologic evaluation including visual acuity, slit lamp examination, fundus photograph and fundus biomicroscopy.
Table 1.
Patient demographics and lesion distribution
| Name | Age | Eye | Fundus Region | Follow-up (Years) |
|---|---|---|---|---|
| Case 1 | 53 | OD | S/T | 2 |
| Case 2 | 49 | OS | S/N | 3 |
| Case 3 | 46 | OD | S | 16 |
| Case 3 | 46 | OD | S/N | 16 |
| Case 3 | 46 | OD | I/T | 16 |
| Case 4 | 40 | OD | I/T | 5.5 |
| Case 4 | 40 | OD | I/T | 4.5 |
| Case 4 | 40 | OD | S | 4.5 |
| Case 4 | 40 | OS | S/T | 4.5 |
| Case 4 | 40 | OS | T | 5.5 |
| Case 4 | 40 | OS | I/N | 4.5 |
| Case 5 | 40 | OD | S/T | 5 |
| Case 6 | 52 | OD | I/T | 14 |
| Case 6 | 52 | OD | I | 6 |
| Case 6 | 52 | OD | I/T | 14 |
| Case 7 | 47 | OD | I/T | 7 |
| Case 7 | 47 | OD | I/T | 7 |
| Case 7 | 47 | OS | S | 7 |
| Case 7 | 47 | OS | I/N | 7 |
OD = right eye, OS = left eye, S = superior, I = inferior, T = temporal, S/T = superotemporal, S/N = superonasal, I/T = inferotemporal, I/N = inferonasal
Figure 1.
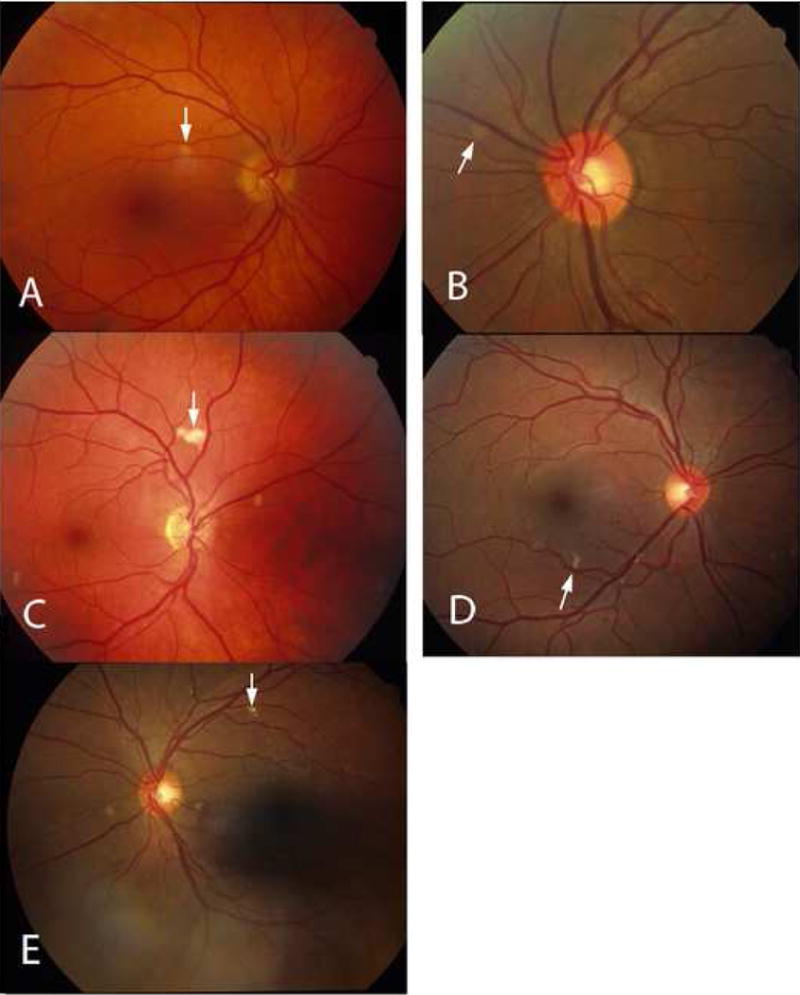
In order to co-localize the OCT scans with the regressed cotton wool spot lesions, patients were imaged using a simultaneous SLO/ Spectral OCT device using red free and infrared SLO imaging to depict fundus landmarks including vessels (Heidelberg Spectralis OCT, Heidelberg Engineering, Vista, CA). Lesions were co-localized by examination of color fundus photographs that were then digitized using a slide scanner at 4000 dpi at a color depth of 14 per channel. Serial Spectral OCT scans were taken in the region of the lesions using the SLO images and prior fundus photographs for guidance. For final analysis, the serial scans were co-localized to the area of the initial retinal cotton wool spot using the overlay software on the OCT. The color fundus photograph and the SLO image were registered and superimposed on each other using commercial imaging software (Adobe Photoshop, Adobe Inc., San Jose, CA). This allowed us to match the outline of the CWS lesion on the color fundus photograph with the IR view of the SLO image. The infrared (IR) SLO image and the OCT image of the Spectralis OCT are acquired simultaneously. This is done with the help of an automated retinal eye tracker that corrects for transverse (horizontal and vertical) and rotational eye movement in the SLO image and transverse and axial eye movements in the OCT image. With this technique, OCT B-scans could be examined at the precise location of the original lesions after electronic overlaying of the color images with the SLO image which was taken simultaneously with the OCT. The retinal vessels were used as localizing landmarks. The scan line and point along that line closest to the center of the ophthalmoscopically visible cotton wool spot was the one chosen for the analysis and quantification of retinal layer thickness. In addition, the retinal eye tracker can be used to improve the signal-to-noise ratio of the images by frame averaging.
For statistical purposes, each CWS lesion had a control area taken from the same eye. That area was chosen from the adjacent retina in an area within 1000 microns of the CWS, free of vessels and approximately along the same nerve fiber layer arc. Each control area was along the same nerve fiber layer bundle and had the same distance from the optic nerve as measured by an electronic caliper. In this way the control area would have the same retinal thickness measurements as the lesion location prior to the CWS. Analysis of the retinal layers was performed by measuring each retinal layer in microns using the scale of the OCT in the A-P dimension. Enlarging the image and determining pixel size accomplished this. Two observers, who were kept masked to whether the lesion was a control or a resolved CWS, performed the measurements by consensus. Each retinal layer was measured in microns and then the data recorded for statistical analysis.
The thickness of each of the layers of retina at the cotton wool spot was compared to its corresponding layers at the nearest control area using the paired t-test. Then the SAS (SAS Institute Inc., NC; version 9.2) multi-test procedure was used to adjust the p values from a family of hypothesis tests. We used the method of Benjamini and Hochberg to adjust the p values which control for the false discovery rate that can occur after multiple comparisons. The technique controls for multiple measurements of the same lesion (multiple retinal layer measurements per lesion).
The inter-observer variability of retinal layer thickness measurements was determined between the two observers. Each observer measured the retinal thickness of six retinal layers in a total of six points; thus a total of 36 measurements per observer were performed. Half of these were in areas of resolved CWS and half in areas of normal retina. In addition, we determined intraobserver repeatability by having one OCT reviewer measure six retina layers in a total of three locations. Each measurement was repeated in a masked fashion a total of three times for a total of 54 measurements. For both the inter-observer variability and intra-observer repeatability Bland- Altman methods were used (SAS, Carey North Carolina). The analysis of the coefficient of repeatability showed a difference between the two observers of ± 2.94 microns with a confidence interval of 95%. The intra-observer repeatability was determined for single OCT scan readers. The analysis of the coefficient of repeatability showed a difference between measurements of ±2.1 microns with a confidence interval of 95%.
Results
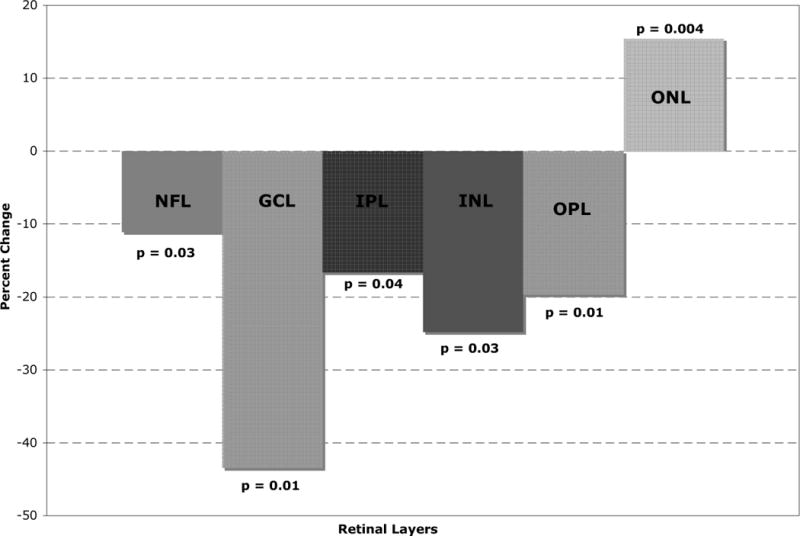
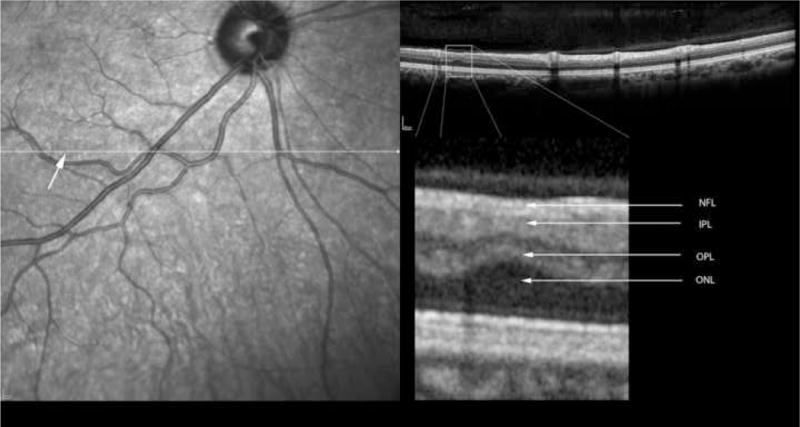
Table 2 shows the measurements of retinal layer thickness for each of the retinal layers using the 19 retinal CWS and their corresponding control areas. In the inner and middle retinal layers, there was a statistically significant thinning of the retinal nerve fiber layer (NFL), ganglion cell layer (GCL), inner plexiform layer (IPL), inner nuclear layer (INL) and the outer plexiform layer (OPL) (Figures 2–6). The median thickness differences ranged from 5 to 7 microns. This difference was highly statistically significant. Another striking finding was the displacement of the outer nuclear layer towards the retinal surface resulting in an apparent (artifactual) increase in thickness of the ONL by over 15 % (median difference of 12 microns), (Figures 2–6).
Table 2.
Retinal layer thickness for each of the healed cotton wool spot and their corresponding control areas.
| Retinal Layer | Mean Thickness Healed CWS ±SD (microns) | Mean Thickness control CWS ±SD (microns) | Median Thickness of Healed CWS (microns) | Median Thickness Control CWS (microns) | mean diff±SD (microns) | Range (microns) Healed CWS | Range (microns) Control CWS | P value* |
|---|---|---|---|---|---|---|---|---|
| NFL | 59.21 ± 30.15 | 66.58 ± 34.2 | 53 | 57 | 7.37±13.72 | 21 – 147 | 33 – 170 | 0.037 |
| GCL | 7.52 ± 6.22 | 13.31 ± 6.4 | 8 | 12 | 5.79±7.62 | 0 – 18 | 6 – 30 | 0.012 |
| IPL | 26.15 ± 9.09 | 31.36 ± 9.12 | 25 | 29 | 5.21±10.36 | 9 – 49 | 17 – 48 | 0.042 |
| INL | 18.52 ± 6.85 | 24.63 ± 7.22 | 18 | 24 | 6.11+11.12 | 6 – 36 | 16 – 44 | 0.037 |
| OPL | 17.63 ± 6.00 | 21.94 ± 4.49 | 17 | 23 | 4.32±6.35 | 6 – 31 | 15 – 30 | 0.017 |
| ONL | 80.15 ± 15.78 | 69.42 ± 9.05 | 81 | 70 | −10.74±11.65 | 48 – 108 | 46 – 82 | 0.005 |
CWS = cotton wool spot, diff = difference, SD = standard deviation, Layer: NFL = nerve fiber layer, GCL = ganglion cell layer, IPL = Inner Plexiform Layer, INL = inner nuclear layer, OPL = outer plexiform layer, ONL = Outer nuclear layer. SD = standard deviation.
Note Outer Nuclear layer is expanded in HIV eyes; it is expanded into thinned inner retina.
p value is corrected to avoid false discovery associated with multiple comparisons, see methods.
Figure 2.
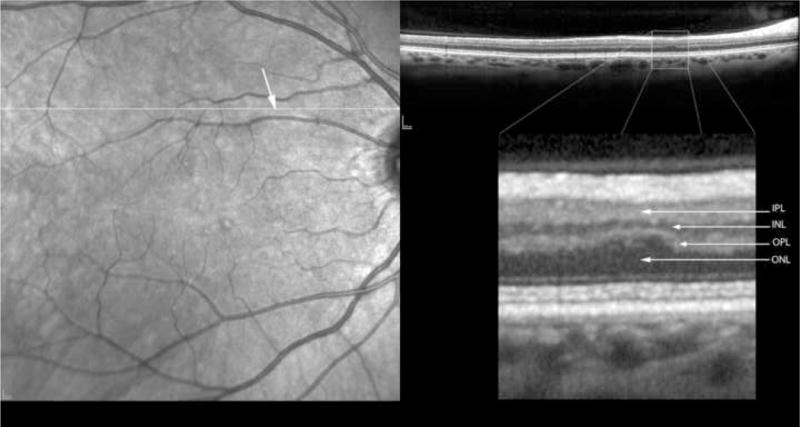
Figure 6.
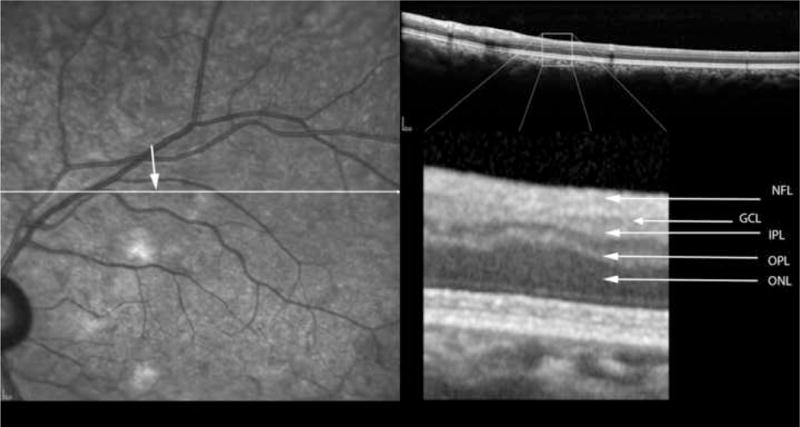
Measured as a percent of the control retinal thickness, the largest loss of thickness was seen in the retinal ganglion cell layer with a 43% reduction in thickness (Figure 7). The inner nuclear layer showed the next largest percent loss of thickness (25%). Figures 2–7 show the loss of tissue in the inner retina, and displacement of the outer nuclear layer by OCT findings not histological findings.
Figure 7.
Discussion
Our data shows for the first time that it is possible, through the use of spectral domain OCT scanning, to detect resolved retinal cotton wool spots in HIV patients for up to 16 years after ophthalmoscopic resolution. This is of particular interest because these lesions may be an important reflection of the HIV disease burden.14, 36 It is important to note that through detection of retinal damage from these lesions, it may be possible to quantitate the burden of HIV disease in terms of retinal destruction by measuring the loss of retinal layers which occur after ophthalmoscopic resolution of a cotton wool spot. We have previously shown that there is cumulative damage to the retinal nerve fiber layer, which is CD 4 nadir cell count dependent. We have hypothesized that such loss may be the result of multiple accumulated infarctions of the retinal nerve fiber layer (as well as damage to the ganglion cell layer which give off the axons of the retinal nerve fiber layer).9 Using high resolution and rapid OCT scanning techniques, it may be possible to determine the numbers and distribution of such lesions, correlate them with retinal nerve fiber layer damage as well as psychophysical measurements of retinal damage such as visual field and electroretinographic damage and indirectly determine the total lifelong HIV disease burden. In addition, this will allow quantification of the vision loss structurally in HIV patients. It is important to note that we found consistent damage to middle retinal layers, including the inner plexiform layer, and the inner nuclear layer. There was displacement of the outer retinal layers towards the vitreous side of the retina, which appeared to be associated with loss of inner retinal tissue. We were careful to choose control areas along the same nerve fiber bundle and immediately adjoining the resolved CWS to minimize bias in the analysis. This was done so that we were comparing locations with the same original retinal layer thicknesses.
Retinovascular damage to the inner retina is common in patients with HIV disease. It has been shown that there may be loss of pericytes and capillary drop out which shares some features with diabetes and other systemic vascular diseases. In HIV disease however retinal neovascularization and intraretinal microvascular abnormalities and confluent areas of ischemia are not common, unlike the case with diabetes.37–40
Retinal cotton wool spots may be a manifestation of HIV as well as hypertension, diabetes and other systemic diseases.14, 36 Each cotton wool spot lesion leaves a permanent retinal defect. The destruction of the ganglion cell layer and nerve fiber layer will lead to a small focal defect in the area of the cotton wool spot as well as a more diffuse defect in retinal sensitivity due to the permanent damage to the nerve fiber layer. The resolution of the spectral OCT that we used is between 3 and 5 microns. The multiple measurements that we have performed appear to be reliable given the resolution of the instrument. Our structural studies using SD-OCT/SLO in the area of resolved cotton wool spots clearly demonstrate this anatomical damage. It is interesting to note that our prior studies of more recently resolved cotton wool spots were performed with time domain (Stratus) OCT.34, 35 These showed that there was hyper-reflectivity of the nerve fiber layer. The eyes studied in this paper were imaged much longer after the resolution of the CWS and they show more long-term damage with inner retinal thinning. In addition, our use of spectral domain OCT shows the changes in greater detail. In HIV disease, visual function tests using retinal contrast and color vision testing are frequently abnormal, and it may be relatively straightforward to attribute this to the cumulative effects of retinal ischemic insults. In diabetes, it is difficult to differentiate vision loss from diabetic macular edema as opposed to ischemia. In HIV disease it is presumed that the functional vision loss seen in vision testing by retinal electrophysiology, visual field, color and contrast testing are likely due to retinal microinfarctions and ischemia and not edema because macular edema and extensive non-perfusion is rare in HIV disease. In HIV patients with immune recovery uveitis, macular edema is reported but none of our patients had this complication.9, 27, 36 Thus vision loss in HIV disease without infectious retinitis is likely due to the cumulative effects of ischemic insults to the retina.
The above study suggests that with current and perhaps even better with future OCT technology, it will be possible to quantify the cumulative damage and location of the damage to the retina in eyes with hypertensive retinopathy, diabetes and HIV disease. This may then develop into a method to non-invasively determine the cumulative vascular insult to the retina in these disorders. Such information may correlate with total lifelong disease burden. The retinal defects are easily recognized by retina specialists and trained observers. We are evaluating automated detection methods to allow computerized recognition and detection of the retinal defects. Such algorithms will allow rapid evaluation of multiple scans of an individual patient’s retina and mapping of all defects.
Figure 3.
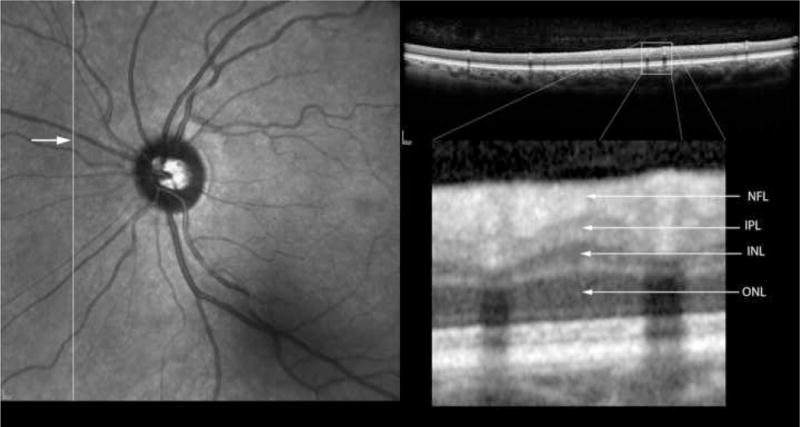
Figure 4.
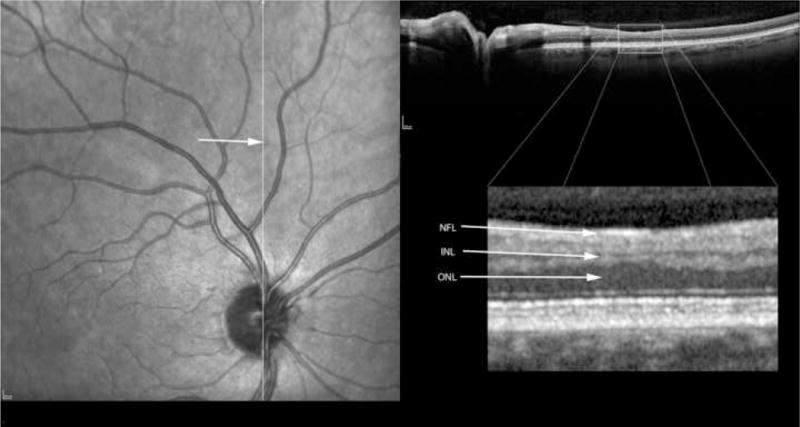
Figure 5.
Acknowledgments
Funding provided by National Eye Institute NIH-NEI grant EY16323 (Bartsch DU), NIH grant #EY07366 (Freeman WR), Research to Prevent Blindness, New York City, NY (Dr. Freeman is the recipient of an RPB Physician Scientist award and an unrestricted grant to UCSD), and unrestricted grants to the UCSD Jacobs Retina Center
Footnotes
Publisher's Disclaimer: This is a PDF file of an unedited manuscript that has been accepted for publication. As a service to our customers we are providing this early version of the manuscript. The manuscript will undergo copyediting, typesetting, and review of the resulting proof before it is published in its final citable form. Please note that during the production process errors may be discovered which could affect the content, and all legal disclaimers that apply to the journal pertain.
No authors have any financial/conflicting interests to disclose
Meeting presentations: none
References
- 1.Brown GC, Brown MM, Hiller T, et al. Cotton-wool spots. Retina. 1985;5:206–14. doi: 10.1097/00006982-198500540-00003. [DOI] [PubMed] [Google Scholar]
- 2.Faber DW, Wiley CA, Lynn GB, et al. Role of HIV and CMV in the pathogenesis of retinitis and retinal vasculopathy in AIDS patients. Invest Ophthalmol Vis Sci. 1992;33:2345–53. [PubMed] [Google Scholar]
- 3.Mansour AM, Jampol LM, Logani S, et al. Cotton-wool spots in acquired immunodeficiency syndrome compared with diabetes mellitus, systemic hypertension, and central retinal vein occlusion. Arch Ophthalmol. 1988;106:1074–7. doi: 10.1001/archopht.1988.01060140230030. [DOI] [PubMed] [Google Scholar]
- 4.Tanenbaum M, Russell S, Richmond P, Gass JD. Calcified cytoid bodies in acquired immunodeficiency syndrome. Retina. 1987;7:84–8. doi: 10.1097/00006982-198700720-00005. [DOI] [PubMed] [Google Scholar]
- 5.McLeod D. Why cotton wool spots should not be regarded as retinal nerve fibre layer infarcts. Br J Ophthalmol. 2005;89:229–37. doi: 10.1136/bjo.2004.058347. [DOI] [PMC free article] [PubMed] [Google Scholar]
- 6.Lopes de Faria JM, Russ H, Costa VP. Retinal nerve fibre layer loss in patients with type 1 diabetes mellitus without retinopathy. Br J Ophthalmol. 2002;86:725–8. doi: 10.1136/bjo.86.7.725. [DOI] [PMC free article] [PubMed] [Google Scholar]
- 7.Ozdek S, Lonneville YH, Onol M, et al. Assessment of nerve fiber layer in diabetic patients with scanning laser polarimetry. Eye. 2002;16:761–5. doi: 10.1038/sj.eye.6700207. [DOI] [PubMed] [Google Scholar]
- 8.Plummer DJ, Bartsch DU, Azen SP, et al. Retinal nerve fiber layer evaluation in human immunodeficiency virus-positive patients. Am J Ophthalmol. 2001;131:216–22. doi: 10.1016/s0002-9394(00)00787-x. [DOI] [PubMed] [Google Scholar]
- 9.Kozak I, Bartsch DU, Cheng L, et al. Objective analysis of retinal damage in HIVpositive patients in the HAART era using OCT. Am J Ophthalmol. 2005;139:295–301. doi: 10.1016/j.ajo.2004.09.039. [DOI] [PMC free article] [PubMed] [Google Scholar]
- 10.Ashton N, Harry J. The pathology of cotton wool spots and cytoid bodies in hypertensive retinopathy and other diseases. Trans Ophthalmol Soc U K. 1963;83:91–114. [PubMed] [Google Scholar]
- 11.Ashton N. Pathological and ultrastructural aspects of the cotton-wool spot. Proc R Soc Med. 1969;62:1271–6. [PMC free article] [PubMed] [Google Scholar]
- 12.Schmidt D. The mystery of cotton-wool spots – a review of recent and historical descriptions. Eur J Med Res. 2008;13:231–66. [PubMed] [Google Scholar]
- 13.Pepose JS, Holland GN, Nestor MS, et al. Acquired immune deficiency syndrome: pathogenic mechanisms of ocular disease. Ophthalmology. 1985;92:472–84. doi: 10.1016/s0161-6420(85)34008-3. [DOI] [PubMed] [Google Scholar]
- 14.Kuppermann BD, Petty JG, Richman DD, et al. Correlation between CD4+ counts and prevalence of cytomegalovirus retinitis and human immunodeficiency virus-related noninfectious retinal vasculopathy in patients with acquired immunodeficiency syndrome. Am J Ophthalmol. 1993;115:575–82. doi: 10.1016/s0002-9394(14)71453-9. [DOI] [PubMed] [Google Scholar]
- 15.Freeman WR, Chen A, Henderly DE, et al. Prevalence and significance of acquired immunodeficiency syndrome-related retinal microvasculopathy. Am J Ophthalmol. 1989;107:229–35. doi: 10.1016/0002-9394(89)90304-8. [DOI] [PubMed] [Google Scholar]
- 16.Wolter JR. Pathology of a cotton-wool spot. Am J Ophthalmol. 1959;48:473–85. doi: 10.1016/0002-9394(59)90883-9. [DOI] [PubMed] [Google Scholar]
- 17.Wolter JR. Axonal enlargements in the nerve-fiber layer of the human retina. Am J Ophthalmol. 1968;65:1–12. doi: 10.1016/0002-9394(68)91020-9. [DOI] [PubMed] [Google Scholar]
- 18.Dollery CT, Henkind P, Paterson JW, et al. I. Ophthalmoscopic and circulatory changes in focal retinal ischaemia. Br J Ophthalmol. 1966;50:285–324. doi: 10.1136/bjo.50.6.285. [DOI] [PMC free article] [PubMed] [Google Scholar]
- 19.Shakib M, Ashton N. II. Ultrastructural changes in focal retinal ischaemia. Br J Ophthalmol. 1966;50:325–84. doi: 10.1136/bjo.50.6.325. [DOI] [PMC free article] [PubMed] [Google Scholar]
- 20.Inomata H, Ikui H, Kimura K. Pathogenesis of cotton-wool spots. 1. Fine structure of cytoid bodies [in Japanese] Nippon Ganka Gakkai Zasshi. 1967;71:1352–64. [PubMed] [Google Scholar]
- 21.Kohner EM, Dollery CT, Bulpitt CJ. Cotton-wool spots in diabetic retinopathy. Diabetes. 1969;18:691–704. doi: 10.2337/diab.18.10.691. [DOI] [PubMed] [Google Scholar]
- 22.Mansour AM, Rodenko G, Dutt R. Half-life of cotton-wool spots in the acquired immunodeficiency syndrome. Int J STD AIDS. 1990;1:132–3. doi: 10.1177/095646249000100213. [DOI] [PubMed] [Google Scholar]
- 23.Green WR. Retina. In: Spencer WH, editor. Ophthalmic Pathology: An Atlas and Textbook. 3. Vol. 2. Philadelphia, PA: WB Saunders; 1996. pp. 655–660. [Google Scholar]
- 24.Kozak I, Bartsch DU, Cheng L, et al. Scanning laser polarimetry demonstration of retinal nerve fiber layer damage in human immunodeficiency virus-positive patients without infectious retinitis. Retina. 2007;27:1267–73. doi: 10.1097/IAE.0b013e31806463fb. [DOI] [PubMed] [Google Scholar]
- 25.Sample PA, Plummer DJ, Mueller AJ, et al. Pattern of early visual field loss in HIVinfected patients. Arch Ophthalmol. 1999;117:755–60. doi: 10.1001/archopht.117.6.755. [DOI] [PubMed] [Google Scholar]
- 26.Shah KH, Holland GN, Yu F, et al. Studies of the Ocular Complications of AIDS (SOCA) Research Group. Contrast sensitivity and color vision in HIVinfected individuals without infectious retinopathy. Am J Ophthalmol. 2006;142:284–92. doi: 10.1016/j.ajo.2006.03.046. [DOI] [PubMed] [Google Scholar]
- 27.Falkenstein IA, Bartsch DU, Azen SP, et al. Multifocal electroretinography in HIVpositive patients without infectious retinitis. Am J Ophthalmol. 2008;146:579–88. doi: 10.1016/j.ajo.2007.12.021. [DOI] [PMC free article] [PubMed] [Google Scholar]
- 28.Kozak I, Sample PA, Hao J, et al. Machine learning classifiers detect subtle field defects in eyes of HIV individuals. Trans Am Ophthalmol Soc. 2007;105:111–8. [PMC free article] [PubMed] [Google Scholar]
- 29.Tufail A, Holland GN, Fisher TC, et al. Increased polymorphonuclear leucocyte rigidity in HIV infected individuals. Br J Ophthalmol. 2000;84:727–31. doi: 10.1136/bjo.84.7.727. [DOI] [PMC free article] [PubMed] [Google Scholar]
- 30.Kim A, Dadgostar H, Holland GN, et al. Hemorheologic abnormalities associated with HIV infection: altered erythrocyte aggregation and deformability. Invest Ophthalmol Vis Sci. 2006;47:3927–32. doi: 10.1167/iovs.06-0137. [DOI] [PubMed] [Google Scholar]
- 31.Yung CW, Harris A, Massicotte S, et al. Retinal blood flow indices in patients infected with human immunodeficiency virus. Br J Ophthalmol. 1996;80:723–7. doi: 10.1136/bjo.80.8.723. [DOI] [PMC free article] [PubMed] [Google Scholar]
- 32.Lim MC, Cumberland WG, Minassian SL, et al. Decreased macular leukocyte velocity in human immunodeficiency virus-infected individuals. Am J Ophthalmol. 2001;132:711–9. doi: 10.1016/s0002-9394(01)01201-6. [DOI] [PubMed] [Google Scholar]
- 33.Dadgostar H, Holland GN, Huang X, et al. Hemorheologic abnormalities associated with HIV infection: in vivo assessment of retinal microvascular blood flow. Invest Ophthalmol Vis Sci. 2006;47:3933–8. doi: 10.1167/iovs.06-0138. [DOI] [PubMed] [Google Scholar]
- 34.Kozak I, Bartsch DU, Cheng L, Freeman WR. In vivo histology of cotton-wool spots using high-resolution optical coherence tomography. Am J Ophthalmol. 2006;141:748–50. doi: 10.1016/j.ajo.2005.10.048. [DOI] [PubMed] [Google Scholar]
- 35.Kozak I, Bartsch DU, Cheng L, Freeman WR. Hyperreflective sign in resolved cotton wool spots using high-resolution optical coherence tomography and optical coherence tomography ophthalmoscopy. Ophthalmology. 2007;114:537–43. doi: 10.1016/j.ophtha.2006.06.054. [DOI] [PubMed] [Google Scholar]
- 36.Goldberg DE, Smithen LM, Angelilli A, Freeman WR. HIV-associated retinopathy in the HAART era. Retina. 2005;25:633–49. doi: 10.1097/00006982-200507000-00015. [DOI] [PubMed] [Google Scholar]
- 37.Behl Y, Krothapalli P, Desta T, et al. Diabetes-enhanced tumor necrosis factor-alpha production promotes apoptosis and the loss of retinal microvascular cells in type 1 and type 2 models of diabetic retinopathy. Am J Pathol. 2008;172:1411–8. doi: 10.2353/ajpath.2008.071070. [DOI] [PMC free article] [PubMed] [Google Scholar]
- 38.Schiffelers RM, Fens MH, van Blijswijk JM, et al. Targeting the retinal microcirculation to treat diabetic sight problems. Expert Opin Ther Targets. 2007;11:1493–502. doi: 10.1517/14728222.11.11.1493. [DOI] [PubMed] [Google Scholar]
- 39.Unoki N, Nishijima K, Sakamoto A, et al. Retinal sensitivity loss and structural disturbance in areas of capillary nonperfusion of eyes with diabetic retinopathy. Am J Ophthalmol. 2007;144:755–60. doi: 10.1016/j.ajo.2007.07.011. [DOI] [PubMed] [Google Scholar]
- 40.Zheng L, Gong B, Hatala DA, Kern TS. Retinal ischemia and reperfusion causes capillary degeneration: similarities to diabetes. Invest Ophthalmol Vis Sci. 2007;48:361–7. doi: 10.1167/iovs.06-0510. [DOI] [PubMed] [Google Scholar]


