

Abstract
Background
The concept of ‘cardiovascular health’ (CVH) was introduced as a global measure of one’s cardiovascular health. Previous studies established the relationship between neighborhood characteristics and individual cardiovascular risk factors. However, the relationship between neighborhood environment and overall CVH remains unknown.
Methods and Results
We analyzed data from the MESA baseline exam (2000–2002). Mean age was 61.6 years and 52% were female. Ideal, intermediate and poor categories of cholesterol, body mass index, diet, physical activity, fasting glucose, blood pressure and smoking were defined according to the AHA 2020 Strategic Goals, assigned an individual score and summed to create an overall score. CVH scores were categorized into ideal (11–14 points), intermediate (9–10) and poor (0–8). Neighborhood exposures included favorable food store and physical activity resources densities (by 1-mile buffer), reported healthy food availability, walking/physical activity environment, safety and social cohesion (by census tract). Multinomial logistic regression was used to determine the association of each characteristic with ideal and intermediate CVH, adjusted for demographics and neighborhood socioeconomic status (SES). Over 20% of MESA participants had an ideal CVH score at baseline. In fully adjusted models, favorable food stores (OR= 1.22, 1.06–1.40), physical activity resources (OR=1.19, 1.08–1.31), walking/physical activity environment (OR=1.20, 1.05–1.37) and neighborhood SES (OR=1.22, 1.11–1.33) were associated with higher odds of having an ideal CVH score.
Conclusions
Neighborhood environment including favorable food stores, physical activity resources, walking/physical activity environment and neighborhood SES are associated with ideal CVH. Further research is needed to investigate the longitudinal associations between neighborhood environment and CVH.
Keywords: risk factors, blood pressure, cholesterol, diet, exercise, prevention
Cardiovascular disease remains the leading cause of death in the United States and was responsible for over 616,000 deaths in 2009.1 The American Heart Association (AHA) 2020 Strategic Impact Goals for 2020 and Beyond introduced the concept of ‘cardiovascular health’ (CVH) to better characterize an individual’s global CVH profile, including both health factors and health behaviors.2 Substantial data now indicates that having ideal levels of all 7 components of CVH is associated with greater longevity, markedly fewer cardiovascular events, lower healthcare costs and higher quality of life.3, 4 However, <5% of Americans have ideal levels of all 7 components of CVH and this prevalence is even lower among minority populations.4–6
Neighborhood environments are associated with coronary heart disease prevalence,7 incidence8, 9 and all-cause mortality.10, 11 In addition to cardiovascular outcomes, neighborhood characteristics, such as availability of healthy food and walkability have been linked to higher intake of fruit and vegetables,12 lower BMI,13 and more physical activity.14, 15 Nevertheless, while the studies above establish the relationship between neighborhoods and individual cardiovascular risk factors, disease development, and outcome measures, it remains unknown whether neighborhood environment is associated with overall CVH, a measure of global CVH. Therefore, the aim of this study was to examine the association between levels of CVH and characteristics of the neighborhood environment including favorable food stores, physical activity resources, healthy food availability, walking/physical activity environment, safety, and social cohesion among participants of the Multi-Ethnic Study of Atherosclerosis (MESA).
Methods
Study Sample
MESA is a multi-center, prospective cohort study of individuals ages 45 to 84 years old and free of clinical cardiovascular disease at baseline designed to examine the prevalence, correlates, and progression of subclinical cardiovascular disease. Further details of the study design have been previously published.16 In brief, 6814 participants were enrolled from July 2000 to September 2002 at 6 field centers (Baltimore; Chicago; Forsyth County, North Carolina; Los Angeles; New York; and St. Paul, Minnesota). In the study, 27.7% of study participants were African American, 11.8% Chinese-American, 22.0% Hispanic and 38.5% white. The study protocol was approved by the institutional review boards of all participating institutions as well as the National Heart, Lung and Blood Institute, and participants gave informed consent. At the baseline examination participants completed questionnaires on demographic and social characteristics, smoking, physical activity, diet and medications. They underwent a physical examination to determine cardiovascular risk including blood pressure, height, and weight in addition to a fasting blood draw for glucose and cholesterol levels.
The present study included 5649 MESA participants. We excluded participants who did not participate in the ancillary MESA Neighborhood Study (N=623), did not have accurate geocoded information available (N=144) or did not have complete baseline data on education, income, marital status or CVH components (BMI, blood pressure, smoking, physical activity, diet, total cholesterol and fasting blood glucose) (N=398).
Assessment of Cardiovascular Health
Cardiovascular health, as defined by the AHA 2020 Strategic Impact Goals for 2020 and Beyond, includes 3 health factors (cholesterol, fasting blood glucose and blood pressure) and four health behaviors (BMI, diet, physical activity and smoking status), each of which was categorized into three categories as per the 2020 Strategic Impact Goals - poor, intermediate and ideal – as defined in Table 12. Physical activity was assessed using the MESA Typical Week Physical Activity Survey, adapted from the Cross-Cultural Activity Participation Study17 to identify time and frequency spent in activities during a typical week in the past month.18 The survey has 28 questions covering household chores, lawn/yard/garden/farm, care of children/adults, transportation, walking (not at work), dancing and sport activities, conditioning activities, leisure activities, occupational and volunteer activities. We included minutes of walking, conditioning and leisure activities as exercise. Minutes of moderate and vigorous exercise were estimated from the questionnaire. Diet was assessed using a 120-item food frequency questionnaire (FFQ), modified from the Insulin Resistance Atherosclerosis study.19 As in prior studies using the FFQ, five components of healthy diet (high intake of fruit and vegetables, fish, whole grains; low intake of sodium and sugar sweetened beverages) were defined according to AHA Strategic Goals.2,5, 20 Blood sugar and cholesterol were measured from a fasting 75 mL blood sample obtained at the clinical examination. Blood pressure was measured after resting for 5 minutes in the seated position; the average of the second and third readings was used. BMI was calculated using measured height and weight at the clinical examination. Smoking history was obtained using a questionnaire developed from NHANES III, the National Health Interview Survey and ARIC. Ideal, intermediate and poor levels of each risk factor and behavior are defined in Table 1 based on the AHA 2020 Strategic Goals, which have previously been published.2, 4, 5, 21
Table 1.
Cardiovascular Health Score Components
| Component | Score | Definition | % of MESA Population (N=5805) |
|---|---|---|---|
| Physical Activitya | |||
| 0 | No exercise | 22.1 | |
| 1 | 1–149 minutes of moderate exercise or 1–74 minutes of vigorous exercise/week | 17.4 | |
| 2 | 150+ minutes of moderate exercise or 75+ minutes of vigorous exercise/week | 60.5 | |
| Diet | |||
| 0 | 0–1 components of healthy diet | 42.8 | |
| 1 | 2–3 components of healthy diet | 55.7 | |
| 2 | 4–5 components of healthy diet | 1.5 | |
| Blood Sugar | |||
| 0 | ≥126 mg/dL fasting | 10.3 | |
| 1 | 100–125 mg/dL fasting or treated to <100 mg/dL | 14.7 | |
| 2 | <100 mg/dL fasting, unmedicated | 75.0 | |
| Blood Pressure | |||
| 0 | SBP ≥140 mmHg or DBP ≥90 mmHg | 36.5 | |
| 1 | SBP 120–139 mmHg or DBP 80–89 mmHg or treated to <120/80 mmHg | 28.2 | |
| 2 | <120/80 mmHg, unmedicated | 35.3 | |
| BMI | |||
| 0 | ≥30 kg/m2 | 31.7 | |
| 1 | 25.0–29.99 kg/m2 | 39.5 | |
| 2 | <25.0 kg/m2 | 28.9 | |
| Cholesterol | |||
| 0 | ≥240 mg/dL | 13.3 | |
| 1 | 200–239 mg/dL or treated to <200 mg/dL | 39.5 | |
| 2 | <200 mg/dL, unmedicated | 47.3 | |
| Smoking | |||
| 0 | Current smoker | 12.5 | |
| 1 | Former smoker, quit ≤12 months ago | 1.2 | |
| 2 | Never smoker or quit >12 months ago | 86.3 | |
Abbreviations: MESA, Multi-Ethnic Study of Atherosclerosis; SBP, systolic blood pressure; DBP, diastolic blood pressure
When combining vigorous and moderate exercise, vigorous exercise was weighted double.
For each individual risk factor, poor, intermediate, and ideal risk factor categories were assigned a score of 0, 1 and 2, respectively. As previously described,22 an overall cardiovascular health score (range 0–14) was established as the sum of each individual component score, with 14 corresponding to the lowest burden of cardiovascular risk. Participants were divided into three groups based on overall CVH score: ideal (11–14), intermediate (9–10) and poor (0–8) along natural breaks in the data.
Neighborhood Characteristics
The primary exposures in this study included six neighborhood characteristics: (1) densities of favorable food stores, (2) resident-reported healthy food availability, (3) density of physical activity resources, and (4) resident-reported walking/physical activity environment (5) safety and (6) social cohesion. The densities of favorable food stores (i.e. food stores likely to provide fresh fruits and vegetables) and physical activity resources were created from Kernel density estimates generated using Euclidean distances. Kernels using 1-mile and 1/5 mile radius around participants’ home addresses were examined; because prior studies have used 1-mile radius and. results were similar using ½ mile radius, the results below use the 1-mile density values. Healthy food availability, walking/physical activity environment, social cohesion, and safety were evaluated as part of the MESA Neighborhood Ancillary study via a questionnaire administered to MESA participants as well as to other neighborhood residents sampled from MESA neighborhoods to serve as ‘informants’ on their neighborhoods. Specific questions for the survey and further details have previously been reported.23 Questionnaire responses for all residents of a given tract were aggregated to the census tract level using conditional empirical Bayes estimation using a three level hierarchical linear model adjusted for respondent age, sex, source, and site. The models incorporated weights which were proportional to the reliability; thus census tracts with smaller samples and poorer reliability would have greater shrinkage towards the mean as compared to larger census tract with greater reliability. For all neighborhood measures a higher score represents a healthier/better environment.
Based on prior work,24 favorable food stores included chain and non-chain supermarkets and fruit and vegetable markets identified using National Establishment Time Series (NETS) data from Walls and Associates. A total of 15 Standardized Industrial Codes (SIC) were used to identify supermarkets and fruit and vegetable markets. These data were enhanced by adding supermarket data from the Nielsen TDLinx Service Supermarket Retail Category Database. Data corresponding to the year that the individual MESA participant was enrolled were used. For each MESA participant, the density of favorable food stores was defined as the number of food stores within a 1-mile radius around their primary residential address. Data are presented as businesses per square mile. Survey measures to assess healthy food availability were based on two questionnaire items. Respondents were asked how much they agree with the following statements using a 5-point Likert scale: 1) ‘A large selection of fresh fruits and vegetables is available in my neighborhood’; 2) ‘A large selection of low-fat products is available in my neighborhood’.
Physical activity resources included the number of total physical activity facilities within a 1-mile radius around each MESA participant’s home address. Physical activity resources were identified using NETS data corresponding to the year the MESA participant was enrolled in the study and facilities per square mile were calculated. Recreational resources were identified from 114 SICs and included indoor conditioning (health clubs/gyms, yoga, karate, etc), dance, bowling, golf, team and racquet sports, and water activities. Survey reported neighborhood walking/physical activity environment was assessed using several survey items. Respondents were asked their agreement with the following questions based on a 5-point Likert scale: 1) ‘My neighborhood offers many opportunities to be physically active’; 2) ‘Local sports clubs and other facilities in my neighborhood offer many opportunities to get exercise’; 3) ‘It is pleasant to walk in my neighborhood’; 4) ‘The trees in my neighborhood provide enough space’; 5) ‘In my neighborhood, it is easy to walk places’; 6) ‘I often see other people walking in my neighborhood’; 7) ‘I often see people exercising in my neighborhood’. Participants’ agreement with each of the statements was combined into an aggregate score for neighborhood walking/physical activity environment.23
Safety and social cohesion were also assessed via questionnaires. Safety was assessed using the following items: 1) ‘I feel safe walking in my neighborhood, day or night’; 2) ‘Violence is not a problem in my neighborhood’; 3) ‘My neighborhood is safe from crime’. Responses were combined to create a score for neighborhood safety. Social cohesion was assessed based on the following items: 1) ‘People around here are willing to help their neighbors’; 2) ‘People in my neighborhood generally get along with each other’; 3) ‘People in my neighborhood can be trusted’; 4) ‘People in my neighborhood share the same values’ and their responses were combined to create a total score for neighborhood social cohesion.
Neighborhood SES based on census tract was represented by a single, summary score adapted from previous work.9 The score combines six variables representing wealth and income (log of the median household income; log of median value of housing units; the percentage of households receiving interest, dividend or net rental income), education (the percentage of adults 25 years and older who had completed high school and the percentage of adults 25 years and older who had completed college), and occupation (the percentage of employed persons 16 years and older in executive, managerial, or professional specialty occupations). A higher score indicates greater neighborhood socioeconomic advantage.
Individual-Level Covariates
Additional participant covariates included patient demographics such as age, sex, race/ethnicity, education (less than high school, high school graduate, some college, college graduate or more than college graduate), marital status (married, not married), income (<$40,000 and ≥$40,000 per year), census tract, and study site as assessed by study questionnaire.
Statistical analyses
In descriptive analyses, distributions of each component of the CVH score were summarized. Distributions of participant characteristics including age, sex, race/ethnicity, highest level of education completed, income and marital status were examined overall and stratified by CVH score group. We calculated mean and standard deviation for continuous variables, and percentage for categorical variables. Components of the CVH score and participant characteristics were compared across CVH score groups using ANOVA for continuous variables and chi-squared tests for categorical variables.
We examined the association of each neighborhood characteristic with poor, intermediate, and ideal CVH groups using multinomial logistic regression models. Models were sequentially adjusted for demographics (age, sex, study site, census tract, race/ethnicity and marital status), individual SES (income, education) and neighborhood SES. Neighborhood characteristics were each examined separately. Model 1 is unadjusted. Model 2 adjusts for sex, age, census tract and study site. Model 3 adjusts for all variables in Model 2 and race and marital status. Model 4 adjusts for all variables in Model 3 and education and income. Model 5 adjusts for all variables in Model 4 and neighborhood SES.
For the purposes of this study, all neighborhood characteristics were standardized such that the odds ratio represents the odds per each +1 standard deviation difference (higher). Interaction terms were analyzed in order to assess whether sex, race/ethnicity or neighborhood SES modified the associations of interest. All analyses were conducted in SAS 9.3 (SAS Institute, Cary NC).
Results
Of the 5,805 MESA participants included in this study, 21.1% were in ideal CVH (scores of 11–14) as we defined it, 33.2% were in the intermediate group (scores of 9–10), and 45.8% were in poor CVH (scores of 0–8). Only 0.14% (n=8) of participants had ideal levels of all 7 components. Table 1 shows the 7 components of CVH, the definitions for all 3 groups within each component and the percentage of individuals that obtained ideal, intermediate and poor levels for each of the individual components. For CVH behaviors and factors, ideal smoking status (i.e. never smoker or quit >1 yr ago) was the most prevalent - 86.3% of participants. MESA participants were least likely to meet the definition of ideal dietary health. Only 1.5% of participants had ideal dietary health, with the largest proportion of individuals (55.7%) in intermediate dietary health (meeting 2–3 components of the healthy diet construct).
Sociodemographic characteristics of participants, both overall and by CVH group, are displayed in Table 2. Fifty-two percent of the study sample was female and the mean age was 61.7 years. Individuals having ideal CVH were younger, more frequently Caucasian, more educated, and wealthier compared to participants in the poor CVH group. All sociodemographic factors included in Table 2, except for sex, were significantly associated with CVH group (p<0.001).
Table 2.
Characteristics of Participants by Cardiovascular Health Score Group
| Characteristic | Overall N=5805 | Poor (Score 0–8) N=2657 | Intermediate (Score 9–10) N=1925 | Ideal (Score 11–14) N=1223 | p-value* |
|---|---|---|---|---|---|
| Age in years, mean (SD) | 61.7 (10.11) | 62.4 (9.65) | 61.7 (10.42) | 60.2 (10.42) | <0.001 |
| Female, % | 52.4 | 51.6 | 52.6 | 53.5 | 0.47 |
| Race/Ethnicity, % | <0.001 | ||||
| Caucasian | 40.0 | 32.1 | 44.0 | 50.8 | |
| Chinese | 12.1 | 6.9 | 14.6 | 19.9 | |
| African American | 25.8 | 33.7 | 21.9 | 14.9 | |
| Hispanic | 22.0 | 27.3 | 19.5 | 14.5 | |
| Education, % | <0.001 | ||||
| < High school education | 16.4 | 21.0 | 14.7 | 8.9 | |
| High school education | 18.0 | 21.5 | 17.0 | 11.9 | |
| Some college education | 28.7 | 31.2 | 28.0 | 24.5 | |
| College education | 18.2 | 14.0 | 19.9 | 24.8 | |
| > College education | 18.7 | 12.3 | 20.4 | 29.9 | |
| Married, % | 62.0 | 58.8 | 63.3 | 67.1 | <0.001 |
| Income <$40,000/year, % | 49.0 | 56.9 | 46.4 | 36.0 | <0.001 |
For comparison across three cardiovascular health score groups
In unadjusted analyses, all neighborhood characteristics, except social cohesion, were associated with the prevalence of an ideal CVH score (Figure 1; Table 3). After sequential adjustment for individual demographics characteristics in models 2, 3 and 4, all neighborhood characteristics except social cohesion remained associated with having ideal CVH (Table 3). Neighborhood SES was associated with 8% and 22% greater odds of having intermediate and ideal CVH, respectively. Favorable food stores, physical activity resources, and walking/physical activity environment remained significantly associated with having ideal CVH after additional adjustment for neighborhood SES. In the fully adjusted model, for every 1 SD increase in favorable food stores, participants had a 22% greater odds of having ideal CVH as compared to poor CVH (OR: 1.22, 95% CI: 1.06, 1.40). Similar findings were seen for the association between physical activity resources and ideal CVH (OR: 1.19, 95% CI: 1.06, 1.31) and between walking/physical activity environment and ideal CVH (OR: 1.20, 95% CI: 1.05, 1.37).
Fig 1.
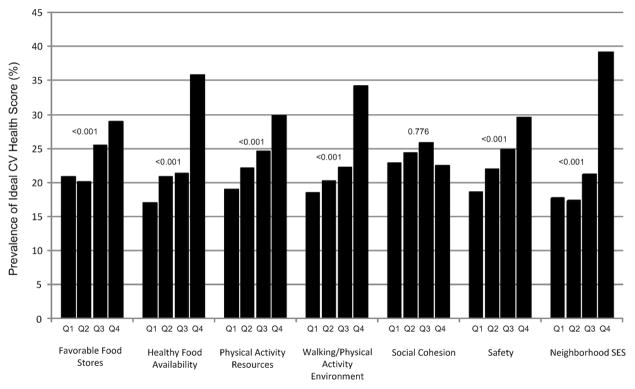
Prevalence of Ideal CV Health Score per Quartile of Neighborhood Characteristic with P-values for Trend
Table 3.
Odds ratios of having ideal or intermediate (compared to poor) cardiovascular health associated with a 1 SD difference in neighborhood characteristics
| Characteristic | Model 1 | Model 2 | Model 3 | Model 4 | Model 5 | |||||
|---|---|---|---|---|---|---|---|---|---|---|
| OR | 95% CI | OR | 95% CI | OR | 95% CI | OR | 95% CI | OR | 95% CI | |
| Favorable Food Stores | ||||||||||
| Intermediate | 1.01 | 0.95, 1.07 | 1.14 | 1.02, 1.29 | 1.13 | 0.99, 1.28 | 1.13 | 0.99, 1.29 | 1.12 | 0.99, 1.27 |
| Ideal | 1.13 | 1.06, 1.21 | 1.35 | 1.19, 1.54 | 1.27 | 1.11, 1.45 | 1.26 | 1.10, 1.44 | 1.22 | 1.06, 1.40 |
| Healthy Food Availability | ||||||||||
| Intermediate | 1.16 | 1.09, 1.23 | 1.15 | 1.04, 1.26 | 1.05 | 0.94, 1.16 | 1.01 | 0.92, 1.12 | 0.98 | 0.88, 1.09 |
| Ideal | 1.58 | 1.47, 1.69 | 1.54 | 1.37, 1.72 | 1.28 | 1.13, 1.45 | 1.19 | 1.05, 1.35 | 1.10 | 0.97, 1.26 |
| Physical Activity Resources | ||||||||||
| Intermediate | 1.16 | 1.09, 1.25 | 1.19 | 1.10, 1.29 | 1.12 | 1.03, 1.22 | 1.08 | 0.99, 1.18 | 1.05 | 0.96, 1.16 |
| Ideal | 1.44 | 1.35, 1.55 | 1.46 | 1.35, 1.58 | 1.32 | 1.21, 1.44 | 1.25 | 1.14, 1.36 | 1.19 | 1.08, 1.31 |
| Walking/Physical Activity Environment | ||||||||||
| Intermediate | 1.24 | 1.17, 1.32 | 1.24 | 1.14, 1.35 | 1.17 | 1.07, 1.28 | 1.09 | 0.99, 1.19 | 1.06 | 0.94, 1.18 |
| Ideal | 1.6 | 1.49, 1.71 | 1.66 | 1.51, 1.83 | 1.48 | 1.34, 1.65 | 1.29 | 1.16, 1.44 | 1.20 | 1.05, 1.37 |
| Safety | ||||||||||
| Intermediate | 1.19 | 1.12, 1.26 | 1.25 | 1.17, 1.34 | 1.11 | 1.03, 1.19 | 1.06 | 0.98, 1.14 | 1.02 | 0.93, 1.12 |
| Ideal | 1.35 | 1.26, 1.45 | 1.56 | 1.44, 1.70 | 1.27 | 1.16, 1.38 | 1.16 | 1.06, 1.27 | 1.05 | 0.94, 1.17 |
| Social Cohesion | ||||||||||
| Intermediate | 1.09 | 1.03, 1.16 | 1.20 | 1.10, 1.30 | 1.12 | 1.03, 1.22 | 1.05 | 0.96, 1.15 | 1.01 | 0.91, 1.12 |
| Ideal | 1.09 | 1.02, 1.17 | 1.46 | 1.32, 1.62 | 1.27 | 1.14, 1.41 | 1.11 | 0.99, 1.24 | 0.99 | 0.87, 1.12 |
| Neighborhood SES | ||||||||||
| Intermediate | 1.34 | 1.26, 1.43 | 1.34 | 1.25, 1.43 | 1.18 | 1.10, 1.27 | 1.08 | 0.99, 1.17 | - | - |
| Ideal | 1.79 | 1.67, 1.92 | 1.78 | 1.64, 1.92 | 1.44 | 1.33, 1.57 | 1.22 | 1.11, 1.33 | - | - |
Odds ratios represent ideal or intermediate cardiovascular health group (reference is poor cardiovascular health group) per 1 SD increase in neighborhood characteristic
Model 1 is unadjusted
Model 2 is adjusted for sex, age, study site, and census tract
Model 3 is adjusted for all variables in Model 2 and race and marital status
Model 4 is adjusted for all variables in Model 3 and education and income
Model 5 is adjusted for all variable in Model 4 and neighborhood SES
The associations of favorable food stores, healthy food availability, walking/physical activity environment, safety, and neighborhood SES with CVH scores were significantly different for men and women (Table 4). Among men, the odds of having an intermediate or ideal CVH as compared to poor CVH were 23% and 36% greater, respectively, for every 1 SD increase in favorable food stores. Among women, favorable food stores were not associated with intermediate or ideal CVH score. In contrast, healthy food availability, walking/physical activity environment, and safety were significantly associated with greater odds of having ideal CVH among women but not in men. Similarly, neighborhood SES was significantly associated with greater odds of having intermediate or ideal CVH among women of 19% and 41% respectively, but there was no association among men. Physical activity resources was significantly associated with greater odds of ideal CVH in both men (16%) and women (22%) as compared to poor CVH. Sex did not appear to modify the association between social cohesion and CVH scores. There was no evidence that race/ethnicity or neighborhood SES modified the association between any neighborhood characteristics in this study and CVH scores. Correlation between neighborhood characteristics ranged from 0.01 to 0.67.
Table 4.
Odds ratios by gender of having ideal or intermediate (compared to poor) cardiovascular health associated with a 1 SD difference in neighborhood characteristics
| Characteristic | OR (95% CI)* | p-value for interaction by gender | |
|---|---|---|---|
| Females | Males | ||
| Favorable food stores | 0.02 | ||
| Intermediate | 1.06 (0.93, 1.22) | 1.23 (1.06, 1.43) | |
| Ideal | 1.13 (0.97, 1.31) | 1.36 (1.16, 1.61) | |
| Healthy Food Availability | 0.04 | ||
| Intermediate | 1.05 (0.93, 1.19) | 0.91 (0.81, 1.04) | |
| Ideal | 1.18 (1.02, 1.38) | 1.02 (0.88, 1.19) | |
| Physical Activity Resources | 0.61 | ||
| Intermediate | 1.05 (0.93, 1.17) | 1.06 (0.95, 1.19) | |
| Ideal | 1.22 (1.08, 1.36) | 1.16 (1.03, 1.31) | |
| Walking/Physical Activity Environment | 0.03 | ||
| Intermediate | 1.10 (0.97, 1.26) | 1.00 (0.88, 1.14) | |
| Ideal | 1.31 (1.13, 1.52) | 1.08 (0.93, 1.26) | |
| Safety | 0.008 | ||
| Intermediate | 1.09 (0.98, 1.22) | 0.96 (0.86, 1.08) | |
| Ideal | 1.17 (1.02, 1.33) | 0.93 (0.82, 1.07) | |
| Social Cohesion | 0.10 | ||
| Intermediate | 1.04 (0.92, 1.17) | 0.90 (0.78, 1.05) | |
| Ideal | 1.06 (0.92, 1.23) | 0.98 (0.87, 1.11) | |
| Neighborhood SES | <0.001 | ||
| Intermediate | 1.19 (1.07, 1.31) | 0.98 (0.89, 1.09) | |
| Ideal | 1.41 (1.26, 1.59) | 1.04 (0.92, 1.17) | |
Model adjusted for age, education, race/ethnicity, income, study site, marital status, census tract, neighborhood SES (Model 5)
In sensitivity analyses, the fully adjusted findings were consistent, although slightly attenuated, when we examined the number of favorable food stores and physical activity resources within a smaller (½ mile as opposed the 1 mile) radius, odds ratios for having an ideal CVH score as compared to a poor CVH score were 1.10 (0.92–1.23) and 1.16 (1.06–1.27) for 1 SD increase in favorable food stores and physical activity resources, respectively. Intra-neighborhood correlation was low (the median number of individuals per census tract was 2); thus when we used a multilevel GEE model to account for the clustering findings were not changed substantially although the standard errors were increased, therefore as in previous studies of MESA Neighborhood data25,26 we present the simpler model. In the GEE models, favorable food stores, walking/physical activity environment and neighborhood SES were all positively related to having an ideal CV health score although they were no longer significant. The association of physical activity resources with ideal CVH as compared to poor CVH remained significant with an adjusted OR of 1.12 (95% CI 1.00–1.26).
Discussion
In this cross-sectional analysis of an ethnically diverse, population-based cohort of US adults, we found that neighborhood characteristics, including the density of favorable food stores, physical activity facilities, resident-reported walking/physical activity environment, and neighborhood SES were positively associated with having ideal CVH, even after adjusting for individual sociodemographic factors. The density of favorable food stores appeared to have a greater impact on CVH among men, while neighborhood SES was more strongly associated with having ideal CVH among women.
The present study is the first to report the relationship between neighborhood characteristics and overall ‘cardiovascular health’, as introduced in the 2020 AHA Strategic Goals.26 These findings are consistent with prior studies that have examined the relationship between neighborhood characteristics and the individual cardiovascular disease (CVD) risk factors that are components of the CVH score. However, an examination of overall CVH, as opposed to individual components, provides a more holistic representation of overall health and may suggest that neighborhood interventions could affect CVH and CVD outcomes more meaningfully and efficiently than approaches targeting single risk factors.
Although findings have not always been consistent, and casual inferences are limited by cross-sectional designs, a number of studies have reported associations between local neighborhood resources, cardiovascular outcomes and health behaviors. For example, healthy food availability has been found to be associated with a significantly lower BMI, including a 12% lower obesity incidence in one study,27 and with healthier diet in another study.25 Rundle et al. found that BMI was 0.80 units lower in the highest healthy food density quintile compared to the lowest density group.28 Similarly, Morland et al. examined the associations of proximity to supermarkets with selected CVD risk factors in the Atherosclerosis Risk in Communities study using food stores.29 The study found that there was a 9% lower prevalence of overweight and 12% lower prevalence of hypertension in areas with at least one supermarket compared to areas without any supermarkets. Previous studies have also shown a positive association between physical activity resources and increased physical activity15, 30 potentially resulting in lower BMI and blood pressure. Individuals with 4–6 recreational facilities within a 5-minute walk from their home were 1.3 times more likely to meet physical activity recommendations than those without recreation facilities.14 In this study we found a positive association between the density of favorable food stores and physical activity resources, and availability of healthy foods with CVH. The present study expands on this prior work by showing how neighborhood resources are related to a global measure of cardiovascular health, including the biomedical risk factors influenced by behaviors.
There is little research investigating the importance of social cohesion in a neighborhood context for cardiovascular risk factors. Yet, there is evidence to suggest that social support at the individual level may impact physical activity and smoking cessation. Trieber et al. examined 3 prior studies assessing the relationship between social support and physical activity and found that social support for exercise positively correlated with physical activity, but this varied significantly based on sociodemographic characteristics.31 Further, previous studies have demonstrated that low social support may be an independent cardiovascular disease risk factor. Orth-Gomer et al. examined both social attachment (to close individuals) and social integration (to larger society) in relationship to coronary heart disease (CHD) over 6 years in 700+ Swedish men.32 In their study, they found that men with CHD were twice as likely to lack social integration than those without CHD. We did not find a relationship between neighborhood social cohesion and ideal CVH. It is possible that the processes linking social support and CVD risks operate more at the level of individuals rather than at the level of neighborhoods. Consistent with previous studies, we found that neighborhood socioeconomic status was significantly associated with CVD risk.9–11, 33–35 In this study we found that the impact of neighborhood SES was stronger for women as compared to men. Sex differences in the effects of neighborhood environment have been previously identified.36, 37 However, the reasons for these differences remain unclear.
The MESA study is a population-based study composed of an ethnically diverse group of individuals. Additionally, the study includes detailed and validated information about participants’ health status and risk factors. Further, the study utilizes detailed assessments of neighborhood environments for analysis. There are some limitations, which must be considered. As described above, multiple variables including both demographic characteristics as well as neighborhood characteristics are self-reported and thus subject to misclassification. While MESA is a large population-based cohort comprised of individuals from 6 different national sites, it was not designed to be nationally representative. Further, individuals were not sampled by neighborhood, which may limit geographic representation from sites. Because this is a cross-sectional study, we cannot address causality. Prior literature suggests that people self-select into neighborhoods which complicates the relationship between neighborhood environment and CVH. In addition, our analyses did not examine the extent to which the various neighborhood resources act synergistically to promote CVH.
This study shows that the prevalence of ideal CVH is associated with multiple different neighborhood characteristics suggesting the importance of local environment. Neighborhood characteristics including favorable food stores, physical activity resources, walking/physical activity environment, and neighborhood SES were significantly associated with having ideal CVH. Longitudinal studies examining neighborhood characteristics and cardiovascular health are needed to better understand whether the associations we describe are causal. However, the patterns observed suggest that future efforts to improve cardiovascular health should include a consideration of neighborhood factors. Both structural changes to the built environment as well as healthy policies could potentially impact the cardiovascular health of residents. Further understanding of how neighborhood interventions can increase the prevalence of ideal cardiovascular health is clearly needed.
Acknowledgments
The authors thank the other investigators, the staff, and the participants of the MESA study for their valuable contributions. A full list of participating MESA investigators and institutions can be found at http://www.mesa-nhlbi.org.
FUNDING SOURCES
This research was supported by contracts N01-HC-95159 through N01-HC-95169 from the National Heart, Lung, and Blood Institute and by grants UL1-RR-024156 and UL1-RR-025005 from National Center for Research Resources.
Footnotes
CONFLICT OF INTEREST DISCLOSURES
None.
References
- 1.Kochanek KD, Xu J, Murphy SL, Miniño AM, Kung H-C. Deaths: Preliminary data for 2009. National Vital Statistics Reports. 2011;59 [PubMed] [Google Scholar]
- 2.Lloyd-Jones DM, Hong Y, Labarthe D, Mozaffarian D, Appel LJ, Van Horn L, Greenlund K, Daniels S, Nichol G, Tomaselli GF, Arnett DK, Fonarow GC, Ho PM, Lauer MS, Masoudi FA, Robertson RM, Roger V, Schwamm LH, Sorlie P, Yancy CW, Rosamond WD. Defining and setting national goals for cardiovascular health promotion and disease reduction: The American Heart Association’s strategic impact goal through 2020 and beyond. Circulation. 2010;121:586–613. doi: 10.1161/CIRCULATIONAHA.109.192703. [DOI] [PubMed] [Google Scholar]
- 3.Conroy RM, Pyorala K, Fitzgerald AP, Sans S, Menotti A, De Backer G, De Bacquer D, Ducimetiere P, Jousilahti P, Keil U, Njolstad I, Oganov RG, Thomsen T, Tunstall-Pedoe H, Tverdal A, Wedel H, Whincup P, Wilhelmsen L, Graham IM. Estimation of ten-year risk of fatal cardiovascular disease in europe: The score project. European heart journal. 2003;24:987–1003. doi: 10.1016/s0195-668x(03)00114-3. [DOI] [PubMed] [Google Scholar]
- 4.Bambs C, Kip KE, Dinga A, Mulukutla SR, Aiyer AN, Reis SE. Low prevalence of “ideal cardiovascular health” in a community-based population: The heart strategies concentrating on risk evaluation (heart score) study. Circulation. 2011;123:850–857. doi: 10.1161/CIRCULATIONAHA.110.980151. [DOI] [PMC free article] [PubMed] [Google Scholar]
- 5.Folsom AR, Yatsuya H, Nettleton JA, Lutsey PL, Cushman M, Rosamond WD. Community prevalence of ideal cardiovascular health, by the american heart association definition, and relationship with cardiovascular disease incidence. Journal of the American College of Cardiology. 2011;57:1690–1696. doi: 10.1016/j.jacc.2010.11.041. [DOI] [PMC free article] [PubMed] [Google Scholar]
- 6.Shay CM, Ning H, Allen NB, Carnethon MR, Chiuve SE, Greenlund KJ, Daviglus ML, Lloyd-Jones DM. Status of cardiovascular health in us adults: Prevalence estimates from the national health and nutrition examination surveys (nhanes) 2003–2008. Circulation. 2012;125:45–56. doi: 10.1161/CIRCULATIONAHA.111.035733. [DOI] [PMC free article] [PubMed] [Google Scholar]
- 7.Diez-Roux AV, Nieto FJ, Muntaner C, Tyroler HA, Comstock GW, Shahar E, Cooper LS, Watson RL, Szklo M. Neighborhood environments and coronary heart disease: A multilevel analysis. American journal of epidemiology. 1997;146:48–63. doi: 10.1093/oxfordjournals.aje.a009191. [DOI] [PubMed] [Google Scholar]
- 8.Sundquist K, Winkleby M, Ahlen H, Johansson SE. Neighborhood socioeconomic environment and incidence of coronary heart disease: A follow-up study of 25,319 women and men in sweden. American journal of epidemiology. 2004;159:655–662. doi: 10.1093/aje/kwh096. [DOI] [PubMed] [Google Scholar]
- 9.Diez Roux AV, Merkin SS, Arnett D, Chambless L, Massing M, Nieto FJ, Sorlie P, Szklo M, Tyroler HA, Watson RL. Neighborhood of residence and incidence of coronary heart disease. The New England journal of medicine. 2001;345:99–106. doi: 10.1056/NEJM200107123450205. [DOI] [PubMed] [Google Scholar]
- 10.Pickett KE, Pearl M. Multilevel analyses of neighbourhood socioeconomic context and health outcomes: A critical review. Journal of epidemiology and community health. 2001;55:111–122. doi: 10.1136/jech.55.2.111. [DOI] [PMC free article] [PubMed] [Google Scholar]
- 11.Smith GD, Hart C, Watt G, Hole D, Hawthorne V. Individual social class, area-based deprivation, cardiovascular disease risk factors, and mortality: The renfrew and paisley study. Journal of epidemiology and community health. 1998;52:399–405. doi: 10.1136/jech.52.6.399. [DOI] [PMC free article] [PubMed] [Google Scholar]
- 12.Morland K, Wing S, Diez Roux A. The contextual effect of the local food environment on residents' diets: The atherosclerosis risk in communities study. American journal of public health. 2002;92:1761–1767. doi: 10.2105/ajph.92.11.1761. [DOI] [PMC free article] [PubMed] [Google Scholar]
- 13.Hoehner CM, Handy SL, Yan Y, Blair SN, Berrigan D. Association between neighborhood walkability, cardiorespiratory fitness and body-mass index. Social science & medicine. 2011;73:1707–1716. doi: 10.1016/j.socscimed.2011.09.032. [DOI] [PMC free article] [PubMed] [Google Scholar]
- 14.Hoehner CM, Brennan Ramirez LK, Elliott MB, Handy SL, Brownson RC. Perceived and objective environmental measures and physical activity among urban adults. American journal of preventive medicine. 2005;28:105–116. doi: 10.1016/j.amepre.2004.10.023. [DOI] [PubMed] [Google Scholar]
- 15.Ding D, Sallis JF, Kerr J, Lee S, Rosenberg DE. Neighborhood environment and physical activity among youth a review. American journal of preventive medicine. 2011;41:442–455. doi: 10.1016/j.amepre.2011.06.036. [DOI] [PubMed] [Google Scholar]
- 16.Bild DE, Bluemke DA, Burke GL, Detrano R, Diez Roux AV, Folsom AR, Greenland P, Jacob DR, Jr, Kronmal R, Liu K, Nelson JC, O'Leary D, Saad MF, Shea S, Szklo M, Tracy RP. Multi-ethnic study of atherosclerosis: Objectives and design. American journal of epidemiology. 2002;156:871–881. doi: 10.1093/aje/kwf113. [DOI] [PubMed] [Google Scholar]
- 17.Ainsworth BE, Irwin ML, Addy CL, Whitt MC, Stolarczyk LM. Moderate physical activity patterns of minority women: The cross-cultural activity participation study. Journal of women's health & gender-based medicine. 1999;8:805–813. doi: 10.1089/152460999319129. [DOI] [PubMed] [Google Scholar]
- 18.Bertoni AG, Whitt-Glover MC, Chung H, Le KY, Barr RG, Mahesh M, Jenny NS, Burke GL, Jacobs DR. The association between physical activity and subclinical atherosclerosis: The multi-ethnic study of atherosclerosis. American journal of epidemiology. 2009;169:444–454. doi: 10.1093/aje/kwn350. [DOI] [PMC free article] [PubMed] [Google Scholar]
- 19.Block G, Woods M, Potosky A, Clifford C. Validation of a self-administered diet history questionnaire using multiple diet records. Journal of clinical epidemiology. 1990;43:1327–1335. doi: 10.1016/0895-4356(90)90099-b. [DOI] [PubMed] [Google Scholar]
- 20.Rasmussen-Torvik LJ, Shay CM, Abramson JG, Friedrich CA, Nettleton JA, Prizment AE, Folsom AR. Ideal cardiovascular health is inversely associated with incident cancer: The atherosclerosis risk in communities study. Circulation. 2013;127:1270–1275. doi: 10.1161/CIRCULATIONAHA.112.001183. [DOI] [PMC free article] [PubMed] [Google Scholar]
- 21.Pearson TA, Bazzarre TL, Daniels SR, Fair JM, Fortmann SP, Franklin BA, Goldstein LB, Hong Y, Mensah GA, Sallis JF, Jr, Smith S, Jr, Stone NJ, Taubert KA. American heart association guide for improving cardiovascular health at the community level: A statement for public health practitioners, healthcare providers, and health policy makers from the american heart association expert panel on population and prevention science. Circulation. 2003;107:645–651. doi: 10.1161/01.cir.0000054482.38437.13. [DOI] [PubMed] [Google Scholar]
- 22.Lloyd-Jones DM. Improving the cardiovascular health of the us population. JAMA : the journal of the American Medical Association. 2012;307:1314–1316. doi: 10.1001/jama.2012.361. [DOI] [PubMed] [Google Scholar]
- 23.Mujahid MS, Diez Roux AV, Morenoff JD, Raghunathan T. Assessing the measurement properties of neighborhood scales: From psychometrics to ecometrics. American journal of epidemiology. 2007;165:858–867. doi: 10.1093/aje/kwm040. [DOI] [PubMed] [Google Scholar]
- 24.Auchincloss AH, Moore KA, Moore LV, Diez Roux AV. Improving retrospective characterization of the food environment for a large region in the united states during a historic time period. Health & place. 2012;18:1341–1347. doi: 10.1016/j.healthplace.2012.06.016. [DOI] [PMC free article] [PubMed] [Google Scholar]
- 25.Franco M, Diez-Roux AV, Nettleton JA, Lazo M, Brancati F, Caballero B, Glass T, Moore LV. Availability of healthy foods and dietary patterns: the Multi-Ethnic Study of Atherosclerosis. The American journal of clinical nutrition. 2009 Mar;89:897–904. doi: 10.3945/ajcn.2008.26434. [DOI] [PMC free article] [PubMed] [Google Scholar]
- 26.Mujahid MS, Diez Roux AV, Cooper RC, Shea S, Williams DR. Neighborhood stressors and race/ethnic differences in hypertension prevalence (the Multi-Ethnic Study of Atherosclerosis) American journal of hypertension. 2011 Feb;24:187–193. doi: 10.1038/ajh.2010.200. [DOI] [PMC free article] [PubMed] [Google Scholar]
- 27.Auchincloss AH, Mujahid MS, Shen M, Michos ED, Whitt-Glover MC, Diez Roux AV. Neighborhood health-promoting resources and obesity risk (the multi-ethnic study of atherosclerosis) Obesity (Silver Spring) 2013;21:621–628. doi: 10.1038/oby.2012.91. [DOI] [PMC free article] [PubMed] [Google Scholar]
- 28.Rundle A, Neckerman KM, Freeman L, Lovasi GS, Purciel M, Quinn J, Richards C, Sircar N, Weiss C. Neighborhood food environment and walkability predict obesity in new york city. Environmental health perspectives. 2009;117:442–447. doi: 10.1289/ehp.11590. [DOI] [PMC free article] [PubMed] [Google Scholar]
- 29.Morland K, Diez Roux AV, Wing S. Supermarkets, other food stores, and obesity: The atherosclerosis risk in communities study. American journal of preventive medicine. 2006;30:333–339. doi: 10.1016/j.amepre.2005.11.003. [DOI] [PubMed] [Google Scholar]
- 30.Kaczynski AT, Henderson KA. Parks and recreation settings and active living: A review of associations with physical activity function and intensity. Journal of physical activity & health. 2008;5:619–632. doi: 10.1123/jpah.5.4.619. [DOI] [PubMed] [Google Scholar]
- 31.Treiber FA, Baranowski T, Braden DS, Strong WB, Levy M, Knox W. Social support for exercise: Relationship to physical activity in young adults. Preventive medicine. 1991;20:737–750. doi: 10.1016/0091-7435(91)90068-f. [DOI] [PubMed] [Google Scholar]
- 32.Orth-Gomer K, Rosengren A, Wilhelmsen L. Lack of social support and incidence of coronary heart disease in middle-aged swedish men. Psychosomatic medicine. 1993;55:37–43. doi: 10.1097/00006842-199301000-00007. [DOI] [PubMed] [Google Scholar]
- 33.Rose KM, Suchindran CM, Foraker RE, Whitsel EA, Rosamond WD, Heiss G, Wood JL. Neighborhood disparities in incident hospitalized myocardial infarction in four u.S. Communities: The aric surveillance study. Annals of epidemiology. 2009;19:867–874. doi: 10.1016/j.annepidem.2009.07.092. [DOI] [PMC free article] [PubMed] [Google Scholar]
- 34.Shishehbor MH, Gordon-Larsen P, Kiefe CI, Litaker D. Association of neighborhood socioeconomic status with physical fitness in healthy young adults: The coronary artery risk development in young adults (cardia) study. American heart journal. 2008;155:699–705. doi: 10.1016/j.ahj.2007.07.055. [DOI] [PMC free article] [PubMed] [Google Scholar]
- 35.Boone-Heinonen J, Diez Roux AV, Kiefe CI, Lewis CE, Guilkey DK, Gordon-Larsen P. Neighborhood socioeconomic status predictors of physical activity through young to middle adulthood: The cardia study. Social science & medicine. 2011;72:641–649. doi: 10.1016/j.socscimed.2010.12.013. [DOI] [PMC free article] [PubMed] [Google Scholar]
- 36.Winkleby M, Sundquist K, Cubbin C. Inequities in CHD incidence and case fatality by neighborhood deprivation. American journal of preventive medicine. 2007;32:97–106. doi: 10.1016/j.amepre.2006.10.002. [DOI] [PMC free article] [PubMed] [Google Scholar]
- 37.Stafford M, Cummins S, Macintyre S, Ellaway A, Marmot M. Gender differences in the associations between health and neighbourhood environment. Social science & medicine. 2005;60:1681–1692. doi: 10.1016/j.socscimed.2004.08.028. [DOI] [PubMed] [Google Scholar]