

Abstract
Nonhexameric helicases use adenosine triphosphate (ATP) to unzip base pairs in double-stranded nucleic acids (dsNAs). Studies have suggested that these helicases unzip dsNAs in single–base pair increments, consuming one ATP molecule per base pair, but direct evidence for this mechanism is lacking. We used optical tweezers to follow the unwinding of double-stranded RNA by the hepatitis C virus NS3 helicase. Single–base pair steps by NS3 were observed, along with nascent nucleotide release that was asynchronous with base pair opening. Asynchronous release of nascent nucleotides rationalizes various observations of its dsNA unwinding and may be used to coordinate the translocation speed of NS3 along the RNA during viral replication.
Nonhexameric helicases belonging to superfamilies I and II are ubiquitous molecular motors essential for almost all aspects of nucleic acid metabolism (1, 2). These enzymes use the free energy released in the hydrolysis of adenosine triphosphate (ATP) to generate the mechanical work needed to unzip base pairs in double-stranded nucleic acids (dsNAs). Structural (3–6), transient kinetic (7, 8), and single-molecule fluorescence studies (9) of these proteins have suggested that these helicases unzip dsNAs in single–base pair (1-bp) increments, consuming one ATP per bp. However, there has been no direct evidence of 1-bp steps in the context of duplex unwinding, nor of the number of ATPs consumed per bp unzipped. The hepatitis C virus (HCV) encodes NS3, an RNA helicase that is essential for viral RNA replication (10) and particle assembly (11). NS3 is a superfamily II helicase (12, 13) and shows structural resemblance to other nonhexameric helicase proteins (14). Although dimerization of NS3 is important for processive RNA helicase activity in vitro (15), several studies have shown that the NS3 monomer by itself has helicase activity (16–19). Thus, monomeric NS3 is a simple model system to understand the unwinding mechanisms of nonhexameric helicases in general.
Previous studies of NS3 that used optical tweezers revealed a cyclic movement of the helicase in discrete bursts of 11 bp, which at 50 μM ATP consists of smaller steps, 3.6 bp on average (20). Because the instrument resolution was 2 bp, it was not possible to directly observe 1-bp steps of the helicase. To measure the number of base pairs unzipped in each elementary cycle of the motor, we used a dual-trap optical tweezers instrument that can resolve angstrom-level displacement on a subsecond time scale (21, 22) to follow the unwinding of a single RNA hairpin held between two optically trapped polystyrene beads (Fig. 1A). We operated the instrument without force feed-back, holding the trap positions constant to reduce noise. Use of an RNA hairpin substrate with a homopolymeric G-C sequence (16) minimized the potential effect of sequence-dependent step sizes (20) and slowed the helicase unwinding speed (16, 23, 24), facilitating the detection of the elementary steps of the helicase.
Fig. 1.
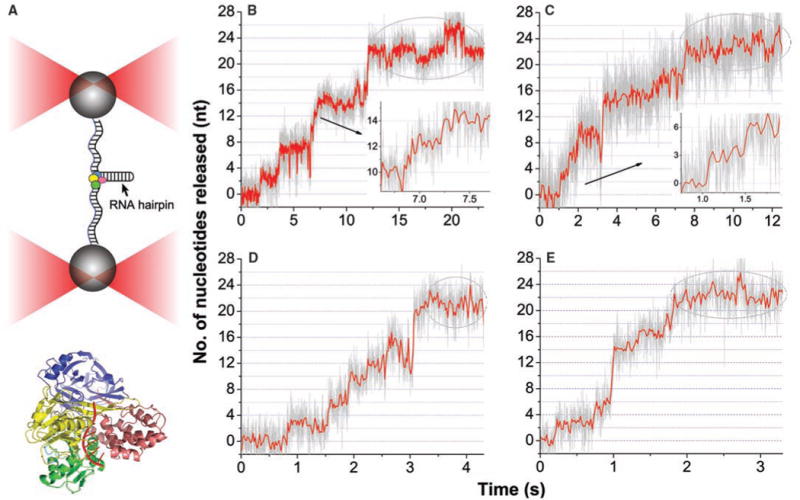
High-resolution optical tweezers experiments to study elementary steps of NS3. (A) Experimental design and attachment of the RNA substrate to dual-trap optical tweezers. Not to scale. Lower panel: Ribbon representation of the full-length HCV NS3 helicase (PDB ID 1cu1) superimposed with bound single-stranded DNA (ssDNA; PDB ID 1a1v). Green, domain 1; yellow, domain 2; pink, domain 3; blue, protease domain; red, bound ssDNA. (B to E) Representative unwinding traces collected at low ATP on a RNA hairpin substrate with homopolymeric G–C sequence (16): 10 μM ATP [(B) and (C)], 20 μM ATP (D), 50 μM ATP (E). Data shown in red were boxcarfiltered and decimated to 50 Hz. Data shown in gray were boxcar-filtered and decimated to 625 Hz. For all these trajectories, activity displayed a long pause at 22 nt, highlighted by the dashed ovals.
After assembling a tether between two polystyrene beads, we flowed in NS3 together with ATP in buffer U (19). An NS3 concentration of 0.2 nM ensures that 98% of NS3 protein exists as a monomeric species in solution (19). When the RNA hairpin was held at an initial tension (15 to 21 pN) well below its unfolding force (16), NS3 bound spontaneously to a single-stranded RNA (ssRNA) loading sequence (10 bases) and unzipped the RNA hairpin. The increase in the end-to-end extension of the tether and the corresponding drop of the applied tension across the RNA molecule were recorded in real time. We used the worm-like chain (WLC) model (25) of RNA elasticity to convert the measured extension to the number of single-stranded nucleotides released by NS3, which indicates the number of base pairs opened at the hairpin junction. Because this conversion of distance to nucleotides is sensitive to the molecular parameters that describe the ssRNA, instead of using literature values, we developed a calibration technique to directly measure these parameters in situ, and further tested these parameters using ssRNAs of known length (fig. S1). The number of nucleotides released by NS3 could thus be accurately determined. The breaking of 1 bp at the junction yields 2 nucleotides (nt) and, upon full release by NS3, corresponds to an end-to-end distance increase that ranges from 8.7 Å (at 15 pN) to 9.4 Å (at 21 pN) under current conditions.
To further slow the helicase, we used ATP concentrations between 10 and 50 μM, which were lower than the Michaelis constant for ATP binding to NS3 by a factor of 2 to 10 (20). Shown in Fig. 1, B to E, are representative unwinding traces of NS3 on G–C base pairs collected with low ATP. Under these conditions, we observed the large ~22-nt events described previously (20) (11 bp, noted by the dashed ovals); however, with angstrom resolution, we found that hairpin unwinding within these 22-nt events is diverse. We observed events in which the hairpin ends increased in length, consistent with unwinding of a single base pair (Fig. 1B, inset). However, we also observed clear instances in which the ssRNA was released in 3-nt increments (Fig. 1C, inset). Finally, we found that these forward steps were frequently interrupted by apparent backward steps that shortened the hairpin ends.
To examine the distribution of observed step sizes and quantify the dynamics observed in the single-molecule traces, we developed a statistical step detection algorithm (19) (fig. S2) based on earlier versions (26) to accommodate backward steps. Under a statistical framework, we could estimate the size of steps and the durations of pauses between steps, and, using the measured properties of the underlying noise, could compute their associated standard errors and confidence intervals. The distributions of forward step sizes and standard errors for these steps are plotted in Fig. 2, A to C, for 10, 20 and 50 μM ATP, respectively. The figure insets show that the majority of the steps identified have standard errors less than 0.2 bp, permitting statistical discrimination between steps differing by 0.5 bp, which represents a single released nucleotide.
Fig. 2.

Statistics of NS3 step size. (A to C) Distribution of NS3 forward step size at 10 μM ATP (187 steps from 33 traces) (A), 20 μM ATP (224 steps from 40 traces) (B), and 50 μM ATP (73 steps from 13 traces) (C). Insets show the distributions of standard errors for these steps. (D) Kernel density estimation for NS3 step size distribution at the above ATP concentrations. (E) Step size peak position histograms obtained from bootstrap analysis of kernel density estimations (same color coding for all panels).
Clear peaks are identified around 1 bp, the expected signal for the unzipping of a single base pair in double-stranded RNA (dsRNA) (Fig. 2, A to C). However, at all ATP concentrations, the distributions show multiple peaks that are centered at 1.5, 2, and 2.5 bp. To assess the statistical significance of these peaks, we constructed a modified histogram using a kernel density estimation approach (19) (Fig. 2D). The distribution of NS3 step sizes at 10 μM ATP shows three major peaks, each centered at 1.0 ± 0.1, 1.5 ± 0.1 and 2.0 ± 0.1 bp; in addition, there is a subtle peak centered at 0.6 ± 0.1 bp. The distribution of NS3 step sizes at 20 μM ATP also shows three major peaks, each centered at 1.0 ± 0.2, 1.5 ± 0.2 and 1.9 ± 0.2 bp; in addition, there is a broad peak centered at 2.5 ± 0.4 bp. The distribution of NS3 step sizes at 50 μM ATP shows three major peaks, each centered at 1.5 ± 0.3, 2.0 ± 0.2 and 2.5 ± 0.3 bp; in addition, there is a minor peak centered at 3.0 ± 0.3 bp. A bootstrap analysis confirmed the existence of these peaks and their statistical significance (Fig. 2E and table S1). The same analysis was done for apparent backward steps (fig. S3).
How can we rationalize the opening of the dsRNA by 0.5-bp increments? The opening of a base pair will generate two single-stranded nucleotides, one for each chain of the hairpin. A 0.5-bp increment in the end-to-end distance of the hairpin corresponds to the generation of a single nucleotide. Thus, an apparent 0.5-bp unzipping event will be observed if NS3 opens a single base pair but releases only one nascent nucleotide and holds the other within the NS3-RNA complex. Such a mechanism has been suggested by recent crystal structures (5) but has not been directly observed in the context of dsRNA unwinding. Moreover, the NS3 step size is independent of the mechanical force applied to the ends of the hairpin (fig. S4), indicating that its variation is not a result of mechanical force but a property of the helicase.
To further test this mechanism, we investigated the distribution of dwell times before each stepping event, and then grouped these dwell times according to the size of observed NS3 steps. Shown in Fig. 3, A and B, are plots of the distributions of these times at 10 and 20 μM ATP, which have clear 1-bp steps. A nonlinear least-squares analysis indicates that these distributions are best described by a single-exponential decay (19). In addition, we found that the time constants used to describe these single-exponential decays are statistically indistinguishable from the dwells that occur before 1, 1.5 and 2-bp steps (Fig. 3C). The average decay time is 1.3 ± 0.2 s at 10 μM ATP and 0.7 ± 0.1 s at 20 μM ATP. The single-exponential decay suggests that these dwells are governed by a single kinetic event—the expected behavior for the binding of a single ATP molecule before each step under limiting ATP concentrations. The decay time of 0.7 s at 20 μM AT P —shorter than the decay time at 10 μM ATP by a factor of ~2—is evidence that the dwell is dominated by the time it takes to bind a single ATP and quantitatively compares well with the subpause duration measured previously on a mixed sequence (19, 20).
Fig. 3.

Statistics of NS3 dwell times before forward steps. (A and B) Distributions of NS3 dwell times before 0.5 and 1 bp (red), 1.5 bp (blue), and 2 bp (black) on G–C sequence at 10 μM ATP (A) and 20 μM ATP (B). Single-exponential fits are shown in dashed lines of matching colors, with R2 values of 0.96 (red), 0.98 (blue), and 0.98 (black) for 10 μM ATP (A) and R2 values of 0.99 (red), 0.99 (blue), and 0.96 (black) for 20 μM ATP (B). (C) The single-exponential decay constants as a function of step size at 10 μM (red circles) and 20 μM (blue triangles) ATP. Dwell times were derived from 33 NS3 unwinding trajectories at 10 μM ATP and 40 unwinding trajectories at 20 μM ATP.
These results are consistent with models in which the enzyme binds a single ATP before unzipping the hairpin by 1 bp. However, these models do not explain the binding of a single ATP before the observed step sizes of 1.5 and 2 bp. A possible explanation is that the higherorder peaks in the step size distribution result from dwells that are stochastically faster than the measurement time and thus are missed by the step detection algorithm. Given the measured dwell time distributions in Fig. 3, we can predict the fraction of steps we should observe for each size (table S2). As shown in the table, missed dwells account for only a small fraction of the 1.5-bp and 2-bp steps observed. An alternative explanation is that NS3 can open 2 bp with the use of a single ATP. In that case, sequestering of one nascent nucleotide would produce an observed step size of 1.5 bp, and the yield would be 2 bp if no sequestering occurred. However, this model is difficult to reconcile with recent crystal structures of NS3 in complex with single-stranded nucleic acids and several ATP analogs (4, 5), where conformational intermediates before and after ATP hydrolysis were stably trapped and imply a single base translocation per ATP cycle.
A model that can reconcile both the above data and structural studies of NS3 is one in which higher-order peaks represent the release of nucleotides held in previous rounds of unwinding. This model is schematically shown in fig. S5, where NS3 binds a single ATP and catalyzes the unzipping of a single base pair of dsRNA. We define this single base pair as the unwinding step size of NS3 to distinguish it from the observed step size directly measured from the unwinding trajectories. In this model, RNA strand release by the helicase is decoupled from base pair opening. The helicase can hold the nascent nucleotides until later for release (fig. S5, D and E). Unzipping of 1 bp followed by the release of 3 nt produces the 1.5-bp observed step size, with one of the released nucleotides held by the enzyme from a previous unwinding cycle. We have conducted Monte Carlo simulations based on this sequestering model to quantitatively explain the observed step size distribution (fig. S6). In addition, the simulations rule out 2 bp but support 1 bp as the NS3 unwinding step size. Several steps of unzipping can take place before strand release, and sequestering must involve both strands of the nascent ssRNA. A direct prediction of this model is that the first observed step of NS3 upon initiation of hairpin unwinding can be any of the four possible sizes: 0.5, 1, 1.5, and 2 bp, where 1.5 and 2 bp result from strand release after the second ATP binding and translocation event. The first 1-bp opening may not yield a visible step size if sequestering of both strands occurs (fig. S5E). However, only 1 or 0.5 bp would be observed for the first step if NS3 either releases both strands or sequesters just one strand. Indeed, the distribution of the first observed step of NS3 shows clear peaks at 1, 1.5, and 2 bp (Fig. 4, A and B), thereby revealing that both RNA strands are sequestered by NS3.
Fig. 4.
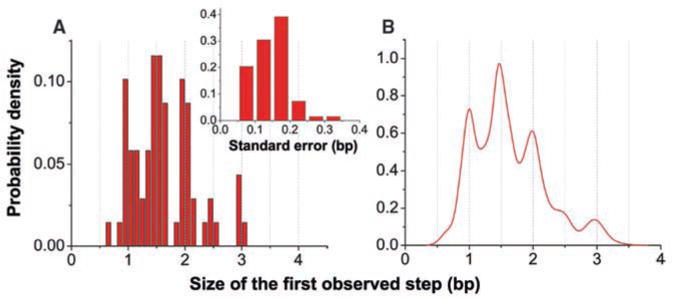
Statistics of NS3 first observed step. (A) Size distribution of NS3 first observed step derived from 73 trajectories at 10 and 20 μM ATP. The inset shows standard errors of these steps. (B) Kernel density estimation of this step size distribution.
The structural basis of nucleotide sequestering by NS3 along the 3′ ssRNA (the tracking strand) is suggested by crystal structures of NS3 in complex with ssRNA (5), where Trp501 (fig. S5) serves as an anchor point that stacks with nucleotide bases and prevents the nascent nucleotide from release even though the ssRNA has been reeled in by the helicase for exactly one base after ATP hydrolysis. This feature shares similarity with the “scrunching” model proposed previously for UvrD translocase (7). The structural basis of nucleotide sequestering along the 5′ ssRNA (the displaced strand) is suggested by recent computer modeling (18), which revealed an extensive basic patch on the NS3 surface aside from the tracking strand binding site. The sequestering of the displaced strand by NS3 also shares similarities with a previous model for the monomeric Dda helicase from bacteriophage T4, in which interactions of the enzyme with the displaced DNA occur during unwinding (27). The consequence of holding on to both strands by NS3 is the protection of the duplex junction against forcible stretching, which explains why NS3 unwinding speed is insensitive to the tension applied to the ends of the hairpin (20) but is rather sensitive to the thermodynamic stability of the base pair sequence (16, 24). Sequestering and asynchronous strand release may also operate in other nonhexameric helicases, because the independence of unwinding rate with respect to force was also observed for the nonhexameric UvrD helicase (28). Previous models of NS3 unwinding (9, 18) suggested the sequestering of the 5′ displaced strand by NS3, but neither of these models directly measured this feature. Our model of dsRNA unwinding can rationalize the various observations of NS3 unwinding (19). The formation of transient loops of ssRNA on both strands, via the sequestering mechanism proposed here, provides a point of regulation for strand release by a helicase. This mechanism can be used by the enzyme to coordinate the speed of movement along nucleic acids (29) for efficient viral RNA replication (10) or viral particle assembly (11).
Supplementary Material
Acknowledgments
We thank Cheng lab members, especially X. Hou and H. Song, for critical reading of the manuscript; J. Yu for critical discussions; J. Vieregg for providing the all-AU RNA hairpin for WLC calibration of RNA elasticity; and Henkel Corporation for providing Ablefilm adhesive film for making microfluidic chambers. Supported by the University of Michigan at Ann Arbor, the Ara Paul Professorship fund at the University of Michigan, and March of Dimes Foundation research grant 5_FY10_490 (W.C.); NIH grant 5R01GM010840 (I.T.); U.S. Department of Energy grant LBNL_DE_AC0376SF00098; and NIH grant 5R01GM032543 (C.B.). W.C. is a Basil O’Connor Starter Scholar of the March of Dimes Foundation. W.C. prepared experimental materials and conducted the experiments; W.C., S.G.A., and J.R.M. performed the analysis; and W.C., S.G.A., J.R.M., I.T., and C.B. wrote the paper.
Footnotes
The authors declare no competing financial interests.
Supporting Online Material
www.sciencemag.org/cgi/content/full/333/6050/1742/DC1
SOM Text
References (30–62)
References and Notes
- 1.Lohman TM, Tomko EJ, Wu CG. Nat Rev Mol Cell Biol. 2008;9:391. doi: 10.1038/nrm2394. [DOI] [PubMed] [Google Scholar]
- 2.Jankowsky E. Trends Biochem Sci. 2011;36:19. doi: 10.1016/j.tibs.2010.07.008. [DOI] [PMC free article] [PubMed] [Google Scholar]
- 3.Velankar SS, Soultanas P, Dillingham MS, Subramanya HS, Wigley DB. Cell. 1999;97:75. doi: 10.1016/s0092-8674(00)80716-3. [DOI] [PubMed] [Google Scholar]
- 4.Gu M, Rice CM. Proc Natl Acad Sci USA. 2010;107:521. doi: 10.1073/pnas.0913380107. [DOI] [PMC free article] [PubMed] [Google Scholar]
- 5.Appleby TC, et al. J Mol Biol. 2011;405:1139. doi: 10.1016/j.jmb.2010.11.034. [DOI] [PMC free article] [PubMed] [Google Scholar]
- 6.Lee JY, Yang W. Cell. 2006;127:1349. doi: 10.1016/j.cell.2006.10.049. [DOI] [PMC free article] [PubMed] [Google Scholar]
- 7.Tomko EJ, Fischer CJ, Niedziela-Majka A, Lohman TM. Mol Cell. 2007;26:335. doi: 10.1016/j.molcel.2007.03.024. [DOI] [PMC free article] [PubMed] [Google Scholar]
- 8.Rajagopal V, Gurjar M, Levin MK, Patel SS. J Biol Chem. 2010;285:17821. doi: 10.1074/jbc.M110.114785. [DOI] [PMC free article] [PubMed] [Google Scholar]
- 9.Myong S, Bruno MM, Pyle AM, Ha T. Science. 2007;317:513. doi: 10.1126/science.1144130. [DOI] [PMC free article] [PubMed] [Google Scholar]
- 10.Lam AM, Frick DN. J Virol. 2006;80:404. doi: 10.1128/JVI.80.1.404-411.2006. [DOI] [PMC free article] [PubMed] [Google Scholar]
- 11.Ma Y, Yates J, Liang Y, Lemon SM, Yi M. J Virol. 2008;82:7624. doi: 10.1128/JVI.00724-08. [DOI] [PMC free article] [PubMed] [Google Scholar]
- 12.Pyle AM. Annu Rev Biophys. 2008;37:317. doi: 10.1146/annurev.biophys.37.032807.125908. [DOI] [PubMed] [Google Scholar]
- 13.Raney KD, Sharma SD, Moustafa IM, Cameron CE. J Biol Chem. 2010;285:22725. doi: 10.1074/jbc.R110.125294. [DOI] [PMC free article] [PubMed] [Google Scholar]
- 14.Singleton MR, Dillingham MS, Wigley DB. Annu Rev Biochem. 2007;76:23. doi: 10.1146/annurev.biochem.76.052305.115300. [DOI] [PubMed] [Google Scholar]
- 15.Serebrov V, Pyle AM. Nature. 2004;430:476. doi: 10.1038/nature02704. [DOI] [PubMed] [Google Scholar]
- 16.Cheng W, Dumont S, Tinoco I, Jr, Bustamante C. Proc Natl Acad Sci USA. 2007;104:13954. doi: 10.1073/pnas.0702315104. [DOI] [PMC free article] [PubMed] [Google Scholar]
- 17.Jennings TA, et al. J Biol Chem. 2009;284:4806. doi: 10.1074/jbc.M805540200. [DOI] [PMC free article] [PubMed] [Google Scholar]
- 18.Serebrov V, Beran RK, Pyle AM. J Biol Chem. 2009;284:2512. doi: 10.1074/jbc.M805460200. [DOI] [PMC free article] [PubMed] [Google Scholar]
- 19.See supporting material on Science Online.
- 20.Dumont S, et al. Nature. 2006;439:105. doi: 10.1038/nature04331. [DOI] [PMC free article] [PubMed] [Google Scholar]
- 21.Cheng W, Hou X, Ye F. Opt Lett. 2010;35:2988. doi: 10.1364/OL.35.002988. [DOI] [PubMed] [Google Scholar]
- 22.Moffitt JR, Chemla YR, Izhaky D, Bustamante C. Proc Natl Acad Sci USA. 2006;103:9006. doi: 10.1073/pnas.0603342103. [DOI] [PMC free article] [PubMed] [Google Scholar]
- 23.Johnson DS, Bai L, Smith BY, Patel SS, Wang MD. Cell. 2007;129:1299. doi: 10.1016/j.cell.2007.04.038. [DOI] [PMC free article] [PubMed] [Google Scholar]
- 24.Donmez I, Rajagopal V, Jeong YJ, Patel SS. J Biol Chem. 2007;282:21116. doi: 10.1074/jbc.M702136200. [DOI] [PubMed] [Google Scholar]
- 25.Bustamante C, Marko JF, Siggia ED, Smith S. Science. 1994;265:1599. doi: 10.1126/science.8079175. [DOI] [PubMed] [Google Scholar]
- 26.Arunajadai SG. Math Biosci. 2009;220:57. doi: 10.1016/j.mbs.2009.04.003. [DOI] [PubMed] [Google Scholar]
- 27.Eoff RL, Raney KD. Nat Struct Mol Biol. 2006;13:242. doi: 10.1038/nsmb1055. [DOI] [PubMed] [Google Scholar]
- 28.Dessinges MN, Lionnet T, Xi XG, Bensimon D, Croquette V. Proc Natl Acad Sci USA. 2004;101:6439. doi: 10.1073/pnas.0306713101. [DOI] [PMC free article] [PubMed] [Google Scholar]
- 29.Hamdan SM, Loparo JJ, Takahashi M, Richardson CC, van Oijen AM. Nature. 2009;457:336. doi: 10.1038/nature07512. [DOI] [PMC free article] [PubMed] [Google Scholar]
Associated Data
This section collects any data citations, data availability statements, or supplementary materials included in this article.