

Abstract
UBC13 is a non-canonical Ubiquitin Conjugating Enzyme (E2) that has been implicated in a variety of cellular signaling processes due to its ability to catalyze formation of Lysine 63-linked polyubiquitin chains on various substrates. In particular, UBC13 is required for signaling by a variety of receptors important in immune regulation, making it a candidate target for inflammatory diseases. UBC13 is also critical for double-strand DNA repair, and thus a potential radiosensitizer and chemosensitizer target for oncology. We developed a high-throughput screening (HTS) assay for UBC13 based on the method of time-resolved fluorescence resonance energy transfer (TR-FRET). The TR-FRET assay combines fluorochrome (Fl)-conjugated ubiquitin (fluorescence acceptor) with terbium (Tb)-conjugated ubiquitin (fluorescence donor), such that the assembly of mixed chains of Fl- and Tb-ubiquitin creates a robust TR-FRET signal. We defined conditions for optimized performance of the TR-FRET assay in both 384 and 1536-well formats. Chemical library screens (total 456,865 compounds) were conducted in high-throughput mode using various compound collections, affording superb Z' scores (typically > 0.7) and thus validating the performance of the assays. Altogether, the HTS assays described here are suitable for large-scale, automated screening of chemical libraries in search of compounds with inhibitory activity against UBC13.
INTRODUCTION
The chemistry of ubiquitination in eukaryotic cells typically relies on the dynamic interaction of ubiquitin (Ub) with three different classes of enzymes, termed ubiquitin-activating enzymes (E1), ubiquitin-conjugating enzymes (E2), and ubiquitin ligases (E3)11; 12; 36. The specificity of substrate selection for ubiquitination is dictated by E3 ligases, which have been implicated in nearly every facet of cell biology. Many E3 ligases have been causally implicated in disease mechanisms 27.
Protein ubiquitination is probably best known for its role in controlling protein degradation 9. In this context, formation of poly-Ub chains on target proteins, where lysine48 (K48) serves as the linking residue among Ub molecules, creates a structure recognized by components of the 26S proteasome, thus targeting proteins that bear this post-translational modification for destruction 4; 32. Chaperones that recognize K48-linked Ub chains have also been described that target proteins to lysosomes for degradation, via the phenomenon of chaperone-mediated autophagy 5. However, UBCs have been identified that catalyze other types of Ub linkages, which are not apparently signals for protein destruction but rather play a variety of regulatory roles in cellular signaling, genome maintenance, and protein trafficking, among other functions 6; 13; 14; 24. Some UBCs uniquely catalyze the attachment not of Ub but of Ub-related proteins (e.g. SUMO, NEDD8, APG12) to target proteins 16; 43. As such, these non-canonical UBCs control discrete subsets of cellular processes beyond protein degradation, some of which are important in disease.
UBC13 catalyzes the formation of poly-Ub chains linked via K63 rather than K48 14. This E2 requires co-factor proteins, either UEV1A or MMS2, for its catalytic activity 6; 14. Among the known E3 ligases that collaborate with UBC are TRAFs, a family of RING domain-containing adapter proteins that associate with various members of the Tumor Necrosis Factor (TNF) receptor family or intermediate adapter proteins that associate with TNF-family receptors, Toll-Like Receptors (TLRs), and NOD-like Receptors (NLRs), and downstream components of the T-cell and B-cell antigen receptor signal transduction machinery 1; 6; 7; 29; 37; 39; 44. UBC13-mediates K63-linked ubiquitination of various protein kinases that associate with TRAFs, a post-translational modification associated with their activation. Recently, gene ablation studies in mice have validated UBC13 as a candidate target for autoimmune and inflammatory diseases 40; 41. In this regard, our laboratory has produced hemizygous ubc13 mice (ubc13+/−), observing that reduced levels of UBC13 protein are associated with significantly impaired signaling by TNF and lipopolysaccharide (LPS), resulting in reduced TRAF ubiquitination in vivo, accompanied by reduced activation of NF-κB and stress kinases 8. Reduced levels of UBC13 activity in these mice correlate, for example, with resistance to septic shock, implying that chemical inhibitors of this unique E2 might find utility for certain diseases.
UBC13 also plays an important role in double-strand DNA break repair in eukaryotes from yeast to mammals 34. Ablation of the gene encoding the ortholog of UBC13 in yeast, for example, results in marked sensitivity to ionizing radiation. Thus, UBC13 may also represent a radiosensitizer of chemosensitizer target for oncology. An anti-microbial natural product, Leucettamol A was reported to inhibit heterodimer formation of UBC13-UEV1A by ELISA at 50 μg/ml 33. Yet another study reported identification of a compound from a combinatorial peptoid library as an UBC13-UEV1A interaction antagonist 26. However, neither of these reported UBC13 inhibitors has drug-like properties that would provide a starting point for a hit-to-lead optimization campaign.
Methods to quantitatively assay the activity of the UBCs in a high-throughput mode would therefore enable drug discovery and chemical biology explorations of these enzymes. We employed lanthanide donor terbium-chelate conjugated to ubiquitin (Tb-Ub) and its FRET pair acceptor fluorescein-conjugated ubiquitin (Fl-Ub) to create robust homogeneous HTS assays for UBC13 based on the TR-FRET method 3. We report here optimized high-throughput TR-FRET-based screening assays for UBC13 and validate them by conducting automated screens of various chemical libraries.
RESULTS
TR-FRET method for monitoring formation of poly-Ub chains produced by UBC13
Ubiquitination reactions catalyzed by UBC13 in collaboration with its cofactor UEV1A were monitored by a novel TR-FRET assay that combined commercially available Fl-and Tb-conjugated ubiquitin molecules. The excitation of donor terbium chelate (360 nm) followed by its emission (480 nm) results in energy transfer to proximal acceptor fluorescein via FRET 28, where the energy transfer occurs when Tb-Ub and Fl-Ub are in close proximity (10–100 Ao) following their co-assembly into poly-Ub chains (Figure 1). The resulting interaction is quantified in terms of ratiometric measurement of fluorescein (520 nm) to terbium (480 nm) emission, constituting the TR-FRET signal.
Figure 1. Schematic representation of TR-FRET-based assay for UBC13-UEV1A-mediated ubiquitination.
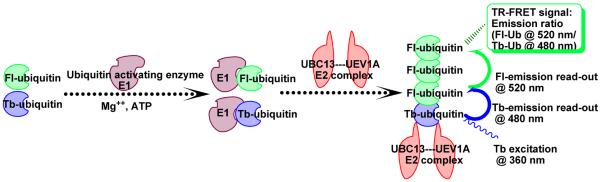
Diagram shows use of terbium-ubiquitin and fluorescein-ubiquitin to generate a FRET reaction. In the presence of Mg2+ and ATP, labeled ubiquitin attaches to ubiquitin activating enzyme (E1) followed by transfer to ubiquitin conjugating enzyme complex (E2, UBC13-UEV1A). This event triggers ubiquitin chain build up, which is monitored by TR-FRET that occurs when terbium-ubiquitin and fluorescein-ubiquitin are in close proximity to each other. Terbium is excited at ~360 nm light emitting at a wavelength (~480 nm) suitable for excitation of fluorescein, which in turn emits at ~520 nm. The TR-FRET signal is measured as an emission ratio (520 nm: 480 nm).
Recombinant His-tagged proteins (hereafter referred to as UBC13, UEV1A and MMS2) for the assay were bacterially expressed and purified, then analyzed by SDS-PAGE and size-exclusion chromatography for UBC13, UEV1A, and the heterodimeric complex of UBC13-UEV1A (Supplemental figure 1A–E). Ub chain assembly catalyzed by UBC13 in complex with UEV1A was monitored by preparing a reaction mix containing Fl-Ub, Tb-Ub, ATP, E1, and the UBC13-UEV1A complex (E2), referred to as `complete reaction mix'. Reactions lacking any of these components were compared as controls to determine the TR-FRET signal specificity. Thus, the fold-increase in signal was determined from emission ratio readings obtained for `complete reaction mix' versus control reaction mixes lacking key components such as UBC13.
A UBC13-dependent increase in TR-FRET signal was observed, representing a ~ 5-fold elevation under the reaction conditions employed here in 384-well plates (Figure 2A). This TR-FRET signal was correlated with formation of poly-Ub chains in complete reactions, as demonstrated by SDS-PAGE analysis of the reaction products using fluorimager analysis to detect Fl-Ub polymers (Figure 2B). Reactions lacking the E1, UBC13, or UEV1A afforded little TR-FRET signal or Ub polymerization. Mass-spectrometry analysis of the reaction products confirmed the presence of K63-linked Ubiquitin (Supplemental Figure 2).
Figure 2. Demonstration of TR-FRET reaction for UBC13-UEV1A reactions.

(A) Ubiquitination reactions were performed to monitor ubiquitin chain assembly by TR-FRET methodology. Complete reaction mixture consisting of Fl-Ub (300 nM), Tb-Ub (12.5 nM), E1 (12.5 nM), UBC13-UEV1A heterodimer complex (500 nM), and ATP regenerating system (1X) was compared with reactions lacking some components. In (A), the emission ratio (520 nm: 480 nm) was determined at 1 hr. Data are expressed as mean ± SEM (n=3). Abscissa (x-axis): Reaction components; Ordinate (y-axis): TR-FRET signal expressed as emission ratio (Fl-520 nm/Tb-480 nm). Similar data were obtained at 3 and 5 hrs (not shown). (B) SDS-PAGE analysis of reactions was performed. Reaction aliquots were resolved by 15% SDS-PAGE and imaged. Molecular weight (mw) markers are indicated in kiloDaltons. Polyubiquitin conjugates are indicated by bracket and mono-Fl-ubiquitin by arrowhead.
Our initial attempts to optimize TR-FRET reactions in 384-well format addressed several variables, including concentration of substrate (molar ratio of Fl-Ub:Tb-Ub), concentration of UBC13-UEV1A heterodimeric complex, reaction time, reaction temperature, and buffer composition. A variety of assay buffers were compared, settling on 50 mM HEPES (pH 7.5) containing 0.005% Empigen BB and 0.1 mM DTT. We empirically determined the molar ratio of Fl-Ub and Tb-Ub that produced the strongest TR-FRET signal, which was approximately 15:1 in 384-well format (Figure 3A). Regardless of Fl-Ub:Tb-Ub ratio, it should be recognized that the total ubiquitin concentration used for reactions may bias the types of inhibitors identified by the assay (competitive vs non-competitive), which was not addressed here.
Figure 3. Assay optimization.

(A) Determination of optimal Fl-Ub: Tb-Ub ratio. The acceptor fluorophore, FI-Ub, was titrated against donor Tb-Ub to determine ratio for optimal signal:noise (S/N) results in the UBC13-UEV1A-mediated TR-FRET reaction. Complete ubiquitination reaction mixtures (- • -) consisting of E1 (12.5 nM), UBC13-UEV1A complex (500 nM), Tb-Ub (10 nM), and Mg2+/ATP were incubated with increasing molar ratio of FI-Ub: Tb-Ub, ranging from 0–40. Ubiquitination reaction mixtures lacking UBC13-UEV1A complex (- ◆ -) were similarly incubated with increasing molar concentrations of FI-Ub. Graphical analysis of TR-FRET measurements shows S/N > 6.0 with 15: 1 molar ratio of [FI-Ub]: [Tb-Ub]. TR-FRET data were plotted as emission ratio (y-axis) versus molar ratio of [Fl-Ub]: [Tb-Ub] (x-axis). Data are represented as mean ± SEM (n=2) and represent 1 hr measurements. Note that because the total amount of ubiquitin also changed, the optimal Fl-Ub:Tb-Ub ratio may be different as total ubiquitin varies. (B)Effects of temperature and time on TR-FRET-based ubiquitination assay using UBC13-UEV1A. Time-dependent ubiquitination reactions were performed at RT. Reaction components are indicated. Data are represented as mean ± SEM (n=3). Note that signal:noise ratio remains acceptable for ~8 hr at RT but not at 37 °C.
Ubiquitination reactions were performed at 37°C and at room temperature (RT), to assess whether it is feasible to run the assay at RT, and the stability of TR-FRET signal over time was determined at RT and at 37°C (Figure 3B and Supplemental Figure 3, respectively). Results from these studies suggest that TR-FRET signal is stable for at least 8 hrs when incubations were performed at RT (Figure 3B). However, by 12 hrs and beyond, the TR-FRET signals of some incomplete reactions began to rise, thus decreasing the ratio between UBC13-dependent and –independent signals.
Cofactor-dependent polyubiquitin chain formation monitored by TR-FRET
Previous data have demonstrated the physical association of UBC13 with its cofactors UEV1A or MMS2 to form heterodimeric complexes with 1:1 stoichiometry 19; 46. We used the TR-FRET assay and gel electrophoresis of reaction products to explore the dependence of UBC13 on the cofactors UEV1A and MMS2. UBC13 stimulated modest TR-FRET signals when reactions were established without cofactor UEV1A or MMS2 (Figure 4A, B). Addition of UEV1A or MMS2 at an equimolar ratio relative to UBC13 increased the TR-FRET signal by an additional 6- to 8-fold beyond UBC13 alone (Figure 4A, B).
Figure 4. Cofactor dependence of UBC13-catalyzed poly-ubiquitination.

TR-FRET reactions were performed without or with various amounts of cofactor (A) UEV1A or (B) MMS2. Molar ratios of co-factors relative to UBC13 are indicated. Basal reactions contained Fl-Ub (150 nM), Tb-Ub (10 nM), E1 (12.5 nM), UBC13 (250 nM), and ATP regenerating system (1X). TR-FRET reactions were measured at 3 hrs. Data are represented as mean ± SEM (n=3).
The concentration dependence of cofactor-mediated enhancement of UBC13 activity was examined. Titrating various concentrations of UEV1A into reactions with fixed concentration of UBC13 resulted in a concentration-dependent increase in TR-FRET signal up to molar ratio of 1:1 (UEV1A:UBC13), above which the signal declined modestly (Figure 4A). Though shown only for 3 hrs, similar results were obtained for reactions of 1 or 5 hrs duration (not shown). Without UBC13, only background levels of TR-FRET signal were generated, consistent with reports that UEV1A lacks the ability to catalyze Ub polymerization by itself (Figure 4A). Similar results were obtained for MMS2 (Figure 4B). Sub-stoichiometric concentrations of MMS2 in complex with UBC13 yielded concentration-dependent TR-FRET signals up to 0.4:1 (MMS2: UBC13), beyond which a stable TR-FRET signal was observed. Analysis of reaction products by SDS-PAGE showed that in the absence of UEV1A or MMS2, low molecular weight conjugates containing Fl-Ub were produced in reactions containing UBC13 (not shown). Addition of various amounts of UEV1A or MMS2 resulted in the concentration-dependent appearance of higher molecular weight Fl-Ub-containing conjugates, suggesting that these cofactors are especially important for Ub chain elongation but perhaps not initiation. We conclude that the TR-FRET-based Ub polymerization method described here is suitable for monitoring the effects of cofactors on UBC13-catalyzed Ub chain assembly.
Implementation of HTS assays for UBC13
The TR-FRET-based ubiquitination assay for UBC13 was implemented as a HTS assay for chemical library screening in 384-well format at RT (for convenience) to assess the assay window (signal: noise ratio) and reproducibility. First, TR-FRET assays were performed at RT in which multiple replicates were prepared of the complete reaction (maximum signal: 830.8 ± 28.9 (mean ± SEM; n = 60) and compared with multiple replicates of reactions containing all assay components except UBC13-UEV1A (minimum signal: 377.9 ± 14.7 (mean ± SEM; n= 56). Data from these experiments allowed Z' factor determination, which was ~ 0.7 at 1 hr at RT (Figure 5A) and ~0.66 at 37°C (Supplemental Figure 4).
Figure 5. HTS implementation of TR-FRET based ubiquitination assay.

(A) Z' factor determination of TR-FRET-based UBC13-UEV1A ubiquitination assays. Multiple replicate reactions were performed at RT, taking TR-FRET measurements after 1 hr incubation for samples containing (+) or lacking (−) UBC13 and UEV1A. The Z' score was calculated as 0.71 as described in supplemental information. (B)DMSO tolerance of TR-FRET-based ubiquitination assay. UBC13-UEV1A TR-FRET reactions were performed in the presence or absence of 0.5–2% DMSO (final). Reaction components are indicated. Data are represented as mean ± SEM (n=60). Abscissa (x-axis): percent DMSO in the reaction mixture (0–5%); Ordinate (y-axis): TR-FRET signal represented as emission ratio (Fl-520 nm/Tb-480 nm). (C) Histogram representation of LOPAC library screen. Full inhibition controls include reaction system lacking UBC13-UEV1A and are without any compound added to them. These controls are located at 98% on x-axis (% Inhibition). No inhibition controls include complete reaction system and are without any compound added to them. These controls are located at −4.0% on x-axis (% Inhibition). The majority of non-hits are located at ≈20% on x-axis (% Inhibition) reflecting the effect of “aged” DMSO. Compounds having < 50% inhibition are considered non-hits. x-axis: % Inhibition; y-axis: number of compounds. (D) 3D Scattergram representation of LOPAC library screen.  : Full inhibition controls include reaction system lacking UBC13-UEV1A without compound added.
  : No inhibition controls include complete reaction system without compound added.
  : LOPAC compounds; x-axis: Well #; y-axis: % Inhibition; z-axis: Plate ID.
Next, the DMSO tolerance of the HTS assay was assessed, in preparation for compound library screening, owing to the standard practice of suspending compounds in DMSO for HTS screening of compound libraries. Although DMSO diminished the UBC13-dependent TR-FRET signal, the fold-difference in specific signal still remained ≥ 5-fold when compared to control reactions at DMSO concentrations as high as 5% v:v (Figure 5B).
A small pilot chemical library screen was then undertaken using the TR-FRET assay in 384-well format. To this end, a library of 1280 pharmacologically active compounds (LOPAC [Sigma]) suspended in DMSO was screened (20 nL DMSO per well, equating to 0.1 % v:v, and a final in well compound concentration of 10 μM). Each plate contained a row of wells that received complete reaction mix with 0.1 % DMSO (maximum) and a row of wells with reaction mix lacking UBC13-UEV1A (minimum), again with 0.1 % DMSO. These positive and negative control wells were used to calculate a Z' statistic for each plate. Presentation of the primary screening data in histogram format (Figure 5C) showed a Gaussian distribution of TR-FRET signals for most of the compounds, with the peak of the distribution coinciding approximately with the control wells comprised of complete reactions without compounds. The slight shift to the right (~10% inhibition) of the peak of the Gaussian distribution obtained for library compounds relative to the positive control likely results from “aging” of DMSO that occurs with long-term storage of compounds in this solvent, and suggests that using fresh stock of chemical library would be advisable for some compound collections. From this screen of 1280 compounds, 21 suppressed the UBC13-catalyzed TR-FRET reactions by > 50% yielding a hit rate of 1.6%. These compounds appear as a tail on the Gaussian distribution (Figure 5C). Of these 21 compounds, 6 confirmed upon repeat testing (> 50% inhibition), for an overall hit rate of 0.29%. Results from this pilot screening campaign are presented in Figure 5D, where TR-FRET signals for each well are displayed on the z-axis and the plate and well coordinates are depicted on the x-and y-axes. The positive and negative control wells are shown in red.
The relative potency of the confirmed hits was evaluated by dose-response studies, determining the concentration required for inhibition of TR-FRET reactions by 50% (IC50). The results for 3 representative compounds along with their structures are shown in Supplemental Figure 5, which had IC50 values of 0.3 to 1.5 μM. Because the complete TR-FRET reaction mix contains three proteins (E1, UBC13, cofactor UEV1A, and Ub), compounds identified by HTS could theoretically inhibit any of these proteins.
Automated large-scale library screening
Automated large chemical library screens were conducted in 384-well format. A 125,000 chemical library screen assembled at Sanford-Burnham (referred to as SBMRI library) was undertaken in 384-well format with a few changes made to the optimized protocol implemented for LOPAC library screen. The concentration of E1 was raised to 50 nM from 12.5 nM used for LOPAC library screen. This was done to prevent chances of detecting inhibitors targeting E1 when used at higher or excess concentration. Additionally, E1, labeled ubiquitins and Mg-ATP were pre-incubated 30 minutes before the 2 hr incubation period of UBC13 and UEV1A, for heterodimer formation. A summary of the primary HTS representing Z' factor for the 125K compound screen is shown in Supplemental Figure 6A. SBMRI library compounds were screened at an average concentration of 10 μM. The average Z' factor observed was 0.76, indicating that the assay performs well when scaled. The number of hits per plate of compounds is provided in Supplemental Figure 6B, with an overall `hit rate' of 2.2%. Hits were reconfirmed in the same assay by repeat testing, with 91.5% confirmed for an adjusted hit rate of 2.0%. Chemical hits were then processed in an alternate TR-FRET assay consisting of an unrelated target (Bfl-1), eliminating 90.6% of hits to yield a final validated hit rate of 0.19% after counter-screening.
1536-well implementation of HTS assay for UBC13
In preparation for screening of large chemical libraries and to preserve assay reagents, we implemented the HTS assay in 1536-well format. TR-FRET read-outs were compared in 384- versus 1536-well format (Supplemental Figure 7). We discovered that inclusion of 0.1% BSA greatly improved assay performance in 1536-well format, whereas BSA was not necessary in 384-well format (Supplemental Figure 7). Otherwise, the TR-FRET assay's performance was comparable to or even better in 1536-well format, provided the E1 concentration was adjusted to 200 nM. In this regard, the impact of E1 concentration (ranging from 0-200 nM) on TR-FRET activity was assessed in both 384 and 1536 well formats, revealing that assay signal is highly dependent on E1 concentration up to 200 nM (Supplemental Figure 7). As a function of time, at varying concentrations of E1 ranging from 0 – 200 nM, we determined that TR-FRET reaction rates remained linear for at least 3 hrs in 1536 well format and at least 7 hrs in 384 well format (not shown). The influence of reaction volume on assays performed in 1536-well plates was also evaluated, comparing 2, 4, and 6 uL volumes. A reaction volume as low as 2 μL monitored over a 3 hr time period produced sufficient TR-FRET signal to yield excellent signal:noise ratios, and was comparable to results with reaction volumes of 4 and 6 μL (Figure 6A).
Figure 6. Sanford-Burnham internal chemical library screen data.
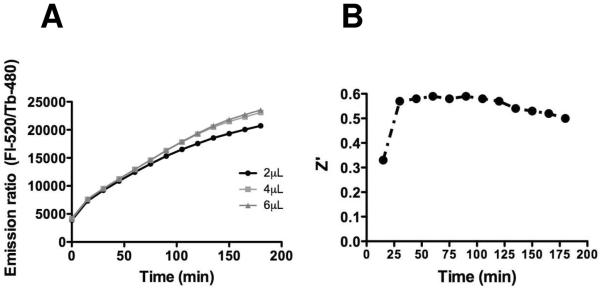
(A) Primary HTS assay performed in a 384-well format using internal chemical library screen [N ≈ 125,000 compounds (378 plates)]. The average Z' factor observed was 0.76. (B) Chemical `hits' results obtained from primary HTS screen represented for each individual plate ID are shown.
To balance assay performance against reagent consumption, the 1536 well HTS assay was conducted with reaction conditions that included (final concentrations) of E1 = 100 nM, E2 = 125 nM (heterodimeric complex of UBC13 and UEV1A), ratio of Fl/Tb-Ubiquitin = 75/6 nM. Assay signal generation was nearly linear for at least 3 hrs. Assay performance as reflected by Z' factor over time was also assessed in 4 μL volume reactions in 1536-well format (Figure 6B). Representative concentration-response profiles for one of the chemical inhibitors identified are shown in Figure 7.
Figure 7. Comparison profile of the screening hit in 384 vs. 1536-well formats.

Percent inhibition profiles obtained for one of the inhibitors derived from chemical library screen represented. Data obtained from TR-FRET-based HTS assay performed in a 384-well format (A) versus 1536-well format (B) is shown. IC50 values are shown and were determined from log [concentration]-percent inhibition curves constructed for each inhibitor. Data are expressed as mean±SEM (N=3).
Screening the NIH library
The NIH collection of 253 plates (1536-well format), approximately 330,000 compounds, was screened at 20 μM using the 1536-well format assay protocol. The average Z' for the assay was 0.78 suggesting a robust assay optimized for HTS (Figure 8A). The signal to background was 3.8, signal to noise was 85.6, and the signal window was 14.2. A histogram representation of the NIH library screen for a subset of compounds is shown in Figure 8B and 8C. Results show that the assay and screen are behaving in a manner that is typical for a high-throughput screen. For inhibitors of the reaction, a hit cutoff of ≥ 45% activity compared to the controls was chosen and an F-Ratio between 0.5 and 1.5 was applied to filter compounds that exhibit optical interference. F-ratio is defined as normalized fluorescence (F) in a plate well with a compound compared to control wells. It is calculated as a ratio of total fluorescence for FP assays, and in our screen, using a fluorescence of the reference channel in TR-FRET assay system. The measure of F-Ratio helped remove compounds that optically interfere with the assay result, yielding a hit rate of 0.47%. Thus, in contrast to the SBMRI library screen where F-ratio was not applied, the hit rate was lower. NIH library-derived hits were reordered from the NIH Small Molecule Repository and were retested to confirm their activity. Approximately 87% confirmed upon repeat testing, for an overall confirmed hit rate of 0.37%. Chemical hits were then tested in an alternate counter-screen TR-FRET assay employing Bfl-1. The final hit rate after reconfirming and counter-screening with the Bfl-1 assay was 0.089%.
Figure 8. NIH chemical library HTS screen data.

(A) Shown are Z' values per plate from the primary HTS assay performed in a 1536-well format using the NIH small molecule library [N ≈ 330,000 compounds]. The x-axis represents the assay plate number vs. the y-axis showing the Z'. The average Z' factor observed was 0.78. (B) The primary HTS screen is represented in Histogram format. The x-axis represents % activity vs. the y-axis, which corresponds to the number of compounds. For inhibitors, a hit cutoff of >= 45 % activity (compared to the controls) was chosen, representing two standard deviations from the mean. (C) The primary HTS screen is also represented in Scatterplot format. The x-axis represents SourcePlate ID (each plate representing a subset of chemical compounds) vs the y-axis, which corresponds to the % Activity. For inhibitors, a hit cutoff of ≥ 45 % activity (compared to the controls) was chosen, representing two standard deviations from the mean.
DISCUSSION
Components of the cellular ubiquitination machinery are critical regulators of many biological processes of medical importance, thus making them of interest as targets for drug discovery. Previous efforts to develop HTS assays that address the ubiquitin system have resulted in several successful assay formats for monitoring in vitro ubiquitination reactions 31. Typically, these alternative methods have measured the addition of ubiquitin to a substrate protein, detecting either the presence of the ubiquitin conjugate or monitoring the formation of a polyubiquitin chain in the presence of an E3 ligase 31. For example, TRAF6 ubiquitination was studied using a mixture of ubiquitin conjugated with europium chelate or biotin in a reconstituted ubiquitination reaction mixture containing E1, E2 and ATP. FRET was observed upon addition of streptavidin-linked to the fluorescence acceptor, allophycocyanin (APC) 15. Another example is a dissociation-enhanced lanthanide fluoroimmunoassay, a heterogeneous methodology developed for studying ubiquitination of a HECT E3 ligase, Rsc 2. This procedure involved transfer of biotin-Ub from an E2 (UBC4) to GST-Rsc followed by immobilization of biotin-Ub-Rsc-GST to streptavidin-coated plates. Anti-GST europium antibody was then added, followed by washing, and measurement of fluorescence signal. Here we describe an in vitro method for measuring the activity of E2-mediated polyubiquitination that is independent of the presence of an E3, using complementary FRET donor/acceptor pairs of ubiquitin, which are incorporated into polyubiquitin chains. The TR-FRET method described is homogenous, without requirement for washing steps, and utilizes all components in solution phase, thus avoiding the disadvantages inherent in mixed phase (solid-phase/solution-phase) reactions commonly used to detect ubiquitin conjugates in other forms of in vitro assays. Our TR-FRET-based assay method was implemented for HTS in 384- and 1536-well format, demonstrating its robust performance, with acceptable Z' scores. The reaction method was demonstrated for UBC13, an ubiquitin conjugating enzyme that we empirically determined is capable of catalyzing polyubiquitin chain formation in the absence of an E3 ligase, provided cofactors UEV1A or MMS2 are present. The TR-FRET assay method described therefore should be extendable to essentially any E2, if the activity of that UBC is sufficient to generate an adequate signal above background – a criterion that may require supplying reactions with an E3 ligase that stimulates the UBC's activity.
While the TR-FRET assay for UBC13 described here did not require an accompanying E3 ligase (such as a TRAF protein) for achieving performance characteristics suitable for HTS, it is possible that addition of an appropriate E3 ligase would stimulate the catalytic activity of UBC13 and further improve signal:noise ratio. Production of well-folded recombinant full-length TRAF proteins in high yield however has not been trivial, though fragments of TRAFs lacking either the E2-binding RING domain or containing only the RING domain have been produced 20; 22; 42. Regardless, the E3-independent activity of UBC13 is consistent with prior models suggesting that some E2s can catalyze multiubiquitin chain preassembly prior to E3-mediated transfer of that multiubiquitin chain to a substrate 17; 23; 25; 38.
Because of the multi-component nature of our TR-FRET reactions, it will be necessary to deconvolute the target of compound hits obtained from HTS. In this regard, the compounds could target the E1 in these reactions, UBC13, or the cofactor (UEV1A or MMS2). Methods for excluding compounds that attack the E1 could include counter-screens using the same E1 in TR-FRET reactions with a different unrelated E2. For distinguishing compounds that bind the E1, UBC13, or co-factors UEV1A and MMS2, we routinely employ micro-isothermal titration calorimetry (μITC) or we use either 1D-NMR (measuring the compound's 1H spectrum in the presence versus absence of protein) or 2D-NMR (using 15N uniformly labeled UBC13 and measuring chemical shifts caused by addition of compounds). Also of note, because of the nucleophilic attack on ubiquitin substrate by the active site cysteine in both the E1 and E2, compounds with redox-active properties and electrophilic compounds such as Michael acceptors are prone to score as hits. The redox modulators can be eliminated by comparing the activity of compounds using the TR-FRET assay in the presence and absence of a reducing agent such as dithiothreitol (DTT). Alternatively, counter-screening with an unrelated cysteine-dependent enzyme would permit this distinction 30.
NMR and x-ray crystallography studies have revealed the structures of UBC13, its catalytic site, and its interface with obligatory co-factor proteins 10; 18; 21; 35; 46. These structural studies of UBC13-UEV1A complexes show a deep, narrow and long hydrophobic binding pocket at the interface of UBC13-UEV1A 46. UBC13 therefore has two potential sites of attack by small molecules – the active site and the cofactor-binding site. Thus, compounds identified by the TR-FRET assay described here could bind UBC13 at either the catalytic site or at the UEV1A interaction site. Achieving selective inhibitors of UBC13 by targeting the active site of the enzyme may be challenging, because of the overall conserved features of the active sites of many UBC-family enzymes. Nevertheless, exploiting compound interactions with regions adjacent to the active site as an approach for achieving selectivity has been successfully applied to many other classes of enzyme families. The unique binding pocket involved in obligatory association with cofactors UEV1A or MMS2 has the advantage of selectivity for UBC13. However, it suffers the challenge of all protein-protein interaction targets, in as much as the inter-molecular interactions are spread over a relatively large surface area. Nevertheless, these structural studies of UBC13 and UBC13-UEV1A complex lay the foundation for potential rational design of small molecule inhibitors, the activity of which could be then tested using a novel TR-FRET assay. Hence, the TR-FRET methodology described here could be applied either for HTS for identification of chemical inhibitors from libraries or used to profile compounds derived by in silico docking or structure-based rational design.
METHODS
Plasmids and reagents
The cDNAs encoding human UBC13, UEV1A, and MMS2 were amplified and subcloned into pET vectors for expression of proteins. Human ubiquitin activating enzyme (E1) was obtained from Boston Biochemicals. Terbiumubiquitin and fluorescein-ubiquitin were purchased from Invitrogen. Stock solutions of ubiquitination reagents were prepared in 50 mM HEPES (pH 7.5).
Protein expression and purification of ubiquitin conjugating enzymes
Plasmids containing UBC13, UEV1A, and MMS2 were expressed in BL21/DE3 E. coli cells. Cells were grown at 37°C to exponential phase (O.D ~ 0.6) and induced with 0.4 mM IPTG (Bio Vectra). Briefly, cells were resuspended in lysis buffer consisting of 1 mM Tris (pH 8.0), 1 mM DTT, 0.2 mg/mL lysozyme and protease inhibitors (Roche). Lysates were incubated with Ni+-NTA agarose (Qiagen) previously prepared with washing buffer consisting of 1 mM Tris (pH 8.0) and 1 mM DTT. His-tagged proteins were eluted with imidazole (Sigma) under linear gradient conditions followed by FPLC purification (Pharmacia BioTech) on a MonoQ column using high-salt gradient conditions (1 M NaCl). Proteins of > 90% purity were obtained. Further purification of proteins was obtained by size-exclusion chromatography on a Superdex 200 column. Representative Coomasie-stained 15% SDS-PAGE gel images of purified His-UBC13 (~ 17 kDa), His-MMS2 (~ 19 kDa) and His-UEV1A (~ 26 kDa) are shown in supplemental figure S1. Elution profiles from gel filtration analyses of His-UBC13 and His-UBC13-His-UEV1A heterodimeric complex are also shown in supplemental figure S1.
TR-FRET-based ubiquitination assay methodology
Ubiquitin chain assembly mediated by UBC13-UEV1A complex was monitored based on the principle of TR-FRET. An equimolar ratio of UBC13 and UEV1A (or UBC13 and MMS2) was prepared in 50 mM HEPES (pH 7.5) buffer and incubated for about 2 hr on ice to afford the UBC13-UEV1A or UBC13-MMS2 heterodimeric complex, which was confirmed by size-exclusion chromatography using Superdex 200. Ubiquitination reactions were performed in black 384-well round bottom plates (Corning® 3676). The reaction buffer consisted of 50 mM HEPES (pH 7.5)/0.005% Empigen BB detergent/0.1 mM DTT/1% DMSO. Stock solutions of ubiquitin, E1, UBC13-UEV1A or UBC13-MMS2 complex, and Mg-ATP were prepared in 50 mM HEPES (pH 7.5). Complete ubiquitination reaction mixture consisting of ubiquitin-activating enzyme (E1, 12.5 nM), UBC13-UEV1A (E2, 250 nM each), terbium-labeled ubiquitin (10 nM), fluorescein-labeled ubiquitin (150 nM), and Mg-ATP regenerating system (consisting of 1 mM ATP, and 1.25 mM MgCl2) were sequentially added along with buffer components to a 384-well plate. Control reaction mixtures included either terbium-Ub + fluorescein-Ub or terbium-Ub + fluorescein-Ub + Mg-ATP or reaction mixture lacking UBC13-UEV1A complex in it. The reaction plate was incubated at 37°C or RT and TR-FRET readings at regular time intervals (1, 3, and 5 hr etc.) on Analyst® instrument (Molecular Devices). TR-FRET measurements were taken by setting 360/480 nm filter for recording terbium emission, 360/520 nm filter for fluorescein emission, and using a 50:50 dichroic beamsplitter. A graphical analysis was generated by plotting the ratio of emission intensities of the acceptor and donor fluorophores (Emission ratio 520 nm/480 nm) for each set of reaction mixtures. Data are represented as mean±SEM. The assay was optimized for UBC13-UEV1A concentration, Fl-Ub:Tb-Ub ratio, substrate concentration, reaction buffer, reaction time and temperature. With regards to chemical inhibitors, data were represented in a graphical format with concentration of the inhibitors on the x-axis and emission ratio on the y-axis from which IC50s were determined for chemical inhibitors.
Gel-based Fluorimager analysis of ubiquitination reactions
Aliquots of samples from TR-FRET analysis were analyzed for ubiquitination on 15% Tris-glycine gels. Gels were scanned with a FLA 5100 scanner (Fujifilm®) and analyzed with Multiguage imager 3.0 software. For fluorescence assessment, gels were scanned using a LPB filter at 473 nm. Ubiquitinated protein was identified either as a smear or as series of discrete bands of increasing molecular weight in SDS-PAGE gels.
Monitoring ubiquitin chains catalyzed by UBC13
The catalytic role of UBC13 on the synthesis of ubiquitin chain built-up on UBC13-UEV1A or UBC13-MMS2 complex was studied by TR-FRET analysis and confirmed by gel-based Fluorimager analysis. Ubiquitination reactions were performed as described above except that heterodimeric complex of UBC13-UEV1A or UBC13-MMS2 was prepared in varying molar ratios of UBC13 (250 nM) and UEV1A (0-500 nM) or MMS2 (0-500 nM). The molar ratios of UBC13: UEV1A and UBC13: MMS2 in our experiments were 1:0, 1:0.2, 1:0.4, 1:0.6, 1:0.8, 1:1, and 1:2. Optimal molar stoichiometry of UBC13-UEV1A or UBC13-MMS2 was determined based on TR-FRET signal generated and ubiquitin chain formation observed in fluorimager analyses.
Linkage specificity of ubiquitination reactions mediated by UBC13-UEV1A complex
Ubiquitin chains formed in the presence of UBC13-UEV1A were studied for type of chain linkage using NanoLC-LTQ mass spectrometry-based proteomics strategy. The NanoLC-LTQ mass spectrometry-based proteomics approach involved the following steps (a) In-gel digestion. Ubiquitinated E1 and UBC13-UEV1A proteins were analyzed after SDS-PAGE and Coomassie blue staining. Bands were cut and gel slices incubated with 0.25 ng/μL trypsin at 37 °C overnight. Samples were cleaved and concentrated by C18 ziptip and resuspended in Nano LC/MS/MS loading buffer A. (b) NanoLC- LTQ MS Analysis. The automated NanoLC-LTQ MS setup consisted of an Eksigent Nano 2D LC system, a switch valve, a C18 trap column (Agilent, Santa Clara, CA), and a capillary reversed phased column (10 cm in length, 75 mm id) packed with 5 mm, C18 AQUASIL resin with an integral spray tip (Picofrit, 15 mm tip, New Objective, Woburn, MA). A reverse phase LC directly coupled to a LTQ mass spectrometer (Thermo Electron, Waltham, MA) was performed using linear gradient elution from buffer A (H2O plus 0.1% formic acid) to 15% buffer A plus 85% buffer B (ACN plus 0.1% formic acid) in 45 min. The LC/MS run was operated in the data dependent mode. Data on the four strongest ions above an intensity of 50×10e4 were collected with dynamic exclusion enabled and the collision energy set at 35%. (c) Protein database searching and data analysis. The MS/MS spectra were analyzed by Sorcerer2 system with SEQUEST (v.27, rev. 11) as the search program for protein identification. SEQUEST was set up to search the target-decoy ipi.HUMAN.v3.22 database containing protein sequences using semi-trypsin as the digestion enzyme with the allowance of up to 2 missed cleavages. The mass tolerances of a fragment ion and a parent ion were set as 0.5 and 1.0 Da, respectively. A molecular mass of 57 Da was added to all cysteines to account for carboxyamidomethylation in case of alkylation of cysteines. Differential search includes 16 Da for methionine oxidation and lysine ubiquitination with GG tag (114Da) to reflect the mass difference between ubiquitinated and un-ubiquitinated peptides. The search results were viewed, sorted, filtered, and statistically analyzed by using comprehensive proteomics data analysis software, Peptide/Protein prophet (ISB). The relative abundance of each identified protein in each sample was calculated by in-house developed QTools automated differential peptide/protein spectral counting software.
HTS implementation of UBC13 assay: LOPAC library screen
Optimization of the TR-FRET assay for HTS (as reflected by Z' score). The `screening window coefficient', termed Z' factor, was determined for assessing the reliability and reproducibility of the UBC13/UEV1A assay in 384-well format (or 1536-well format as required). The Z' score was calculated for the complete reaction mixture and this factor was compared to a reaction lacking UBC13-UEV1A complex in the mixture 45. Each well contained 20 μL of solution comprised of complete reaction mixture with or without UBC13-UEV1A. Initially, a pilot screen was conducted employing a library of pharmacologically active compounds (LOPAC). Compounds were dispensed at a final concentration of 10 μM into 384-well assay plates. Afterwards ubiquitination reaction mixture consisting of Tb-Ub, Fl-Ub, E1, UBC13-UEV1A complex, and ATP was added. The final concentrations of the assay components were: 12.5 nM E1, 250 nM Ubc13, 250 nM Uev1a, 150 nM Fl-Ub, 10 nM Tb-Ub, 1 mM ATP, 1.25 mM MgCl2 in 50 mM HEPES buffer (pH 7.5). Positive and negative controls in the experiments included wells with complete reaction mixture and reaction mixture with no UBC13-UEV1A. Plates were read after incubating for 1 and 3 hrs using Analyst® (Molecular Devices). LOPAC primary screen data were formatted as a histogram. The cut-off for hits was set at 50% of maximum average signal (IC50 values). Data were represented in a graphical format with log inhibitor (μM) on the x-axis versus TR-FRET ratiometric readings on the y-axis. Analysis was performed using GraphPad PRISM v. 5.0 by non-linear regression analysis using least-squares fit method from which IC50 values were determined.
Automated large-scale library screening
Automated large chemical library screens were conducted in both 384- and 1536-well formats. In the addition to the LOPAC library, the Sanford-Burnham chemical library (consisting of ~ 125,000 chemical compound library) was also screened in 384-well format following the optimized TR-FRET HTS protocol. The HTS assay optimized to operate in 1536-well format was also implemented to screen the NIH chemical library (consisting of ~ 330,000 chemical compound library). The final concentrations of the assay components employed for the 384 well HTS assay were: 12.5 nM E1, 250 nM Ubc13, 250 nM Uev1a, 150 nM Fl-Ub, 10 nM Tb-Ub, 1 mM ATP and 1.25 mM MgCl2, in 50 mM HEPES buffer (pH 7.5). The final concentrations of the assay components for the 1536 well HTS assay were: 100 nM E1, 125 nM Ubc13, 125 nM Uev1a, 75 nM Fl-Ub, 6 nM Tb-Ub, 1 mM ATP and 1.25 mM MgCl2, in 50 mM HEPES buffer (pH 7.5).
Supplementary Material
ACKNOWLEDGMENTS
We thank Drs. Thomas Chung and Chris Hassig for project management, Dr. Khatereh Motamedchaboki for mass spectrometry; Tessa Siegfried and Melanie Hanaii for manuscript preparation. This work was supported by post-doctoral fellowship and research fellow awards to C.M. from The National Multiple Sclerosis Society (FG-1760-A-1) and Multiple Myeloma Research Foundation, respectively, and by NIH grants R03 MH085677 and U54 HG005033.
Footnotes
AUTHOR CONTRIBUTIONS C.M. designed, performed, interpreted experiments and drafted the manuscript; K.W. performed initial protein purification studies; M.C. worked on cloning some constructs; S.V performed data analysis for LOPAC library; P.G. participated in protein purification and discussions pertaining to structural studies; I.P. designed and optimized the assay for Sanford-Burnham internal chemical library screen, T.N. performed Sanford-Burnham internal chemical library screen; E.S collaborated on experiments and offered suggestions regarding the assay; P.D. performed LOPAC library robotic titrations in 384-well plates. S-I M contributed and offered suggestions regarding cloning the constructs and designing in vitro ubiquitination assays and J.C.R. conceived of the assay, designed experiments, interpreted data, and edited the manuscript.
REFERENCES
- 1.Abbott DW, Yang Y, Hutti JE, Madhavarapu S, Kelliher MA, Cantley LC. Coordinated regulation of Toll-like receptor and NOD2 signaling by K63-linked polyubiquitin chains. Mol Cell Biol. 2007;27:6012–6025. doi: 10.1128/MCB.00270-07. [DOI] [PMC free article] [PubMed] [Google Scholar]
- 2.Boisclair MD, McClure C, Josiah S, Glass S, Bottomley S, Kamerkar S, Hemmila I. Development of a ubiquitin transfer assay for high throughput screening by fluorescence resonance energy transfer. J Biomol Screen. 2000;5:319–328. doi: 10.1177/108705710000500503. [DOI] [PubMed] [Google Scholar]
- 3.Carlson CB, Horton RA, Vogel KW. A Toolbox Approach to High-Throughput TR-FRET-Based SUMOylation and DeSUMOylation Assays. Assay Drug Dev Technol. 2009 doi: 10.1089/adt.2008.0188. [DOI] [PubMed] [Google Scholar]
- 4.Chau V, Tobias JW, Bachmair A, Marriott D, Ecker DJ, Gonda DK, Varshavsky A. A multiubiquitin chain is confined to specific lysine in a targeted short-lived protein. Science. 1989;243:1576–1583. doi: 10.1126/science.2538923. [DOI] [PubMed] [Google Scholar]
- 5.Cuervo AM, Stefanis L, Fredenburg R, Lansbury PT, Sulzer D. Impaired degradation of mutant alpha-synuclein by chaperone-mediated autophagy. Science. 2004;305:1292–1295. doi: 10.1126/science.1101738. [DOI] [PubMed] [Google Scholar]
- 6.Deng L, Wang C, Spencer E, Yang L, Braun A, You J, Slaughter C, Pickart C, Chen ZJ. Activation of the IkB kinase complex TRAF6 requires a dimeric ubiquitin conjugating enzyme complex and a unique polyubiquitin chain. Cell. 2000;103:351–361. doi: 10.1016/s0092-8674(00)00126-4. [DOI] [PubMed] [Google Scholar]
- 7.Ea CK, Sun L, Inoue J, Chen ZJ. TIFA activates IkappaB kinase (IKK) by promoting oligomerization and ubiquitination of TRAF6. Proc Natl Acad Sci U S A. 2004;101:15318–15323. doi: 10.1073/pnas.0404132101. [DOI] [PMC free article] [PubMed] [Google Scholar]
- 8.Fukushima T, Matsuzawa S, Kress CL, Bruey JM, Krajewska M, Lefebvre S, Zapata JM, Ronai Z, Reed JC. Ubiquitin-conjugating enzyme Ubc13 is a critical component of TNF receptor-associated factor (TRAF)-mediated inflammatory responses. Proc Natl Acad Sci U S A. 2007;104:6371–6376. doi: 10.1073/pnas.0700548104. [DOI] [PMC free article] [PubMed] [Google Scholar]
- 9.Goldberg AL. Protein degradation and protection against misfolded or damaged proteins. Nature. 2003;426:895–899. doi: 10.1038/nature02263. [DOI] [PubMed] [Google Scholar]
- 10.Hau DD, Lewis MJ, Saltibus LF, Pastushok L, Xiao W, Spyracopoulos L. Structure and interactions of the ubiquitin-conjugating enzyme variant human uev1a: implications for enzymatic synthesis of polyubiquitin chains(,) Biochemistry. 2006;45:9866–9877. doi: 10.1021/bi060631r. [DOI] [PubMed] [Google Scholar]
- 11.Hershko A, Ciechanover A. Mechanisms of intracellular protein breakdown. Annu Rev Biochem. 1982;51:335–364. doi: 10.1146/annurev.bi.51.070182.002003. [DOI] [PubMed] [Google Scholar]
- 12.Hershko A, Ciechanover A, Varshavsky A. The ubiquitin system. Nature Med. 2000;6:iii–xi. doi: 10.1038/80384. [DOI] [PubMed] [Google Scholar]
- 13.Hicke L, Riezman H. Ubiquitination of a yeast plasma membrane receptor signals its ligand-stimulated endocytosis. Cell. 1996;84:277–287. doi: 10.1016/s0092-8674(00)80982-4. [DOI] [PubMed] [Google Scholar]
- 14.Hofmann RM, Pickart CM. Noncanonical MMS2-encoded ubiquitin-conjugating enzyme functions in assembly of novel polyubiquitin chains for DNA repair. Cell. 1999;96:645–653. doi: 10.1016/s0092-8674(00)80575-9. [DOI] [PubMed] [Google Scholar]
- 15.Hong CA, Swearingen E, Mallari R, Gao X, Cao Z, North A, Young SW, Huang SG. Development of a high throughput time-resolved fluorescence resonance energy transfer assay for TRAF6 ubiquitin polymerization. Assay Drug Dev Technol. 2003;1:175–180. doi: 10.1089/154065803321537890. [DOI] [PubMed] [Google Scholar]
- 16.Jentsch S, Pyrowolakis G. Ubiquitin and its kin: how close are the family ties? Trends in Cell Biology. 2000;10:335–342. doi: 10.1016/s0962-8924(00)01785-2. [DOI] [PubMed] [Google Scholar]
- 17.Li W, Tu D, Brunger A, Ye Y. A ubiquitin ligase transfers preformed polyubiquitin chains from a conjugating enzyme to a substrate. Nature. 2007;446:333. doi: 10.1038/nature05542. [DOI] [PubMed] [Google Scholar]
- 18.McKenna S, Moraes T, Pastushok L, Ptak C, Xiao W, Spyracopoulos L, Ellison MJ. An NMR-based model of the ubiquitin-bound human ubiquitin conjugation complex Mms2.Ubc13. The structural basis for lysine 63 chain catalysis. J Biol Chem. 2003;278:13151–13158. doi: 10.1074/jbc.M212353200. [DOI] [PubMed] [Google Scholar]
- 19.McKenna S, Spyracopoulos L, Moraes T, Pastushok L, Ptak C, Xiao W, Ellison MJ. Noncovalent interaction between ubiquitin and the human DNA repair protein Mms2 is required for Ubc13-mediated polyubiquitination. J Biol Chem. 2001;276:40120–40126. doi: 10.1074/jbc.M102858200. [DOI] [PubMed] [Google Scholar]
- 20.Mercier P, Lewis MJ, Hau DD, Saltibus LF, Xiao W, Spyracopoulos L. Structure, interactions, and dynamics of the RING domain from human TRAF6. Protein Sci. 2007;16:602–614. doi: 10.1110/ps.062358007. [DOI] [PMC free article] [PubMed] [Google Scholar]
- 21.Moraes TF, Edwards RA, McKenna S, Pastushok L, Xiao W, Glover JN, Ellison MJ. Crystal structure of the human ubiquitin conjugating enzyme complex, hMms2-hUbc13. Nat Struct Biol. 2001;8:669–673. doi: 10.1038/90373. [DOI] [PubMed] [Google Scholar]
- 22.Ni CZ, Welsh K, Zheng J, Havert M, Reed JC, Ely KR. Crystallization and preliminary X-ray analysis of the TRAF domain of TRAF3. Acta Crystallogr D Biol Crystallogr. 2002;58:1340–1342. doi: 10.1107/s0907444902008958. [DOI] [PubMed] [Google Scholar]
- 23.Petroski MD, Zhou X, Dong G, Daniel-Issakani S, Payan DG, Huang J. Substrate modification with lysine 63-linked ubiquitin chains through the UBC13-UEV1A ubiquitin-conjugating enzyme. J Biol Chem. 2007;282:29936–29945. doi: 10.1074/jbc.M703911200. [DOI] [PubMed] [Google Scholar]
- 24.Plafker SM, Macara IG. Importin-11, a nuclear import receptor for the ubiquitin-conjugating enzyme, UbcM2. EMBO J. 2000;19:5502–5513. doi: 10.1093/emboj/19.20.5502. [DOI] [PMC free article] [PubMed] [Google Scholar]
- 25.Ravid T, Hochstrasser M. Autoregulation of an E2 enzyme by ubiquitin-chain assembly on its catalytic residue. Nature Cell Biology. 2007;9:422. doi: 10.1038/ncb1558. [DOI] [PubMed] [Google Scholar]
- 26.Scheper J, Guerra-Rebollo M, Sanclimens G, Moure A, Masip I, Gonzalez-Ruiz D, Rubio N, Crosas B, Meca-Cortes O, Loukili N, Plans V, Morreale A, Blanco J, Ortiz AR, Messeguer A, Thomson TM. Protein-protein interaction antagonists as novel inhibitors of non-canonical polyubiquitylation. PLoS One. 2010;5:e11403. doi: 10.1371/journal.pone.0011403. [DOI] [PMC free article] [PubMed] [Google Scholar]
- 27.Schwartz AL, Ciechanover A. The ubiquitin-proteasome pathway and pathogenesis of human diseases. Annu Rev Med. 1999;50:57–74. doi: 10.1146/annurev.med.50.1.57. [DOI] [PubMed] [Google Scholar]
- 28.Selvin PR, Hearst JE. Luminescence energy transfer using a terbium chelate: improvements on fluorescence energy transfer. Proc Natl Acad Sci U S A. 1994;91:10024–10028. doi: 10.1073/pnas.91.21.10024. [DOI] [PMC free article] [PubMed] [Google Scholar]
- 29.Shi CS, Kehrl JH. Tumor necrosis factor (TNF)-induced germinal center kinase-related (GCKR) and stress-activated protein kinase (SAPK) activation depends upon the E2/E3 complex Ubc13-Uev1A/TNF receptor-associated factor 2 (TRAF2) J Biol Chem. 2003;278:15429–15434. doi: 10.1074/jbc.M211796200. [DOI] [PubMed] [Google Scholar]
- 30.Shu CW, Drag M, Bekes M, Zhai D, Salvesen GS, Reed JC. Synthetic substrates for measuring activity of autophagy proteases: autophagins (Atg4) Autophagy. 2010;6:936–947. doi: 10.4161/auto.6.7.13075. [DOI] [PMC free article] [PubMed] [Google Scholar]
- 31.Sun Y. Overview of approaches for screening for ubiquitin ligase inhibitors. Methods Enzymol. 2005;399:654–663. doi: 10.1016/S0076-6879(05)99043-5. [DOI] [PubMed] [Google Scholar]
- 32.Thrower JS, Hoffman L, Rechsteiner M, Pickart CM. Recognition of the polyubiquitin proteolytic signal. EMBO J. 2000;19:94–102. doi: 10.1093/emboj/19.1.94. [DOI] [PMC free article] [PubMed] [Google Scholar]
- 33.Tsukamoto S, Takeuchi T, Rotinsulu H, Mangindaan RE, van Soest RW, Ukai K, Kobayashi H, Namikoshi M, Ohta T, Yokosawa H. Leucettamol A: a new inhibitor of Ubc13-Uev1A interaction isolated from a marine sponge, Leucetta aff. microrhaphis. Bioorg Med Chem Lett. 2008;18:6319–6320. doi: 10.1016/j.bmcl.2008.10.110. [DOI] [PubMed] [Google Scholar]
- 34.Ulrich HD, Jentsch S. Two RING finger proteins mediate cooperation between ubiquitin-conjugating enzymes in DNA repair. EMBO J. 2000;19:3388–3397. doi: 10.1093/emboj/19.13.3388. [DOI] [PMC free article] [PubMed] [Google Scholar]
- 35.VanDemark AP, Hofmann RM, Tsui C, Pickart CM, Wolberger C. Molecular insights into polyubiquitin chain assembly: crystal structure of the Mms2/Ubc13 heterodimer. Cell. 2001;105:711–720. doi: 10.1016/s0092-8674(01)00387-7. [DOI] [PubMed] [Google Scholar]
- 36.Varshavsky A. The ubiquitin system. Trends Biochem Sci. 1997;22:383–387. doi: 10.1016/s0968-0004(97)01122-5. [DOI] [PubMed] [Google Scholar]
- 37.Wang C, Deng L, Hong M, Akkaraju GR, Inoue J-I, Chen ZJ. TAK1 is a ubiquitin-dependent kinase of MKK and IKK. Nature. 2001;412:346–351. doi: 10.1038/35085597. [DOI] [PubMed] [Google Scholar]
- 38.Windheim M, Peggie M, Cohen P. Two different classes of E2 ubiquitin-conjugating enzymes are required for the mono-ubiquitination of proteins and elongation by polyubiquitin chains with a specific topology. Biochem J. 2008;409:723–729. doi: 10.1042/BJ20071338. [DOI] [PubMed] [Google Scholar]
- 39.Wooff J, Pastushok L, Hanna M, Fu Y, Xiao W. The TRAF6 RING finger domain mediates physical interaction with Ubc13. FEBS Lett. 2004;566:229–233. doi: 10.1016/j.febslet.2004.04.038. [DOI] [PubMed] [Google Scholar]
- 40.Yamamoto M, Okamoto T, Takeda K, Sato S, Sanjo H, Uematsu S, Saitoh T, Yamamoto N, Sakurai H, Ishii KJ, Yamaoka S, Kawai T, Matsuura Y, Takeuchi O, Akira S. Key function for the Ubc13 E2 ubiquitin-conjugating enzyme in immune receptor signaling. Nat Immunol. 2006;7:962–970. doi: 10.1038/ni1367. [DOI] [PubMed] [Google Scholar]
- 41.Yamamoto M, Sato S, Saitoh T, Sakurai H, Uematsu S, Kawai T, Ishii KJ, Takeuchi O, Akira S. Cutting Edge: Pivotal function of Ubc13 in thymocyte TCR signaling. J Immunol. 2006;177:7520–7524. doi: 10.4049/jimmunol.177.11.7520. [DOI] [PubMed] [Google Scholar]
- 42.Ye H, Cirilli M, Wu H. The use of construct variation and diffraction data analysis in the crystallization of the TRAF domain of human tumor necrosis factor receptor associated factor 6. Acta Crystallogr D Biol Crystallogr. 2002;58:1886–1888. doi: 10.1107/s0907444902013318. [DOI] [PubMed] [Google Scholar]
- 43.Yeh ETH, Gong L, Kamitani T. Ubiquitin-like proteins: new wines in new bottles. Gene. 2000;248:1–14. doi: 10.1016/s0378-1119(00)00139-6. [DOI] [PubMed] [Google Scholar]
- 44.Zapata JM, Reed JC. TRAF1: Lord without a RING. Science STKE. 2002;133:pe27. doi: 10.1126/stke.2002.133.pe27. [DOI] [PubMed] [Google Scholar]
- 45.Zhang JH, Chung TD, Oldenburg KR. A Simple Statistical Parameter for Use in Evaluation and Validation of High Throughput Screening Assays. J Biomol Screen. 1999;4:67–73. doi: 10.1177/108705719900400206. [DOI] [PubMed] [Google Scholar]
- 46.Zhang M, Windheim M, Roe SM, Peggie M, Cohen P, Prodromou C, Pearl LH. Chaperoned Ubiquitylation-Crystal Structures of the CHIP U Box E3 Ubiquitin Ligase and a CHIP-Ubc13-Uev1a Complex. Mol Cell. 2005;20:525–538. doi: 10.1016/j.molcel.2005.09.023. [DOI] [PubMed] [Google Scholar]
Associated Data
This section collects any data citations, data availability statements, or supplementary materials included in this article.