Abstract
The vertebral body is the main axial load-bearing structure of the spinal vertebra. Assessment of acute injury and chronic deformity of the vertebral body is difficult to assess accurately and quantitatively by simple visual inspection. We propose a cortical shell unwrapping method to examine the vertebral body for injury such as fractures and degenerative osteophytes. The spine is first segmented and partitioned into vertebrae. Then the cortical shell of the vertebral body is extracted using deformable dual-surface models. The cortical shell is then unwrapped onto a 2D map and the complex 3D detection problem is effectively converted to a pattern recognition problem on a 2D plane. Characteristic features adapted for different applications are computed and sent to a committee of support vector machines for classification. The system was evaluated on two applications, one for fracture detection on trauma CT datasets and the other on degenerative osteophyte assessment on sodium fluoride PET/CT. The fracture CAD achieved 93.6% sensitivity at 3.2 false positive per patient and the degenerative osteophyte CAD achieved 82% sensitivity at 4.7 false positive per patient.
1. Introduction
The vertebral column forms the central weight-bearing axis of the human body, and is composed of 33 vertebrae organized in five sections: cervical (7), thoracic (12), lumbar (5), sacrum (5 fused), and coccyx (4). The vertebral column provides for three main functions: 1) weight-bearing column support for the upper body and head; 2) protection of the spinal cord; and 3) allowance for trunk movement through multiarticulated flexibility. The complex anatomic structure of the vertebrae enables these functions. A typical vertebra is shown in Figure 1. It consists of a body, arch (pedicles and laminae), transverse processes, articular facets, and posterior spinous process.
Figure 1.
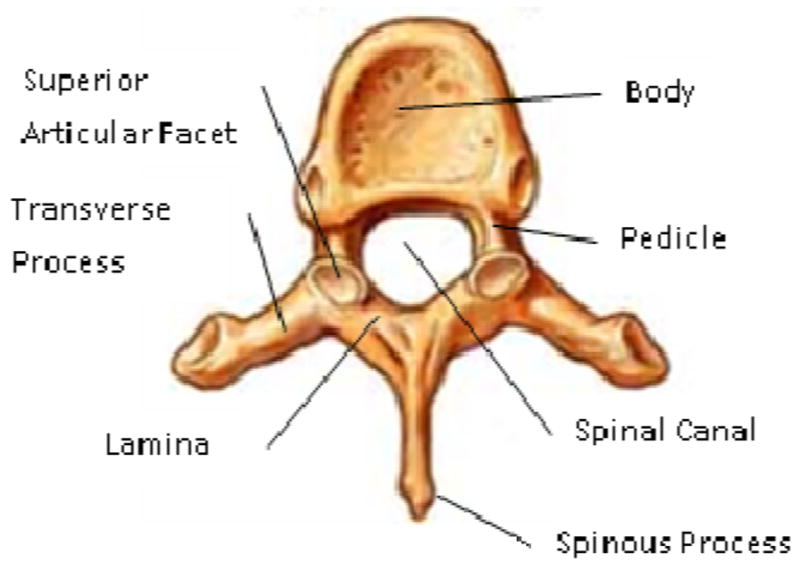
Vertebra Anatomy
The vertebral body shape may be estimated as cylindrical in a second order approximation. This approximate cylindrical geometry facilitates the vertebra’s function as the main axial load-bearing osseous structure of the body, and its integration with adjacent vertebrae through intervertebral discs for multiarticulated flexibility of the spine. Its cranial and caudal surfaces (superior and inferior endplates) are flattened and rough, and give attachment to the intervertebral disk, and each presents a rim around its circumference. Acute injury and chronic dysmorphic change of the vertebral body, such as cracks (fracture) and abnormal growth (degenerative osteophytes) could affect the overall function of a vertebra.
In this investigation, we focus on traumatic injury and degenerative osteophytes on the vertebral body. Traumatic injury of the spine is a subset of the spectrum of blunt trauma pathology and potentially devastating. Previous reports estimate the number of vertebral fractures each year in the United States at more than 140,000, with 19%–50% of fractures of the thoracolumbar spine associated with neurological injury [1]. Rapid and accurate assessment is essential for determination of an acceptable treatment plan, and delay in detection and management of spinal injuries can result in prolonged pain and suffering, or biomechanical disability. Degenerative disc disease (DDD) develops with degeneration of the nucleus pulposus of the intervertebral discs (IVD) of the spine. As the nucleus pulposus loses water, its volume, height and elasticity are reduced and the IVD loses its ability to stably support loads. Spinal osteophytes are abnormal bony outgrowths that form along the disc margins in response to degenerative changes in the IVD and the associated altered biomechanics between the vertebral bodies [2]. Osteophyte development at the intervertebral interspaces can progress to osseous bridging that fuses adjacent vertebrae and can otherwise inhibit normal spinal motion. Osteophytes become more prevalent in the spine with increasing age, and are found in 90% of population over 60 years old [3].
Multiple medical imaging modalities, such as radiographs, CT, MRI and PET, are used to evaluate spine anatomy and diagnose spinal pathology. Using current generation scanners, CT is the most spatially accurate modality to assess the three dimensional morphology of the vertebra. Computational techniques have been employed to assist in clinical image analysis, mostly focusing on image segmentation, registration and computer assisted intervention [4]. Algorithms have been developed to detect lytic [5] [6] and sclerotic [7] metastases in the thoracolumbar spine on CT images. Analysis of the complex structure of the spine on cross sectional CT images for direct visualization of fractures is a novel topic of clinical importance. There are prior works assessing for fractures based on the detection of global geometric deformities of the vertebral bodies (compression deformities), rather than direct detection of fracture lines in the vertebrae [8]. A height compass was proposed to analyze the morphological change of vertebral body due to compression fracturing [9]. A shape based method was developed to detect burst and compression fractures [10] and provide qualitative and quantitative feedback in order to determine the severity of the fracture. There have also been a few prior works targeting degenerative change and osteophytes. Tan et al [11] sought to quantitatively measure the status of ankylosing spondylitis via the segmentation of individual vertebrae with successive level set operations, followed by the segmentation of bony outgrowths (syndesmophytes) and quantification of their volume and height. Stanley et al [12] dealt directly with detection of osteophytosis in the spine using radiographs of the cervical spine to detect and classify types of anterior osteophytes. Finally, Herrmann and Geisler tracked the time variation of vertebral morphology between radiographs due to degenerative changes [13]. While these methods focus on osteophytes which are secondary indicators of DDD, other methods have focused directly on the IVD themselves. One method detected degenerating IVDs on MRI using 2D methods that analyzed disc intensity, location, and distance between discs [14]. A more recent approach segmented both the vertebral bodies and IVDs to detect degenerating IVDs in asymptomatic patients [15].
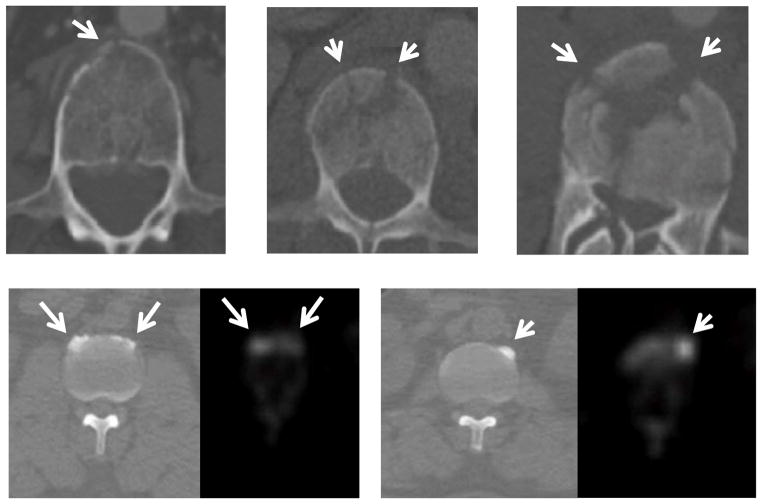
The focus of this investigation is the development of a fully automated system to assess vertebral body cortical shell abnormalities. Figure 2 shows examples of vertebral body fracturing and degenerative osteophytes on CT. Many of these abnormalities may be easily detected and given a brief qualitative assessment during clinical diagnostic interpretation of the studies by radiologists. However, given the growing time pressures and resource limitations of the health care environment, thorough and accurate quantitative assessment these abnormalities and with serial quantitative evaluation of disease progression may prove difficult. Our investigation intends to facilitate this effort. This paper is the extension of two of our previously published conference papers [16, 17], with expanded technical background and more detailed validation on a larger data set included in this journal version.
Figure 2. Examples of vertebral body fractures and degenerative osteophytes (arrows).
First row: vertebral body fracture on axial CT.
Second row: degenerative osteophytes on axis CT (left) and PET (right).
2. Methods
Our method is a supervised machine learning framework designed to train a computer system to recognize spinal pathology based on patterns labeled by radiologists. The framework is as followed (shown in Figure 3): The spinal column is first extracted and partitioned into vertebrae. The cortical shell of vertebral body is then segmented using deformable dual surface models. After that, the cortical shell is unwrapped onto a 2D plane. Pattern recognition techniques are then applied to detect abnormality on the unwrapped cortical shell. The detections are then re-projected back to 3D space and quantitative features are computed. At the end, the detections are passed to a committee of support vector machines for classification. The classifier is trained based on labeled data provided by radiologists. It has an offline training stage and an online testing stage.
Figure 3.

System flowchart
2.1. Spinal column segmentation
The spine is an osseous component of the body anatomy with higher X-ray CT attenuation units, or Hounsfield units (HU), than CT values of other tissue types. We apply a threshold of 200 HU to mask out the bone pixels. Then a connected component analysis is conducted on the bone mask and the largest connected component in the center of the image is retained as the initial spine segmentation. The bounding box of the initial segmentation is used as the search region for following segmentation tasks.
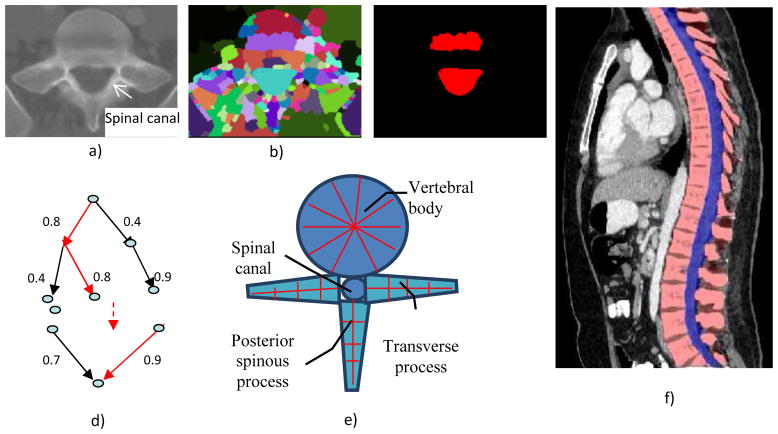
The spinal canal links all vertebrae into a column. On a transverse cross section, the spinal canal appears as a low intensity oval region surrounded by high density pedicle and lamina (Figure 4a). The extraction of the spinal canal is essential in accurately localizing the spine and forming the column. We apply a watershed algorithm [18] to detect the potential spinal canal regions, and then conduct a graph search to locate and extract the spinal canal.
Figure 4.
Spine segmentation
a) CT image; b) watershed result; c) spinal canal candidates d) directed acyclic graph (DAG), number on the edge is the weight between two nodes; e) vertebra template; and f) segmented spine, red: spine column, blue: spinal canal.
The principle of the watershed algorithm is to transform the gradient of a gray level image into a topographic surface. The algorithm punctures holes at the local minimum of the intensity and fills the region with “water,” in heuristic analogy to a ubiquitous physical process. Each region filling with water is called a catchment basin. The spinal canal resembles a catchment basin on a 2D cross sectional image. We adopted the watershed algorithm implementation in ITK [19].
The well-known over-segmentation problem of the watershed algorithm is alleviated by merging adjacent basins. Depth of a basin is defined in Equation 1.
| (1) |
where I(x) is the image intensity of a pixel x inside the basin b. Given a and b are two neighboring basins, they will be merged if both conditions in Equation 2 are satisfied
| (2) |
where N(a) denotes neighbors of basin a, and δm is the merging threshold. Next, all basins that meet the criteria in Equation 3 and are surrounded by bone pixels are recorded as potential candidates for the spinal canal.
| (3) |
where δd is the depth contrast threshold. Figure 4b shows the result of the watershed algorithm and the candidates for spinal canals.
As showed in Figure 4c, multiple canal candidates may exist in one slice due to partial volume effect or a low density vertebra body region such as lytic bone lesion. We propose a method to extract the spinal canal using directed graph search. We first build a directed acyclic graph (DAG) from the canal candidates. The DAG is illustrated in Figure 4d. The graph G(N, A) is a structure that consists of a set of nodes N and a set of directional edges E. A node is one canal candidate. A directional edge <n1, n2> connects two nodes n1 and n2 on adjacent slices, where the weight of <n1, n2> is computed as the overlap of n1 and n2, as in Equation 4.
| (4) |
An edge only exists when its weight is greater than 0 (two nodes overlap). DAG has sources on the first slice and sinks on the last slice. A directed graph searching algorithm [20] is applied to find the longest path from source to sink, which is the spinal canal in our case. In Figure 4d, the longest path is marked with red color. The centerline of the spinal canal is then computed, and fit using a Bernstein spline.
Vertebra segmentation is commonly implemented using geometric and statistical models owing to its articulated and complex structure [21–23]. The anatomical models capture the shape, topology, and interrelationship of vertebrae, and therefore convert the image segmentation problem to a model fitting problem. We proposed a four-part vertebral model to segment the vertebral region on a 2D slice. The model includes four main vertebra sub-structures: vertebral body, posterior spinous process, left transverse process and right transverse process (see Figure 4e). The vertebral body is modeled as a circle with a medial atom in the center and border atoms evenly distributed on the border. The spinous and transverse processes are modeled as slabs with a medial axis and a set of border atoms on each side. The model’s multiple-part structure simplifies the problem and makes the segmentation robust. Each model part is essentially a medial model [24]. The medial axis defines the skeleton, and the border atoms define the boundary.
The border of the medial model can be written as an implicit function,
| (5) |
A border atom Ai can then be represented in the local coordinate system, as Ai= (ui, vi) = (ui, f(ui)). In the disk model, u is the angle radian around the center and v is the distance to the center. In the slab model, u is the distance along the medial axis and v is the distance to the medial axis.
The segmentation task is to locate the border atoms so that a maximum model-to-image match can be reached. The matching metric should also preserve the model topology and border smoothness constraint. We design a metric for the model matching:
| (6) |
Here (ui, f(ui)) are the border atoms. The metric has four components: the directional gradient g⃑(ui, f(ui)) is to match the border atoms with the intensity edge of the image; ∇f(ui) and ∇2 f(ui) are smoothness constraints on the border; and, p(ui, f(ui)) is a penalty function to prevent intersecting between model parts. Weights wg, w1, w2 and wp are set empirically.
The extracted spinal canal defines the initial location and size of the vertebra model. The model matching proceeds sequentially. First the vertebral body is matched, followed by the spinous process, and at the end the transverse processes. The results of the previous steps are used to determine the initial location and size of the parts in the following steps. In our current model, we define 36 border atoms for the disk model and 20 atoms for the slab models. Figure 4f shows the segmented spine region.
2.2 Spinal column Partitioning
The spinal column consists of a set of vertebrae separated by inter-vertebral discs. Since the spinal column is a highly curved structure, the standard planar reformations (sagittal and coronal) do not provide clear views of the vertebral separation. Curved planar reformation (CPR) [25] is generally considered superior.
After the spinal column is segmented, we need to partition the spinal column into vertebrae at the intervertebral disc locations so that we can process the vertebrae separately and so localize the abnormality at the appropriate vertebra level. We developed a partitioning approach based on curved reformation along the spinal canal.
The centerline of the spinal canal is used as the central axis for the CPR. We generate the CPR in sagittal and coronal directions. Given that the vertices on the centerline are ( ), j=1..n, the curved reformation in the sagittal direction is written as
| (7) |
where ISag is the curved reformatted sagittal image, I3D is the original 3D image. (xi, yi) is the 2D coordinate in the reformatted image. Similarly, the curved reformation in the coronal direction is written as
| (8) |
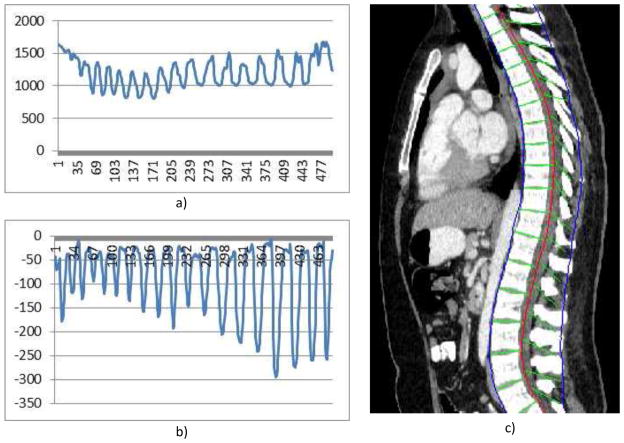
where ICor is the reformatted coronal image. Figure 5a shows the sagittal and coronal curved plane reformations.
Figure 5. Spine partitioning.
a) Aggregated intensity profile (AIP) along the spinal canal; b) adjusted AIP; and c) spine partitioning result.
To make use of the CPR for spinal column partitioning, the centerline of the spinal canal is first projected onto the reformatted images. Next, the normal is computed at every point on the centerline. The intensity along the normal direction is then aggregated and the profile is recorded. Figure 5a shows the aggregated intensity profile (AIP) along the spinal cord at the reformatted coronal view. As observed, the aggregated intensity at the disc location is lower than those at the vertebral body location. However, the separation is still not prominent, especially at the cervical spine and highly curved regions. We further convolute the aggregated intensity profile with an adaptive disk function, which can be written as,
| (9) |
The function is a rectangle function with adaptive width T. In order to determine T, we search the neighborhood in both directions for local maximum on the AIP. The adjusted AIP is shown in Figure 5b.
The intervertebral disk is then located at the lowest response point of the adjusted intensity profile and used to partition the spinal column. Figure 5c shows the spine partition superimposed on reformatted CPR views.
2.3 Vertebral body cortical shell segmentation
In this investigation, we focus on abnormalities on the vertebral body, particularly on its cortical shell. For instance, in a fractured vertebral body the cortical shell is often damaged with cracks, and in degenerative osteophyte case, abnormal bony outgrown occurs on the cortical shell. A precise delineation of the cortical shell is essential to detect subtle change such as hairline fractures.
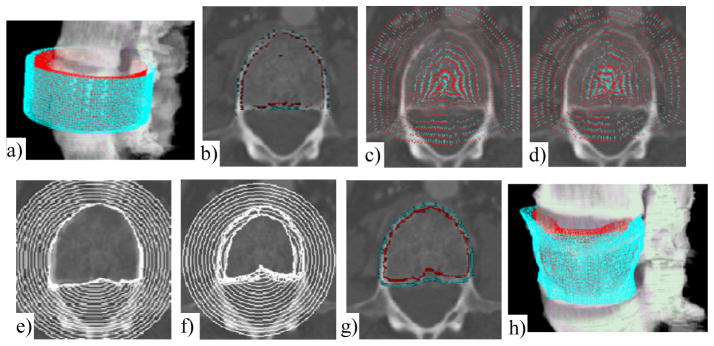
We propose a deformable dual-surface model to extract both the exterior and interior (periosteal and endosteal) surfaces of the cortical shell. A local cylindrical coordinate system is established for each vertebral body. A concentric cylinder is placed in the center of the vertebral body as the initial dual surface. The height is set as the distance between the superior and inferior partitioning planes obtained in the previous step and the radius is estimated as twice of the average width of the vertebral body bounding box (Figure 6a). The surface is constructed as a triangular mesh, where the vertices are evenly spaced. The surface can be represented as r =S(z, φ) in the cylindrical coordinate system, where z is the height along the axis, φ is the azimuth angle, and r is the radial distance. The initial interior surface (SI) has the radius three quarters of that of the initial exterior (SE) surface. The resolution of the surface mesh is set to be the same as the pixel size of the CT image.
Figure 6.
Cortical shell segmentation
The original image is in Figure 2a. a) Initial models; b) Potential boundary map (RE, RI), cyan: RE, red: RI; c) Potential force for exterior surface P(SE); d) Potential force for interior surface P(SI). Maps are down-sampled for clarity. Force direction points from red to cyan; e) Evolution of exterior surface; f) Evolution of interior surface; g) Results of dual-surface segmentation; and h) 3D visualization
The deformable dual-surfaces [26] are driven by the combination of internal forces, image potential forces, and constraints between the exterior and interior surfaces. The energy functional for the dual-surface is written as,
| (10) |
where SE and SI are exterior and interior surfaces, I(S) is the internal force, P(S) is the image potential force, C(SE,SI) is the constraint between the two surfaces, and wi, wp and wc are weights for the three forces. The internal forces keep the surface smooth and continuous, which can be written as,
| (11) |
The first order derivative discourages stretching and the second order derivative discourages bending of the surfaces. α and β are weights, and set to 1 in our method.
A directional gradient in the cylindrical coordinate system is applied to compute the potential image. For a point (z, φ, r) on the image, the directional gradient is computed as,
| (12) |
where G is the grayscale image. For every direction (cos φ, sin φ) defined by (z, φ) (at level z, angle φ), we search for the maximum of a pair of positive and negative directional gradients to be used as the potential boundary for exterior and interior surfaces, i.e.,
| (13) |
Here ∇G⃑+ and ∇G⃑− represent positive and negative directional gradient respectively, and ε1 and ε2 are the minimum and maximum cortical shell thickness. Due to the image noise and other anatomical structures near the vertebral body, (RE, RI) may get stuck at false edges. In order to eliminate outliers, we fit a Bezier function for RE over the domain of (z, φ). Those (RE, RI) pairs that are far away from the Bezier function are excluded. Figure 6b shows an example of (RE, RI) map superimposed on an image slice. The distance to the (RE, RI) map is then used to derive the potential force for the dual surfaces, which can be formulated as,
| (14) |
where || || is the Euclidean distance. Figures 6c and 6d show the potential forces P(SE) and P(SI).
The constraint between the dual surfaces is the thickness of the cortical shell. We assume that the thickness change should be continuous over the cortical shell, and use the following function for the thickness regulation,
| (15) |
The weights for different forces (wi, wp and wc) in Equation 10 are kept constant throughout the evolution. Since the potential force becomes smaller approaching the boundaries, the internal force and thickness constraint will play a bigger role upon convergence. Figures 6e and 6f show the evolution of the exterior and interior surfaces. Figures 6g and 6h show the final extracted cortical shell on one 2D slice and in 3D space.
2.4 Vertebral body unwrapping
Detecting abnormalities on the 3D dual surface is not a trivial task. In contrast, there are many investigations in the computer vision field that detect patterns on 2D images. Therefore, we propose an idea to unfold the 3D dual surface to a set of 2D feature maps and effectively convert the complex 3D detection problem into a 2D pattern recognition problem. The unwrapping of the cortical shell is based on the cylindrical coordinate system. We map the 3D cortical shell onto the 2D space defined by (z, φ). The unwrapping process can be written as,
| (16) |
where R( ) is the feature function to be projected. Multiple feature maps can be generated. For instance, the most basic feature function is the mean density of the cortical shell, where the unwrapping procedure can be written as,
| (17) |
here G is the image intensity value. Essentially, we project the mean intensity of the cortical shell onto a 2D map. The mapping is one-to-one: for any point on the unwrapped map, we can back-project to the 3D cortical shell. Other characteristic maps can also be generated through the unwrapping operation. The following is a list of maps currently generated in our system.
| (18) |
In a PET/CT case, the unwrapping transformation can be directly applied to the PET to obtain unwrapped PET images since the CT and PET are already registered.
| (19) |
Here I( ) is the CT value, and SUV() is the standardized uptake value from PET, which is normalized for dose and body mass. These characteristics maps give an overall picture of the cortical shell.
Figure 7a–b shows an example of the cortical shell mean intensity map for a normal vertebral body and a fractured vertebral body. The horizontal axis is φ and the vertical axis is z. Axis φ starts from the center of the spinal canal (detected in section 2.1) and spans 360°, and axis z goes from the inferior to the superior endplates.
Figure 7.
Cortical shell unwrapping and characteristic feature maps
Unwrapped density map for a normal vertebral body; b) Unwrapped density map for a fractured vertebral body, white dots indicate fracture sites; c) stacked mean CT density map, arrows point to degenerative osteophytes; d) stacked SUV max map from PET; e) stacked thickness map; and f) stacked radius map.
The characteristic feature maps for individual vertebrae can be seamlessly stacked to form a panoramic view of the entire spinal column. The maps are naturally aligned through the spinal canal. Figure 7c–7f show the stacked characteristic feature maps generated from CT and PET data for a patient with degenerative osteophytes.
2.5 Abnormality detection and classification
The cortical shell of a normal vertebral body should have relatively homogeneous intensity and thickness. As shown in Figure 7a, the normal vertebral body has homogeneous intensity map, while fractures and osteophytes show abnormal patterns (crack or high intensity strips). A computer system can be trained to detect these abnormal patterns. In the training phase, a radiologist manually marked the location of abnormalities on the CT data. The locations were then projected to the unwrapped map to train the abnormal patterns.
In a typical CAD system, a set of initial detections are first identified to significantly restrict the searching domain, then a supervised classifier is applied to differentiate true detections from false ones. The initial detection phase is often problem specific. In this system, we design different initial detection methods for the fracture and osteophyte problems.
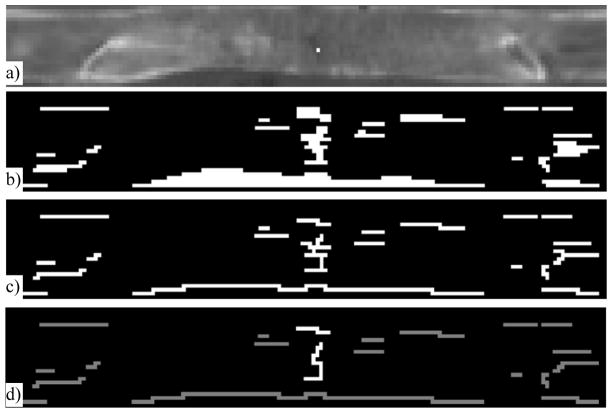
In the fracture detection system, fracture lines on the cortical shell appear as gaps or discontinuities on the mean density map (Figure 8). Detecting the fracture lines on the map is a relatively simple 2D pattern recognition problem compared to the complex 3D fracture detection problem. The problem is similar to road crack detection in computer vision applications [27]. We adopt a multi-scale adaptive filtering method to detect cracks on the map. Two assumptions are applied: 1) a crack is darker than the background (normal cortical shell); and 2) a crack is composed of a set of connected segments with different orientations and limited width. We define the crack filter as a rectangle function, that is,
Figure 8.
Fracture line detection on mean density map
a) Unwrapped mean density map (bright dot indicates the projected fracture site marked by an expert on original CT); and results after b) Adaptive filtering; c) Skeletonization; and d) Pruning (the bright line is the true fracture line).
| (20) |
where T is the width of the crack and also the scale of the filter. We convolve the mean density image U3(z, φ) with f(x) at different scales (by varying T) in multiple orientations ([0, π/4, π/2, 3π/4]). The outputs of all filters are merged and used as the initial detection for the fractured regions (Figure 8b). We then apply a Hilditch thinning algorithm [28] to skeletonize the fracture region (Figure 8c). After that, the branches on the skeleton are pruned [29] so that only the longest path remains, and is used as one potential fracture line (Figure 8d).
In the degenerative osteophyte detection system, an osteophyte site is defined as a span of osteophytes on a cross-section of a vertebra, which appears as a high density horizontal segment on the feature map. The detection process is as follows: 1) the initial seeds (zs, φs) are identified at the local maximum in a 7 × 1 window on the mean density map (U3); 2) the seeds are extended to horizontal segments; and 3) feature vectors are computed for each segment and used for classification. To extend a seed point (zs, φs) to a segment (L, R), where L=(zs, φL) and R=(zs, φR) are border points on each side, we first compute the background B(zs) at each cross section zs. The mean density of the lower 50% is used as the background. The border points are then located at the half maximum between the seed point density and background density. That is, φL is the largest φ where φ< φS and U3(zs, φ)<(U3(zs, φs)+B(zs))/2. Similarly, φR can be located. The segments (L,R) are then treated as potential osteophyte sites. For a site, a feature vector of ( ) is computed, where Ūl is the mean feature value on map i for points in the segment. One characteristic feature of degenerative change is that the osteophytes often form oblique longitudinal patterns across many vertebral bodies. We capture this feature by clustering of osteophyte sites based on their spatial connectivity, with each cluster treated as one initial osteophyte detection.
After the initial detections are obtained, we compute morphological, textural, physiological, and location features for each detection. The morphological features include height, width, and thickness. The textural features include mean and standard deviation of density, and the contrast between the detection and its neighborhood (both circumferential and radial neighbors). Location features include circumferential location, distance to pedicle, and distance to IVD. Additional detections within a limited range of circumferential locations (φ) about an initial detection are counted, with more occurrences within that range boosting the probability of the initial detection being a true detection. The features are listed in Table 1, and can be derived from the feature maps. If PET data is available, SUV features are also computed. We list the formula for a few features to demonstrate how features are derived. (f1: average width, f2: average thickness, f3: average density, and f4: average interior density),
Table 1.
Feature sets
| Category | Feature |
|---|---|
| Associated Vertebral body | vertebraLevel, vertebraHeight, vertebraRadius, avgCorticalIntensity, stdCorticalIntensity, avgTrabecularIntensity, stdTrabecularIntensity |
| Location | location, circumferencialAngle, relZLevel, orientation |
| Shape | length, avgWidth, stdWidth, avgThickness, stdThickness, area, aspectRatio |
| Intensity | avgIntensity, stdIntensity, borderIntensity, contrastBorderIntensity, avgInteriorIntensity, stdInteriorIntensity, contrastInteriorIntensity, avgOutsideIntensity, stdOutsideIntensity, contrastOutsideIntensity |
| PET features | avgSUV, maxSUV, avgInteriorSUV, maxInteriorSUV, avgOutsideSUV, maxOutsideSUV |
| (21) |
| (22) |
| (23) |
| (24) |
where ΩA is the set of points in the detection, ΩS is the skeleton of ΩA, and d is the width of each detection segment. The features are computed from both the 3D CT data and the unwrapped feature map.
A committee of support vector machines (SVM) [30] is trained to differentiate true positive from false positive detections. The training was based on a reference standard (fractures or degenerative osteophytes) marked by an expert. A forward stepwise feature selection procedure was conducted to form a seven-member committee. Each committee member had three characteristic features (features may overlap among committee members). Ten-fold cross validation and FROC curves were employed to evaluate the overall performance.
3. Results
Our system was tested on two applications, one for traumatic fracture detection, and one for degenerative osteophyte assessment.
3.1 Fracture detection
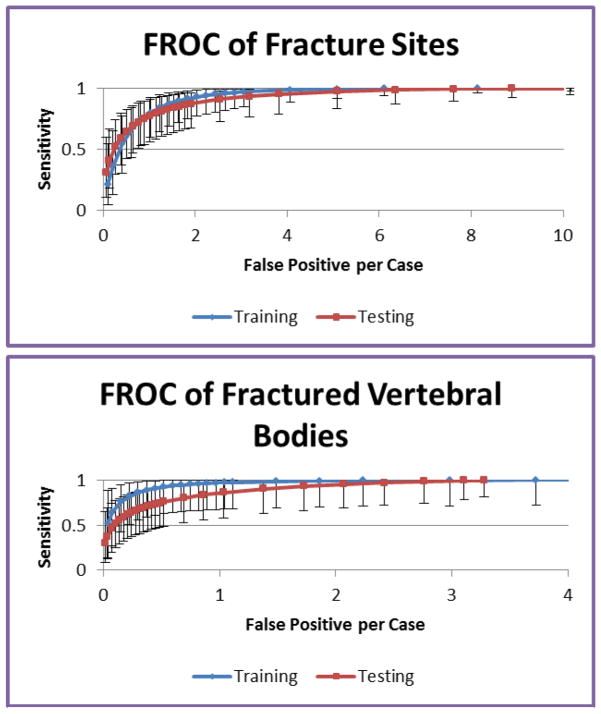
A CT spine trauma protocol data set obtained as a cohort of 40 trauma patients admitted to the University of California, Irvine Medical Center between June 2009 and July 2010. The mean patient age was 41±18 yrs (17–86yrs). There were 31 men and 9 women. All patients were scanned on a Siemens Sensation 64 scanner. The scanning parameters were: 2mm slice thickness, 120 kvp, and convolution kernel B40f (16 patients) or B60f (2 patients). The CT data covered most of the thoracic and lumbar spines, and included 14 vertebrae on average. 20 patients had acute vertebral body fractures identified by radiologists providing original diagnostic interpretation of the studies at the time of the trauma, and the remaining 20 patient studies had been given an interpretation stating there was no evidence of fracturing of the thoracic or lumbar vertebrae. An expert radiologist with 12 years of experience examined the cases and manually marked the vertebral fracture sites. The total number of spatially distinct fracture sites was 38, in 22 vertebrae. The training set included 20 patients (10 with fractures, 10 without fractures, 21 distinct fracture sites in 10 fractured vertebrae). The remaining data (20 patients, 10 with fractures, 10 without fractures, 17 fracture sites in 12 fractured vertebrae) was used as an independent test set. FROC analysis was conducted using ROCKIT (http://xray.bsd.uchicago.edu/krl/KRL_ROC/software_index6.htm). We evaluated both the per-fracture-site and per-vertebra performances. FROC curve is shown in Figure 9.
Figure 9.
FROC analysis for the fracture CAD
For per-fracture-site analysis, the sensitivity was 95.2% (95% CI: [81%, 99%]) at 2.4 false fracture sites per patient for the training data, and 93.6% (95% CI: [76%, 99%]) at 3.2 false fracture sites per patient for the test data. For per-vertebra analysis, the sensitivity was 96.7% (95% CI: [67%, 100%]) at 0.9 false fractured vertebrae per patient for the training data, and 93.5% (95% CI: [66%, 100%]) at 1.7 false fractured vertebrae per patient for the test data.
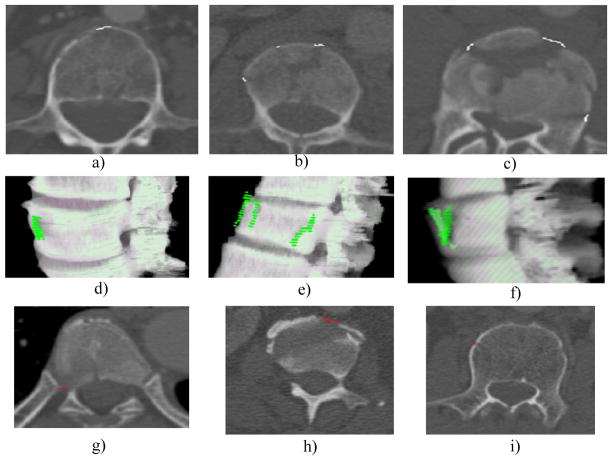
Figure 10 shows detections in the fracture CAD, including examples of true positive detections and false positive detections. The etiology of false positive detections includes costovertebral junctions (Fig. 10g), partial volume averaging of vertebral disks (Fig. 10h) and nutrient vessel foramina (Fig. 10i).
Figure 10. Detections in the fracture CAD.
a,b,c) true positive detections on 2D slice, white markers; d,e,f) same true positive detections on 3D surface, green markers; g) false positive, costovertebral junctions; h) false positive, partial volume averaging of vertebral disks; and i) false positive, nutrient vessel foramina.
3.2 Degenerative osteophyte evaluation
The degenerative disease dataset consisted of 46 18F-NaF PET/CT scans (36 men, 10 women, mean age 65±9 yrs). All patients were scanned on a Philips GEMINI TF scanner at the National Institutes of Health. The PET resolution was 4*4*4mm. The CT portion of the studies was performed with 5mm slice thickness and without intravenous contrast. The system was trained on 20 cases and tested on 26 cases. The performance was evaluated using FROC analysis.
The numbers of osteophytes larger than 5mm were 163 and 179 in the training and testing sets, respectively. The sensitivities and false positives per case (FPR) were 82.2% and 4.7, and 77.1% and 4.6 for the training and test sets respectively. The performance with CT and PET data alone were 69% (4.7) and 59% (4.4) respectively. We conducted the classification using all features, CT features only, and PET features only (Figure 11). We chose an operating point with over 80% sensitivity. In the training set, the sensitivities (FP rates) were 84% (3.8), 80% (7.3), and 80% (9.6) for all features, CT features, and PET features respectively. In the testing set, the sensitivities (FP rates) were 82% (4.7), 81% (8.0), and 79% (10.9) respectively. The performance differences between using all features and CT or PET features alone were statistically significant (p<0.001).
Figure 11.
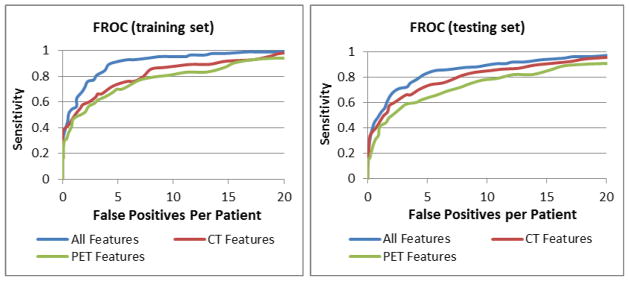
FROC analysis for degenerative osteophyte CAD
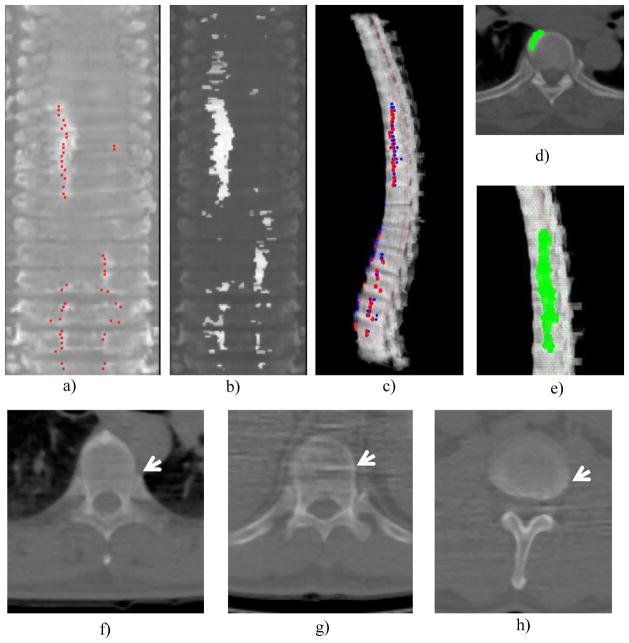
Figure 12 shows examples of detection from the degenerative osteophyte CAD system. The etiology of common false positives found included costovertebral junctions, image artifact, and partial volume averaging of inter-vertebral disks.
Figure 12. Detections in degenerative osteophyte CAD.
a) Reference standard projected onto the stacked feature map (red dots); b) detected osteophyte sites, highlighted horizontal segments; c) final detections projected back to 3D spine, red: reference standard, blue: detections; d) osteophyte detection on 2D slice; e) osteophyte detection on 3D display; f) false positive, costovertebral junction; g) false positive, image artifact and h) false positive, partial volume averaging of inter-vertebral disk.
4. Discussion
The framework of our cortical shell unwrapping technique is general in detecting abnormalities of the vertebral body cortex. The morphologic pattern of bone cortical fracturing and osteophytosis is fundamentally disparate. Vertebral body fracture lines appear as overt curvilinear surface discontinuities (induced by traumatic injury) whereas osteophytes appear as convex surface processes or osseous outgrowths, typically associated with cortical thickening. We can employ the supervised-learning framework to train CAD systems to detect different types of abnormal patterns on the cortical shell.
Degenerative osteophytes present in a variety of sizes, shapes, and densities, some examples of which are shown in Figure 2, and can sometimes mimic the appearance of other pathologic processes. Osteophytes can be differentiated, in part, from dense regions of the spine of alternative etiology, by their spatial localization to the cortical shell. They often form oblique longitudinal patterns across many vertebral bodies, following the distribution of biomechanical load stressors as modified by physiologic homeostatic processes. CT imaging is useful to detect these osteophytes, diagnosed as marginal regions of dysmorphic cortical shell thickening of the vertebral bodies, typically (but not universally) with a higher X-ray beam attenuation than the adjacent cortex. Additionally, on physiologic imaging modalities, osteophytes may manifest with increased activity due to processes such as active mineralization, induced by mechanical stressors and associated progressive exostosis. Unfortunately, actively mineralizing bone, which has preferential uptake in 18F-sodium fluoride PET [31] can be found in both osteophytes and metastases. Thus, osteophytes and spine metastases can manifest with similar and overlapping appearances on CT and 18F PET images, and potentially leading to false positive clinical diagnoses for neoplastic disease. Therefore, in this paper, we employed multimodal coregistered PET/CT images in the detection of degenerative osteophytes, and the results show the improvement over using PET or CT individually.
The system works for both low-dose low-resolution CT scans in PET/CT and high resolution spine CT. The high resolution CT allows the detection of thin fracture lines. The synergistic multi-modality feature integration of PET and CT features captures the attributes of degenerative change that either modality in isolation cannot. For instance, while both degenerative disease and metastases can demonstrate increased 18F-NaF uptake on PET imaging, some manifestations of degenerative osteophytosis are not as hyperdense as sclerotic metastatic disease on the CT. Combining PET and CT, other morphological features can also differentiate these entities.
The limitation of current technique is that it can only be applied to the vertebral body since the unwrapping technique is based on the cylindrical coordinate system. To detect abnormalities in other parts of the vertebra such as transverse processes and posterior spinous process, other unwrapping techniques should be investigated. For instance, the m-rep model [24], which represents the surface based on the medial axis, could be used to unfold the surface within a locally adaptive coordinate system.
Acknowledgments
This work was supported by the Intramural Research Program at National Institutes of Health, Clinical center.
Footnotes
Publisher's Disclaimer: This is a PDF file of an unedited manuscript that has been accepted for publication. As a service to our customers we are providing this early version of the manuscript. The manuscript will undergo copyediting, typesetting, and review of the resulting proof before it is published in its final citable form. Please note that during the production process errors may be discovered which could affect the content, and all legal disclaimers that apply to the journal pertain.
References
- 1.Smith M, Reed J, Facco R, Hlaing T, McGee A, Hicks B, Aaland M. The Reliability of Nonreconstructed Computerized Tomographic Scans of the Abdomen and Pelvis in Detecting Thoracolumbar Spine Injuries in Blunt Trauma. J Bone Joint Surg Am. 2009;91:2342–2349. doi: 10.2106/JBJS.H.01304. [DOI] [PubMed] [Google Scholar]
- 2.Klaassen Z, Tubbs RS, Apaydin N, Hage R, Jordan R, Loukas M. Vertebral spinal osteophytes. Anatomical Science International. 2011;86:1–9. doi: 10.1007/s12565-010-0080-8. [DOI] [PubMed] [Google Scholar]
- 3.Nathan H. Osteophytes of the Vertebral Column An Anatomical Study of Their Development According to Age, Race, and Sex with Considerations as to Their Etiology and Significance. Journal of Bone and Joint Surgery. 1962;44:243–268. [Google Scholar]
- 4.Klinder T, Ostermann J, Ehm M, Franz A, Kneser R, Lorenz C. Automated model-based vertebra detection, identification, and segmentation in CT images. Medical Image Analysis. 2009;13:471–482. doi: 10.1016/j.media.2009.02.004. [DOI] [PubMed] [Google Scholar]
- 5.O’Connor SD, Yao J, Summers RM. Lytic Metastases in Thoracolumbar Spine: Computer Aided Detection at CT -- A Preliminary Study. Radiology. 2007;242:811–816. doi: 10.1148/radiol.2423060260. [DOI] [PubMed] [Google Scholar]
- 6.Skrinskas T, Clemons M, Freedman O, Weller I, Whyne CM. Automated CT-based analysis to detect changes in the prevalence of lytic bone metastases from breast cancer. Clinical & experimental metastasis. 2009;26:97–103. doi: 10.1007/s10585-008-9219-6. [DOI] [PubMed] [Google Scholar]
- 7.Burns J, Yao J, Wiese T, Munoz H, Jones E, Summers R. Detection Of Sclerotic Metastases In The Thoracolumbar Spine On Computed Tomography. Radiology. 2013;268:69–78. doi: 10.1148/radiol.13121351. [DOI] [PMC free article] [PubMed] [Google Scholar]
- 8.Ghosh S, Alomari RS, Chaudhary V, Dhillon G. Automatic Lumbar Vertebra Segmentation from clinical CT for Wedge Compression Fracture Diagnosis. SPIE Medical Imaging. 2011 [Google Scholar]
- 9.Yao J, Burns J, Wiese T, Summers RM. Quantitative Vertebral Compression Fracture Evaluation Using a Height Compass. SPIE Medical Imaging. 2012 [Google Scholar]
- 10.Hsieh M-s, Tsai M-D, Yeh Y-D, Jou S-B. Automatic Spinal Fracture Diagnosis and Surgical Management Based on 3D Image Analysis and Reconstruction of CT Transverse Sections. Biomedical Engineering Applications, Basis & Communications. 2002;14:204–214. [Google Scholar]
- 11.Tan S, Yao J, Ward M. Computer aided evaluation of ankylosing spondylitis using high-resolution CT. IEEE Transactions on Medical Imaging. 2008;27:1252–1267. doi: 10.1109/TMI.2008.920612. [DOI] [PMC free article] [PubMed] [Google Scholar]
- 12.Stanley RJ, Antani S, Long R, Thoma G, Gupta K, Das M. Size-invariant descriptors for detecting regions of abnormal growth in cervical vertebrae. Computerized medical imaging and graphics. 2008;32:44–52. doi: 10.1016/j.compmedimag.2007.09.002. [DOI] [PubMed] [Google Scholar]
- 13.Herrmann AM, Geisler FH. A New Computer-Aided Technique for Analysis of Lateral Cervical Radiographs in Postoperative Patients With Degenerative Disease. Spine. 2004;29:1795–1803. doi: 10.1097/01.brs.0000135836.43459.40. [DOI] [PubMed] [Google Scholar]
- 14.Alomari RS, Corso JJ, Chaudhary V, Dhillon G. Computer-aided diagnosis of lumbar disc pathology from clinical lower spine MRI. Int J CARS. 2010:287–293. doi: 10.1007/s11548-009-0396-9. [DOI] [PubMed] [Google Scholar]
- 15.Neubert A, Fripp J. Automated detection, 3D segmentation and analysis of high resolution spine MR images using statistical shape models. Physics in Medicine. 2012;57:8357–75. doi: 10.1088/0031-9155/57/24/8357. [DOI] [PubMed] [Google Scholar]
- 16.Yao J, Burns JE, Muñoz H, Summers RM. Detection of Vertebral Body Fractures Based on Cortical Shell Unwrapping. the 15th International Conference on Medical Image Computing and Computer Assisted Intervention; Nice, France. 2012. pp. 509–516. [DOI] [PMC free article] [PubMed] [Google Scholar]
- 17.Yao J, Muñoz HE, Burns JE, Lu L, Kurdziel K, Choyke P, Summers RM. Computer Aided Detection of Spinal Degenerative Osteophytes on Sodium Fluoride PET/CT. MICCAI Workshop, Computational Methods and Clinical applications for Spine Imaging; Nagoya, Japan. 2013. [Google Scholar]
- 18.Vincent L, Soille P. Watersheds in Digital Spaces: An Efficient Algorithm Based on Immersion Simulations. IEEE Trans Pattern Anal Machine Intell. 1991;13:583–598. [Google Scholar]
- 19.Ibanez L, Schroeder W. ITK Software Guide. Kitware Inc; 2003. [Google Scholar]
- 20.Cormen TH, Leiserson CE, Rivest RL. Introduction to Algorithms. Mac Graw Hill; 1989. [Google Scholar]
- 21.Ghebreab S, Smeulders AWM. Combining Strings and Necklaces for Interactive Three-Dimensional Segmentation of Spinal Images Using an Integral Deformable Spine Model. IEEE Trans on Biomedical Engineering. 2004;51:1821–1829. doi: 10.1109/TBME.2004.831540. [DOI] [PubMed] [Google Scholar]
- 22.Heitz G, Rohlfing T, Maurer CRJ. Statistical Shape Model Generation Using Nonrigid Deformation of a Template Mesh. SPIE; San Diego, CA. 2005. [Google Scholar]
- 23.Verdonck B, Nijlunsing R, Gerritsen FA, Cheung J, Wever DJ, Veldhuizen A, Devillers S, Makeram-Ebeid S. Computer Assisted Quantitative Analysis of Deformities of the Human Spine. MICCAI; Cambridge, MA. 1998. pp. 822–831. [Google Scholar]
- 24.PIZER SM, FLETCHER PT, JOSHI S, THALL A, CHEN JZ, FRIDMAN Y, FRITSCH DS, GASH AG, GLOTZER JM, JIROUTEK MR, LU C, MULLER KE, TRACTON G, YUSHKEVICH P, CHANEY EL. Deformable M-Reps for 3D Medical Image Segmentation. International Journal of Computer Vision. 2003;55:85–106. doi: 10.1023/a:1026313132218. [DOI] [PMC free article] [PubMed] [Google Scholar]
- 25.Vrtovec T, Likar B, Pernus F. Automated curved planar reformation of 3D spine images. Physics in Medicine and Biology. 2005;50:4527–4540. doi: 10.1088/0031-9155/50/19/007. [DOI] [PubMed] [Google Scholar]
- 26.Xu C, Pham DL, Prince JL. Medical Image Segmentation Using Deformable Models. In: Sonka M, Fitzpatrick JM, editors. Handbook of Medical Imaging, Volume 2. Medical Image Processing and Analysis. SPIE; 2000. pp. 129–174. [Google Scholar]
- 27.Chambon S, Gourraud C, Moliard J-M, Nicolle P. Road crack extraction with adapted filtering and Markov model-based segmentation. International Joint Conference on Computer Vision Theory and Applications; Angers, France. 2010. [Google Scholar]
- 28.Zhang TY, Suen CY. A Fast Parallel Algorithms For Thinning Digital Patterns. Communication of the ACM. 1984;27:236–239. [Google Scholar]
- 29.Bai X, Latecki LJ, Liu WY. Skeleton Pruning by Contour Partitioning with Discrete Curve Evolution. IEEE TRANSACTIONS ON PATTERN ANALYSIS AND MACHINE INTELLIGENCE. 2007;29:1–14. doi: 10.1109/TPAMI.2007.59. [DOI] [PubMed] [Google Scholar]
- 30.Cristianini N, Taylor JS. An Introduction to Support Vector Machines. Cambridge University Press; 2000. [Google Scholar]
- 31.Histed SN, Lindenberg ML, Mena E, Turkbey B, Choyke PL, Kurdziel K. Review of functional/anatomical imaging in oncology. Nuclear medicine communications. 2012;33:349–61. doi: 10.1097/MNM.0b013e32834ec8a5. [DOI] [PMC free article] [PubMed] [Google Scholar]


