

Abstract
Neuronal birth and death are tightly coordinated to establish and maintain properly functioning neural circuits. Disruption of the equilibrium between neuronal birth and death following brain injury or pharmacological insult often induces reactive, and in some cases regenerative, neurogenesis. Many neurodegenerative disorders are not injury-induced, however, so it is critical to determine if and how reactive neurogenesis occurs under noninjury-induced neurodegenerative conditions. Here, we used a model of naturally occurring neural degradation in a neural circuit that controls song behavior in Gambel's white-crowned sparrows (Zonotrichia leucophrys gambelii) and examined the temporal dynamics between neuronal birth and death. We found that during seasonal-like regression of the song, control nucleus HVC (proper name), caspase-mediated apoptosis increased within 2 d following transition from breeding to nonbreeding conditions and neural stem-cell proliferation in the nearby ventricular zone (VZ) increased shortly thereafter. We show that inhibiting caspase-mediated apoptosis in HVC decreased neural stem-cell proliferation in the VZ. In baseline conditions the extent of neural stem-cell proliferation correlated positively with the number of dying cells in HVC. We demonstrate that as apoptosis increased and the number of both recently born and pre-existing neurons in HVC decreased, the structure of song, a learned sensorimotor behavior, degraded. Our data illustrate that reactive neurogenesis is not limited to injury-induced neuronal death, but also can result from normally occurring degradation of a telencephalic neural circuit.
Keywords: aging, apoptosis, neurogenesis, neuronal turnover, sex steroid, song bird
Introduction
The adult brain is capable of incorporating new neurons into existing neural circuits, a process broadly termed neurogenesis. Given that the absolute neuronal number in neurogenic regions typically does not increase in adult birds and mammals (for review, see Tramontin and Brenowitz, 2000; but see, Walton et al., 2012), the addition of new neurons must be offset by neuronal death. Proper equilibrium between neuronal birth and death is critical for maintaining neural circuits that control behavior, as is apparent from the pathological consequences that occur when neuronal death exceeds birth in chronic depression, Parkinson's disease, Alzheimer's disease, and age-related cognitive decline (for review, see Grote and Hannan, 2007).
Neuronal birth and death in healthy brains are tightly coordinated and causally linked. During early brain development, excess neurons are produced and subsequently die as neural circuits are refined (for review, see Kim and Sun, 2011). In adult vertebrates, neuronal death caused by ischemia or injury can increase neurogenesis within 7 d (for review, see Cho and Kim, 2010; Zupanc, 2009). Neuronal addition following neuronal death, referred to as reactive neurogenesis, may repair damaged areas and thereby restore function and behavior (Molowny et al., 1995). Although the effects of injury-induced neuronal death are well documented, the temporal dynamics between noninjury-induced neuronal birth and death, and their effects on behavior, remain unclear.
Seasonal regression of the avian motor pathway for song production (Fig. 1A) provides a tractable model for investigating the balance between noninjury-induced neuronal death and replacement, and their contribution to performance of a learned sensorimotor behavior, song. In Gambel's white-crowned sparrow (Zonotrichia leucophrys gambelii) the number of neurons within the pallial song control nucleus HVC (proper name; Reiner et al., 2004) changes seasonally (Smith et al., 1997b). Each breeding season HVC incorporates nearly 68,000 new neurons (Tramontin et al., 2000), most or all of which project to the robust nucleus of the arcopallium (RA; Scotto-Lomassese et al., 2007; but see Scott and Lois, 2007). As sparrows transition from breeding to nonbreeding conditions, an equal number of HVC neurons die via apoptosis (Thompson and Brenowitz, 2008). Song behavior also changes seasonally; white-crowned sparrows typically sing one song type that in breeding conditions is more stereotyped and longer than in nonbreeding conditions (Meitzen et al., 2009).
Figure 1.

A, Schematic illustrating the major projections within the song control circuits. Black arrows indicate the song production pathway; gray arrows show the anterior forebrain pathway. Note the VZ directly dorsal to HVC. nXII, tracheosyringeal portion of hypoglossal nucleus; DLM, dorsolateral division of the medial thalamus; lMAN, lateral subdivision of the magnocellular nucleus of the anterior nidopallium; D, dorsal; R, rostral. B, Experimental design for natural rapid regression study. C, Experimental design for caspase inhibitor cocktail infusion study.
Gambel's white-crowned sparrows are useful for studying neurodegeneration and reactive neurogenesis because in HVC these processes occur rapidly, robustly, and naturally (as opposed to being injury- or pharmacologically-induced). Here, we induce natural neural degeneration by transferring birds from breeding to nonbreeding conditions and characterize the relationship between neural stem-cell proliferation in the ventricular zone (VZ) and cell death in HVC. Moreover, we manipulate HVC cell death to show that it is necessary for the upregulation of neural stem-cell proliferation. We also identify changes in song that accompany the observed HVC cellular changes. Our study provides important insights into temporal dynamics between noninjury-induced neuronal birth and death and how modulation of this equilibrium relates to behavior.
Materials and Methods
Animals.
Seventy-four adult male Gambel's white-crowned sparrows (Zonotrichia leucophrys gambelii; white-crowned sparrows) were collected in eastern Washington during their prebreeding or postbreeding season migration. The minimum ages of birds were estimated by plumage coloration upon capture: at least 14 months for adults (white and black crown) or at least 2 months for juveniles (white and brown crown). Before the initiation of experiments, all birds were housed in indoor group aviaries exposed to short day photoperiods (SD; 8 h light, 16 h dark) for 12 weeks to ensure that the song and reproductive systems had regressed and would be sensitive to the stimulatory effects of transfer to long day photoperiods (LD) and testosterone (T) implant. All experiments followed NIH animal use guidelines and were approved by the University of Washington Institutional Animal Care and Use Committee.
Experimental procedures.
To examine the addition and survival of newborn neurons in HVC, birds housed in SD for 12 weeks were injected intramuscularly with BrdU (15 mg/ml in 0.09% NaCl and 0.012 m NaOH; Sigma-Aldrich) at a dose of 50 mg/kg once daily between 6 and 8 h after lights-on for 5 d. Two days following the final BrdU injection, each bird was implanted subcutaneously above the scapula with a 12 mm SILASTIC capsule (1.47 mm inner diameter, 1.96 mm outer diameter) filled with crystalline T (Sigma-Aldrich). We kept all birds in LD for 28 d after T implantation to allow full breeding-like growth of the song control nuclei (Tramontin et al., 2000). All birds except LD+T control birds (n = 8) had T pellets removed after 28 d of LD+T and were transferred overnight to SD, which mimics nonbreeding season conditions (Smith et al., 1997b). To assess neural and song degradation, birds were housed in SD until killed at different time points used in previous studies: 1 d (n = 8), 2 d (n = 9), 4 d (n = 9), 7 d (n = 10), 14 d (n = 10), or 28 d (n = 9) following transition into SD (Thompson et al., 2007, 2012; Meitzen et al., 2009). To label proliferating neural stem-cells and their progeny, all birds were injected with one dose of BrdU (50 mg/kg, 15 mg/ml) intraperitoneally 2 h before tissue collection.
To determine whether stem-cell proliferation in the VZ is functionally linked to cell death in HVC, we used caspase inhibitors to inhibit cell death in HVC during natural HVC regression. Previous work showed that neuronal loss from HVC results from caspase-dependent apoptosis and that infusing HVC with a mixture of caspase inhibitors decreased the number of apoptotic cells and newborn neurons in HVC of adult white-crowned sparrows transferred from breeding to nonbreeding conditions (Thompson and Brenowitz, 2008, 2009). Thus, to inhibit apoptosis within HVC upon transition from breeding to nonbreeding conditions, we stereotaxically implanted cannulae bilaterally adjacent to HVC and infused the same mixture of caspase inhibitors. Two days before transition from breeding to nonbreeding conditions, eleven 22- to 27-month-old birds were anesthetized with isoflurane (2%). We lowered cannula near HVC 0.8 mm ventral, 3.0 mm lateral to the intersection of the midsagittal and transverse sinuses. Histological analysis demonstrated that the ends of the cannulae track were 224 ± 33 μm from HVC. We fixed the cannula to the skull with dental cement and attached a micro-osmotic pump (Alzet model 1007D) to the cannula. Six birds received osmotic pumps containing a mixture of caspase inhibitors [0.015 mg in 100 μl of 1% DMSO in equal concentrations: pan-caspase inhibitor (Z-VAD-FMK; R&D Systems), caspase-3 inhibitor (Z-DEVD-FMK; Calbiochem), and caspase-9 inhibitor (Z-LEHD-FMK; Calbiochem)], whereas five control birds received only vehicle. We placed osmotic pumps into sealed microcentrifuge tubes filled with saline and mounted the tubes into custom-made “backpacks” that allowed the birds to fly freely. Two days after surgery, birds were transitioned from 28 d of LD+T to SD for 3 d. Two hours before kill on the last day, all birds were injected intraperitoneally with one dose of BrdU (50 mg/kg, 15 mg/ml) to label proliferating stem cells and their progeny in the VZ.
Blood draw and hormone analysis.
Blood samples were obtained from birds in LD+T at 28 d and upon euthanasia to measure circulating T concentrations. We drew 250 μl of blood from the alar vein in the wing into heparinized collection tubes, immediately centrifuged the tubes, and stored the plasma at −20°C until assay. Using a Testosterone Enzyme Immunoassay kit (Enzo Life Sciences), we measured plasma T concentration. Minimum and maximum detectable plasma T concentrations were 0.03 ng/ml and 40.00 ng/ml, respectively. Samples with undetectable levels of T were treated as having concentrations at the lower detection limit for statistical analyses. Intra-assay and interassay coefficients of variation were 2.27–5.43% and 27.20%, respectively.
Tissue collection and processing.
Five to 7 h after lights-on, brains were removed quickly after birds were deeply anesthetized with isoflurane. Within 2 min, brains were bisected at the midline and one randomly chosen hemisphere was frozen on dry ice for histology as described below. Halved brains were sectioned in the coronal plane at 40 μm on a cryostat, and each section was thaw-mounted serially. Every third section was Nissl stained and the remaining slides were stored at −80°C until immunolabeling. Because only one hemisphere of each brain was sectioned, all histological measurements described below are reported as unilateral counts or densities. The other half of each brain was stored at −80°C for future studies.
Immunohistochemistry and analysis.
To visualize BrdU-labeled cells, we processed brain sections as follows. Briefly, sections were fixed in 4% paraformaldehyde, rinsed in PBS with 0.5% DMSO and 0.5% Triton-X (PDTX; pH 7.4), incubated with 0.1 mg/ml proteinase K for 5 min, and postfixed. Slides were dipped in distilled water, incubated with 2N HCl at 37°C for 30 min, and rinsed with PDTX. After blocking in 5% heat inactivated goat serum, slides were incubated with rat anti-BrdU (1:200; AbD Serotec MCA2060) and mouse anti-HuC (1:100; Invitrogen) antibodies. HuC is a neuron-specific antigen expressed in both immature and fully differentiated neurons (Barami et al., 1995). Labeling was visualized with diaminobenzidine (DAB) staining following incubation with biotinylated goat anti-rat and anti-mouse IgG secondary antibodies (1:200; Vector Laboratories) and amplification with avidin-biotin peroxidase (ABC) complex (Vector Laboratories). To obtain a purple precipitate for the BrdU antigen, we used DAB-nickel stain (0.05% DAB, 0.05% nickel ammonium sulfate and 0.015% H2O2 in PBS). All single and double-labeled cells in each HVC section were counted. BrdU-positive cells in the ventral side of the VZ (vVZ) were counted from the hillock of the VZ medial to HVC, out to the most lateral extension of the vVZ in all sections that exhibited arching of the VZ (see Fig. 4A,B; Scott and Lois, 2007). New HVC neurons are born in this region of the VZ (Scott et al., 2012). Because BrdU pulses were administered at two experimental time points, the counts of BrdU-positive cells in the vVZ represent both neural stem cells that divided and became quiescent before LD+T onset, and vVZ proliferation 2 h before tissue harvesting. Baseline labeling of neural stem cells with the first pulses of BrdU likely remains constant across experimental groups because the neural stem cells of the vVZ overlying HVC divide for only brief periods and then become quiescent for up to at least 8 months (Kirn et al., 1991).
Figure 4.

The relationship between proliferation in the vVZ and the number of apoptotic cells in HVC during rapid regression of the song control system. A, The lag in time of peak vVZ proliferation compared with HVC cell death. The levels of cell death in HVC and proliferation in the vVZ are plotted relative to the maximum value of each measure to facilitate comparison of the time course of both measures. Proliferation in the vVZ peaks at 4 d following transition from breeding to nonbreeding conditions and 2–3 d following the peak of HVC cell death. B, The correlation between proliferation in the vVZ and the number of apoptotic cells in HVC during rapid regression of the song control system. All data pooled is indicated by the dashed line (R2 = 0.0464, p = 0.2140, n = 30 birds), pooled baseline condition data (i.e., 28 d of LD+T and SD; n = 9 birds) by the dark gray diamonds (individual data points) and dark gray solid line, and pooled active regression data (i.e., 1, 2, 4, 7, and 14 d of SD; n = 21 birds) by the light gray diamonds and solid line. See Table 3 for correlations between vVZ proliferation and AC-3 cell number within individual time points.
Activated caspase-3 (AC-3) immunolabeling was used to identify cells undergoing apoptosis (Srinivasan et al., 1998). Sections were blocked with 5% heat-inactivated goat serum, incubated with rabbit anti-AC-3 antibody (1:400; Santa Cruz Biotechnology), and then incubated with biotinylated goat anti-rabbit IgG secondary antibody (1:200; Vector Laboratories; Thompson and Brenowitz, 2008). DAB staining was performed following amplification of the secondary antibody with ABC. Sections were lightly counterstained with thionin, a Nissl stain, as previously described (Smith et al., 1997a). AC-3-positive cells were counted from four HVC sections using a random, systematic sampling protocol as described below (Tramontin et al., 1998). All measurements were made blind to treatment group.
All IHC was performed in batches of up to 28 slides with tissue from randomly assigned birds. Each batch included positive and negative controls.
Morphometric measurements in HVC and RA.
Volumes of HVC and RA in the randomly chosen hemisphere were determined by tracing the borders of the nuclei identified in Nissl stained tissue onto paper, these drawings were scanned, and the area was determined using ImageJ software (v1.46, NIH; http://rsb.info.nih.gov/ij/). Total volume was calculated from areas of the tracings using the formula for a truncated cone (Tramontin et al., 1998). We used a random, systematic sampling protocol to measure neuron density in HVC; this protocol yields estimates that do not differ from stereological methods (Tramontin et al., 1998). Samples were collected from sections through the full extent of each brain region. All Hu-positive neurons that fell within an ocular grid (∼1.9 × 103 mm2 at 1000×) randomly positioned in each section of HVC were counted to calculate neuronal density. Neuronal number was obtained by multiplying neuronal density for each bird by that bird's unilateral HVC volume.
Song recording and analysis.
To analyze song behavior, we housed all birds individually in sound isolation chambers (Industrial Acoustics, AC-1) beginning 14 d after LD+T onset. By 14 d, the song achieves the stereotyped structure typical of breeding song (Meitzen et al., 2009). Using Syrinx software (J. Burt, www.syrinxpc.com), we continually recorded vocalizations throughout the remainder of the experiment. To encourage birds to sing, we provided each bird with a mirror and 5 min of playback song from group-housed Gambel's white-crowned sparrows in breeding condition every 20 min during lighted conditions. Eight different song attributes (minimum and maximum frequency, frequency range, duration, aggregate entropy, average entropy, average power, and maximum power) of 30 randomly chosen digitized whole songs per bird and each syllable within all chosen songs were measured with Raven Pro v1.4 (Cornell Laboratory of Ornithology, http://www.birds.cornell.edu/brp/raven/ravenoverview.html). Variability in measures of these song attributes did not change when we sampled >30 songs. We calculated the mean of each song or syllable attribute for a given day for each bird (Meitzen et al., 2009). We calculated the coefficient of variation of minimum and of maximum frequency for whole song and for each syllable by dividing the standard deviation by the mean of a syllable or whole song from each bird for a given day (Meitzen et al., 2009). We measured the cross-correlation (similarity of two waveforms) between whole songs produced during day 21 of LD+T and day 23 of LD+T or days 1, 2, 4, 7, 14, or 28 of SD using the same 30 digitized songs with the batch-processing, cross-correlation function in Raven. We calculated song percentage completeness from the number of syllables produced in each of the same 30 songs by dividing the total number of syllables by the maximum number of syllables produced by the given bird—typically five syllables in Gambel's white-crowned sparrows. To control for individual bird variability in song completeness, we obtained a relative percentage completeness value for individual birds' songs throughout the time course by dividing the given day's value by the value from LD+T of the same bird. We measured song rate as the maximum number of songs produced during any 2 h period of the day. Two hour binning was chosen to obtain enough songs to perform statistical analysis from birds that sang infrequently (i.e., 14 and 28 d of SD). All measures of song were performed on song collected during 21 and 23 d LD+T and during 1, 2, 4, 7, 14, and 28 d of SD. If a bird did not sing at least 30 songs on one of these days, we did not include that bird's songs for that day in the analysis. Birds in the caspase inhibitor study never sang >30 songs during SD 1, 2, and 3 d, and so they were not included in the analyses.
Statistical analysis.
Comparisons were made with one-way ANOVAs with experiment duration as the factor, and Tukey tests for post hoc comparisons between durations of experimental treatment. For the caspase inhibitor experiment, comparisons between experimental groups were made with Student's t tests. All correlations were assessed with the Pearson's r correlation test. For all statistical tests, p ≤ 0.05 was considered significant. All statistical analyses were made using JMP v8.0.1 (SAS). Data are presented as mean ± SEM.
Results
Validation of full growth and regression of the song control system
We confirmed that our manipulations induced breeding-like growth and nonbreeding-like regression of the song production pathway (Fig. 1B shows experimental design) by demonstrating that plasma T levels and morphological changes within HVC and RA were consistent with LD+T and SD condition values from other studies. Systemic T plasma levels were elevated at 28 d of LD+T (Table 1) and morphological features of HVC and RA were typical of birds in breeding condition (Table 2; Fig. 2A; Smith et al., 1997b; Tramontin et al., 2000). Plasma T levels decreased by 1 d of SD and remained basal through the full 28 d of SD (Table 1). HVC and RA morphology of birds transitioned into nonbreeding conditions were consistent with those of nonbreeding white-crowned sparrows (Table 2; Fig. 2A; Smith et al., 1997b; Thompson et al., 2007).
Table 1.
Systemic plasma testosterone levels
| No. of days | LD+T 28 | SD |
ANOVA | |||||
|---|---|---|---|---|---|---|---|---|
| 1 | 2 | 4 | 7 | 14 | 28 | |||
| (n = 52) | (n = 8) | (n = 7) | (n = 9) | (n = 10) | (n = 10) | (n = 8) | ||
| Testosterone (ng/ml) | 16.38 ± 5.25a | 2.05 ± 0.41b | 1.31 ± 0.38b | 1.36 ± 0.25b | 1.49 ± 0.26b | 1.04 ± 0.18b | 0.78 ± 0.14b | F(6, 97) = 24.4997, p < 0.0001 |
All values are mean ± SEM.
a,bDenotes significant differences across treatment groups.
Table 2.
Morphometrics of HVC and RA
| No. of days | LD+T 28 | SD |
ANOVA | |||||
|---|---|---|---|---|---|---|---|---|
| 1 | 2 | 4 | 7 | 14 | 28 | |||
| HVC | (n = 8) | (n = 6) | (n = 8) | (n = 8) | (n = 9) | (n = 10) | (n = 8) | |
| Unilateral volume (mm3) | 0.60 ± 0.03a | 0.49 ± 0.05a,b | 0.52 ± 0.05a,b | 0.46 ± 0.03a,b | 0.45 ± 0.04a,b | 0.40 ± 0.04b | 0.45 ± 0.02a,b | F(6, 51)=3.0252, p = 0.0133 |
| (n = 6) | (n = 5) | (n = 4) | (n = 5) | (n = 6) | (n = 4) | (n = 5) | ||
| Neuron density (×103/mm3) | 93 ± 7a | 67 ± 2b | 65 ± 3b | 69 ± 6b | 57 ± 4b | 61 ± 5b | 66 ± 3b | F(6, 29)=5.8862, p = 0.0013 |
| Neuron no. (×103) | 50 ± 4a | 33 ± 7a,b | 29 ± 8a,b | 31 ± 2a,b | 25 ± 3b | 20 ± 3b | 28 ± 3a,b | F(6, 29)=3.6745, p = 0.0136 |
| RA | (n = 8) | (n = 6) | (n = 8) | (n = 8) | (n = 9) | (n = 10) | (n = 8) | |
| Unilateral volume (mm3) | 0.25 ± 0.02 | 0.20 ± 0.04 | 0.27 ± 0.02 | 0.20 ± 0.02 | 0.25 ± 0.04 | 0.18 ± 0.02 | 0.17 ± 0.02 | F(6,51)=2.9037, p = 0.0158 |
All values are mean ± SEM.
a,bDenotes significant differences across treatment groups.
Figure 2.
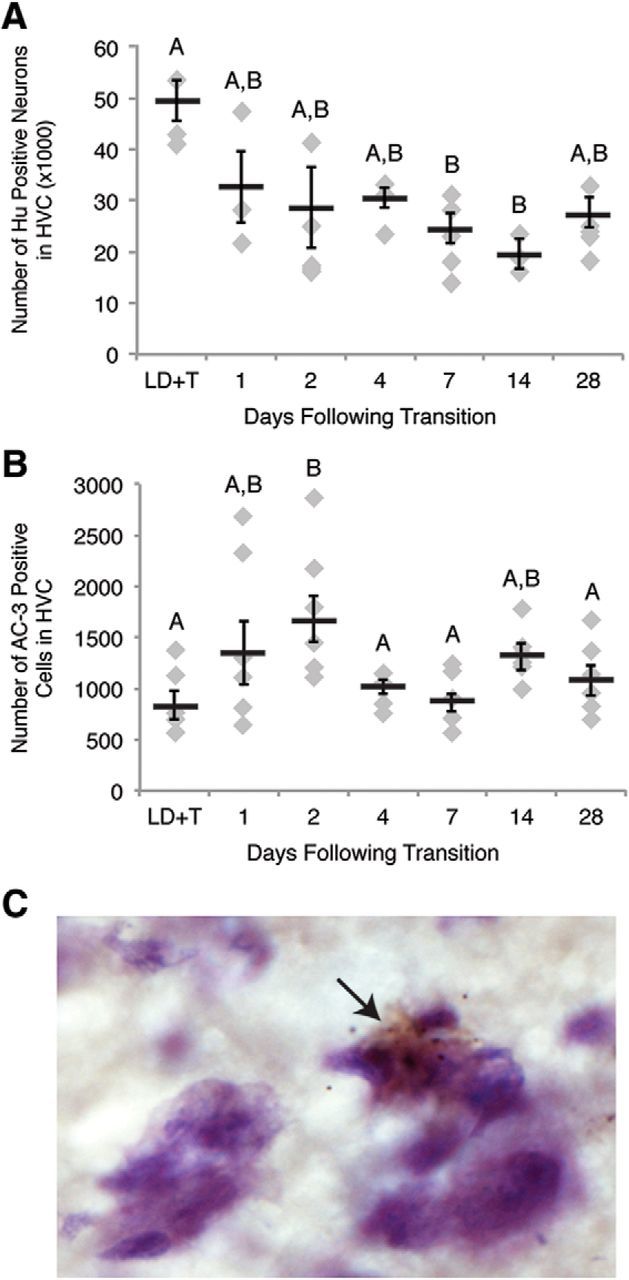
Apoptosis in HVC occurs rapidly after transition from breeding to nonbreeding conditions. A, Number of Hu positive neurons in one hemisphere of HVC across the time course of regression. HVC neuron number drops by 7 d following transition to nonbreeding conditions. B, Number of apoptotic cells in HVC on one side of the brain over the time course of regression. Number of AC-3-positive cells peaks at 2 d following transition from breeding to nonbreeding conditions. Letters above bars indicate significant differences among groups (one-way ANOVA, Tukey post hoc pairwise comparisons). All data plotted as mean ± SEM. C, Representative image of AC-3 immunohistochemistry in fresh frozen tissue counter-stained for Nissl (cytoplasm stains light purple, nuclei stain dark purple) illustrating apoptotic cells in HVC. The arrow indicates an AC-3-positive cell (brown). Note the condensed chromatin (a distinctive feature of apoptotic cells; shown in dark purple) contained within the AC-3-positive cell.
Apoptosis within HVC peaked rapidly after transition into nonbreeding conditions
We determined the time course of cell death in HVC as birds transitioned into nonbreeding conditions by quantifying the number of apoptotic cells within HVC during rapid regression using the apoptosis marker AC-3 (Fig. 2C). AC-3-positive cell number increased by 200% compared with breeding condition as soon as 2 d following transition from LD+T to SD (post hoc Tukey, p = 0.0342; Table 3; Fig. 2B). The number of AC-3-positive cells in HVC was not elevated significantly during any other time points of SD compared with the number of AC-3-positive cells in HVC of breeding condition birds (Table 3; Fig. 2B). Cells expressing AC-3 demonstrated features typical of apoptosis, including membrane blebbing, cytoplasm or chromatin condensation, and nuclear fragmentation. Apoptotic neurons no longer consistently expressed the neuronal marker Hu and we therefore could not reliably confirm the neuronal identity of AC-3-positive cells (Fig. 2C).
Table 3.
Cellular changes in HVC and the vVZ
| No. of days | LD+T 28 | SD |
ANOVA | |||||
|---|---|---|---|---|---|---|---|---|
| 1 | 2 | 4 | 7 | 14 | 28 | |||
| HVC | (n = 6) | (n = 7) | (n = 8) | (n = 7) | (n = 7) | (n = 5) | (n = 6) | |
| AC-3 cell no. | 836 ± 142a | 1351 ± 309a,b | 1681 ± 222b | 1062 ± 68a,b | 865 ± 91a | 1313 ± 131a,b | 1081 ± 151a,b | F(6, 39)=2.8600, p = 0.0207 |
| (n = 9) | (n = 5) | (n = 7) | (n = 8) | (n = 7) | (n = 6) | (n = 7) | ||
| BrdU-positive neuron no. | 162 ± 30 | 103 ± 31 | 113 ± 29 | 120 ± 20 | 103 ± 17 | 61 ± 15 | 76 ± 11 | F(6,42)=2.0819, p = 0.0758 |
| vVZ | (n = 5) | (n = 5) | (n = 6) | (n = 9) | (n = 5) | (n = 6) | (n = 6) | |
| BrdU-positive cell no. | 631 ± 51a | 1116 ± 73a,b | 1680 ± 225a,b | 2246 ± 303b | 1018 ± 235a,b | 893 ± 185a,b | 1187 ± 149a,b | F(6,35)=6.6854, p < 0.0001 |
| Coefficient of determination | (n = 6) | (n = 5) | (n = 6) | (n = 8) | (n = 5) | (n = 5) | (n = 4) | |
| vVZ proliferation to HVC AC-3 no. |
R2 = 0.8696, p = 0.0208 |
R2 = 0.4469, p = 0.1466 |
R2 = 0.0028, p = 0.9212 |
R2 = 0.4009, p = 0.5544 |
R2 = 0.0352, p = 0.8124 |
R2 = 0.8641, p = 0.2404 |
R2 = 0.9067, p = 0.0479 |
|
All values are mean ± SEM.
a,bDenotes significant differences across treatment groups.
Both new and pre-existing neurons died during rapid regression of HVC
We determined whether or not new adult-born neurons are selectively targeted for death during regression, by counting the number of new BrdU-positive neurons that persisted throughout regression (Figs. 1B, 3A). Adult-born neurons that enter HVC each breeding season might: (1) replace older neurons that died during the transition into nonbreeding conditions, (2) be a transient population that emerges and dies each breeding and nonbreeding season without persisting, or (3) incorporate and die along with pre-existing neurons. The number of new BrdU-positive neurons present in HVC decreased by 53% over the 28 d following the transition from breeding to nonbreeding condition (Table 3). This decrease in the population of new neurons closely matches the near 50% reduction in total neuron number (new and pre-existing neurons) in HVC during regression (Tables 2, 3). Moreover, the timing of death in both populations of neurons is similar: by 1 d of SD both new and total neuron numbers decrease by ∼35%, and by 14 d of SD both neuronal populations decrease by ∼60% (Tables 2, 3). These findings suggest that factors besides a neuron's age alone govern whether it lives or dies during regression of HVC.
Figure 3.
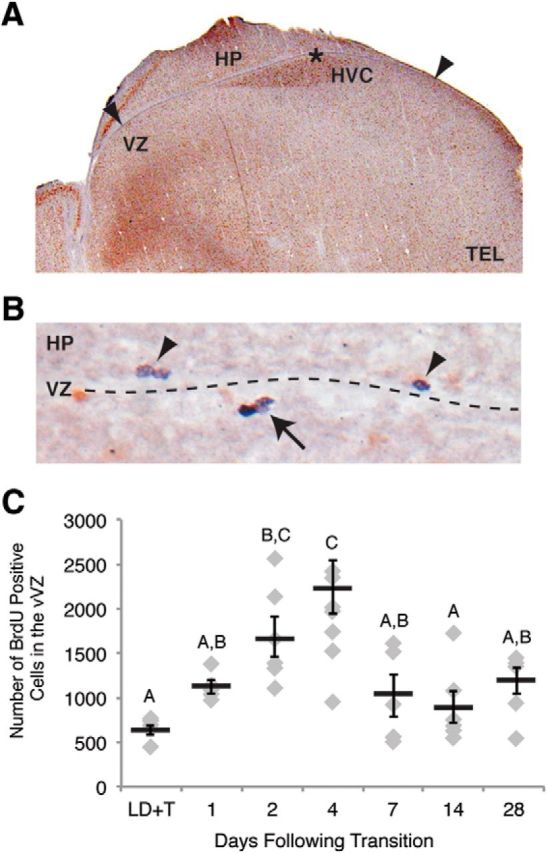
Proliferation in the vVZ changes rapidly during regression of the song control circuits. A, An image of Hu staining in the brain illustrating the method for counting BrdU-positive cells in the VZ. Arrowheads demonstrate the medial and lateral-most extents within which BrdU-positive cells were counted on the ventral side of the VZ. The star indicates the location of the image shown in B. HP, Hippocampus; TEL, telencephalon. B, A representative image of BrdU immunohistochemistry showing proliferative cells and their progeny in the VZ. BrdU labeling in the nucleus is stained dark purple whereas Hu labeling in the cytoplasm is stained brown. The arrow indicates BrdU-positive cells (i.e., neural progenitor cells or daughter cells) labeled at the time of BrdU injections. The arrowheads point to BrdU-positive cells on the dorsal side of the VZ (ventral to HP) that were not included in counts of BrdU-positive cells in the vVZ due to their inability to migrate across the ventricle to HVC. C, Number of BrdU-positive cells in the vVZ of one hemisphere over the experimental time course. Proliferation in the vVZ peaked at 4 d following transition from breeding to nonbreeding conditions. Letters above bars indicate significant differences among groups. All data plotted as mean ± SEM.
Cellular proliferation in the vVZ is temporally linked to apoptosis in HVC
We identified the temporal dynamics of neural precursor cell proliferation during transition to nonbreeding from breeding conditions by quantifying cellular proliferation in the vVZ (i.e., cells labeled with a 2 h prepulse of BrdU) during the time course of regression. Basal rates of proliferation in the vVZ did not differ significantly between long-term breeding (28 d LD+T) and long-term nonbreeding (28 d SD) birds (Tukey, p = 0.1120; Table 3; Fig. 3C). vVZ proliferation levels, however, varied significantly with the number of days of active regression (ANOVA, F(6,35) = 6.6854, p < 0.0001). Proliferation became significantly elevated by 4 d of SD compared with LD+T (Tukey, p = 0.0447;Table 3; Fig. 3C). Proliferation decreased to near basal LD+T levels by 7 d SD and remained basal through 14 and 28 d SD (Table 3; Fig. 3C). The peak in vVZ proliferation was delayed temporally compared with the peak in HVC cell death (Figs. 3C, 4A), suggesting that the two phenomena were functionally related.
We determined that changes in vVZ proliferation were related to changes in HVC cell death number by comparing vVZ proliferation with HVC cell death from each day within the time course of regression (Table 3). The levels of proliferation in the vVZ correlated positively with the number of AC-3-positive cells in HVC during stable breeding and nonbreeding conditions (i.e., 28 d of LD+T or SD, respectively; R2 = 0.8801, p = 0.0002, n = 9; Fig. 4B). There were no significant correlations on days in the time course that corresponded to a peak in HVC cell death (i.e., 2 d SD), a peak in vVZ proliferation (i.e., 2 and 4 d SD), or any other times during active regression of the song control circuit (i.e., 1, 7, and 14 d of SD; R2 = 0.0002, p = 0.9433, n = 21; Fig. 4B). These results demonstrate that proliferation in the vVZ follows HVC cell death during active regression of the song production circuit, and that under baseline conditions the amount of proliferation in the vVZ positively correlates with HVC cell apoptosis.
The proliferation of stem cells in the vVZ is functionally linked to cell death in HVC
We tested the necessity of HVC cell death for the observed increase in vVZ proliferation by experimentally inhibiting HVC cell death with an infusion of a mixture of caspase inhibitors for the first 3 d of rapid HVC regression. The caspase inhibitor cocktail prevented the normal decrease in total neuronal number (Table 4 shows values and statistics) and the increase in the number of AC-3-positive apoptotic HVC cells (Table 4; Fig. 5A). To control for possible effects of age or testosterone on neuronal turnover, all birds receiving infusions were age matched and testosterone levels were confirmed to not be significantly different between experimental groups (Table 4). Upon quantification of vVZ proliferation, we found that birds infused with the caspase inhibitor cocktail had significantly fewer BrdU-positive cells in the vVZ than those infused with the vehicle control (Table 4; Fig. 5B). These data indicate that the increased proliferation of neural stem cells in the vVZ is dependent on HVC cell death and that the increase in vVZ proliferation following naturally occurring HVC cell death is indeed a process of reactive neurogenesis.
Table 4.
Physiological and morphological changes in birds infused with vehicle or caspase inhibitor cocktail
| SD, 3 d |
t test | ||
|---|---|---|---|
| Vehicle (n = 5) | Caspase inhibitors (n = 6) | ||
| Testosterone | |||
| Plasma levels (ng/ml) | 0.39 ± 0.17 | 0.83 ± 0.37 | t(4.27) = 1.0798, p = 0.3374 |
| HVC | |||
| Cannula distance (mm) | 0.17 ± 0.07 | 0.27 ± 0.04 | t(6.91) = 1.8701, p = 0.1042 |
| Unilateral volume (mm3) | 0.69 ± 0.02 | 0.60 ± 0.04 | t(7.79) = 1.5342, p = 0.1645 |
| Neuron density (×103/mm3) | 97 ± 7 | 144 ± 8 | t(8.94) = 4.3868, p = 0.0018 |
| Neuron no. (×103) | 70 ± 7 | 90 ± 5 | t(7.72) = 2.4514, p = 0.0409 |
| AC-3 cell no. | 5370 ± 681 | 1844 ± 290 | t(6.76) = 4.7617, p = 0.0022 |
| RA | |||
| Unilateral volume (mm3) | 0.33 ± 0.03 | 0.28 ± 0.04 | t(7.08) = 0.8746, p = 0.4105 |
| vVZ | |||
| BrdU-positive cell no. | 2308 ± 223 | 934 ± 160 | t(7.56) = 5.0000, p = 0.0012 |
All values are mean ± SEM. Bold indicates significant differences.
Figure 5.

Cell death in HVC is functionally linked to stem-cell proliferation in the vVZ. A, Number of apoptotic cells in HVC of birds infused with vehicle or caspase inhibitor cocktail infusion near HVC for 3 d into the seasonally induced regression of HVC. The number of AC-3-positive cells was significantly lower in birds infused with the caspase inhibitor cocktail, confirming that the infusion prevented HVC cell death. B, Number of BrdU-positive cells in the vVZ of birds infused with vehicle (n = 5) or caspase inhibitor cocktail (n = 6) near HVC after 3 d of SD. Proliferation in the vVZ was significantly reduced in birds receiving the caspase inhibitor cocktail compared with those receiving vehicle following transition from breeding to nonbreeding conditions. Asterisk above bars indicate significant differences among groups. All data plotted as mean ± SEM.
Neuronal turnover is related to age but not testosterone levels
Neuronal survival and neural stem-cell proliferation may be influenced by both T and age (for review, see Riddle and Lichtenwalner, 2007; Brenowitz, 2008). We assessed the relationship of T and age to cell death and proliferation by comparing systemic plasma T levels and the minimum age of the birds (minimum age upon capture plus time spent in captivity) with cellular attributes of HVC and the vVZ. When all values for breeding and nonbreeding conditions were pooled, T levels of birds sampled in breeding and nonbreeding conditions did not correlate with the number of AC-3-positive cells in HVC (R2 = 0.0115, p = 0.4539, n = 39), the number of new neurons (R2 = 0.0109, p = 0.4410, n = 40), the number of BrdU-positive cells in the vVZ (R2 = 0.0042, p = 0.7002, n = 36), or minimum age (R2 = 0.0100, p = 0.3931, n = 39; data not shown). Furthermore, comparisons made with pooled baseline condition values (i.e., LD+T and 28 d of SD) or pooled active regression values (i.e., 1, 2, 4, 7, and 14 d of SD) revealed no significant correlations for the above measures.
Age correlated negatively with the number of AC-3-positive cells in HVC during baseline breeding and nonbreeding conditions (R2 = 0.5667, p = 0.0075, n = 11; Fig. 6A) and the number of BrdU-positive cells in the vVZ (R2 = 0.6546, p = 0.0026, n = 11; Fig. 6B), such that older birds had lower numbers of AC-3 cells and fewer BrdU-positive cells in the vVZ than younger birds. These data indicate that as a bird ages, steady-state neuronal turnover, or the birth and death of neurons in stable breeding and nonbreeding conditions, decreases.
Figure 6.
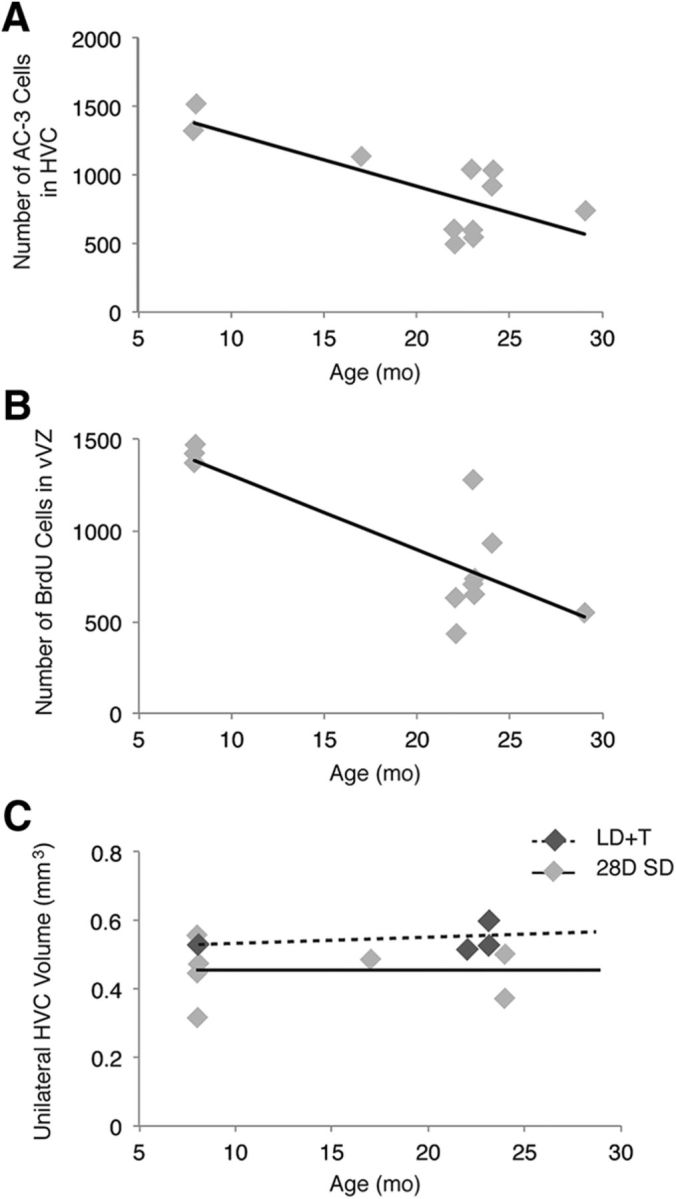
The effect of age on neuronal turnover in male white-crowned sparrows following HVC regression. A, HVC cell death negatively correlates with sparrow age at stable baseline breeding and nonbreeding conditions (i.e., LD+T and SD 28 d). Solid line is the regression line from pooled LD+T and SD 28 d birds, whereas gray dots represent the value for each bird (n = 11). B, Proliferation in the vVZ negatively correlates with sparrow age in stable baseline conditions (n = 11). C, HVC volume does not change with age. Maximal HVC growth (i.e., LD+T volume; n = 4) correlation with age is represented by the dotted line and complete HVC regression (i.e., 28 d of SD volume; n = 7) correlation with age is indicated by the solid line. For all scatter plots individual birds' values and age are represented by one dot: light gray for LD+T and dark gray for 28 d of SD.
By contrast, AC-3 cell number did not correlate with age (R2 = 0.0115, p = 0.2674, n = 23) during active regression of HVC (i.e., SD 1–14 d). Moreover, HVC volume and total neuron number did not correlate with age at maximal breeding condition (i.e., LD+T 28 d; HVC volume, R2 = 0.1095, p = 0.2458; HVC Hu density, R2 = 0.5562, p = 0.2542; n = 4; Fig. 6C) or when HVC was completely regressed (i.e., 28 d of SD; HVC volume, R2 = 0.0008, p = 0.9507; HVC Hu density, R2 = 0.0092, p = 0.9393; n = 7; Fig. 6C). Together these data suggest that HVC in all birds, regardless of age, regresses the same amount during the transition from breeding to nonbreeding conditions. Alternatively, during active regression of HVC, the vVZ proliferation did correlate with age (R2 = 0.2259, p = 0.0342, n = 18). These findings further suggest that because all birds exhibit similar amounts of cell death but reduced vVZ proliferation with age during active HVC regression, older birds would likely take more time than younger birds to repopulate the neurons lost during the transition from breeding to nonbreeding conditions.
Song structure degrades as the song control circuit regressed
A relationship between neuronal addition to HVC and the production of new or more stereotyped song in breeding condition birds is well documented (Pytte et al., 2007; Pytte et al., 2011; Meitzen et al., 2009). We quantified the time course and manner in which song degrades during transition into nonbreeding conditions, as this has not been documented previously. Upon regression of the song production pathway, maximal song rate (i.e., the greatest number of songs that birds sang during 2 consecutive hours) declined significantly during regression with a decrease in rate observed as early as 1 d of SD (Table 5). By 14 d of SD, five of nine birds had stopped singing entirely and by 28 d six of eight remaining birds were no longer singing. Song completeness and duration decreased over time of regression (Fig. 7B; Table 5). Aggregate entropy (i.e., the unpredictability of song structure), variability of maximal frequency, and song similarity (Fig. 7C) changed as a function of day in the time course of regression (Table 5). Significant changes in spectral properties of individual syllables were not detected (data not shown). We found no significant correlations between age or T levels and song quality or quantity in breeding and nonbreeding conditions. Six of eight birds recorded for song stopped singing between 14 and 28 d of SD, thus we could not determine whether cellular attributes of HVC correlated with either song quantity or quality. The overall timing of song degradation, however, reflects the timing of neural regression in HVC (summarized in Fig. 8). These data demonstrate that song structure reflects the overall condition of the song control circuits.
Table 5.
Quantification of song degradation
| No. of days | LD+T 21 | SD |
ANOVA | |||||
|---|---|---|---|---|---|---|---|---|
| 1 | 2 | 4 | 7 | 14 | 28 | |||
| Song rate | (n = 18 birds) | (n = 10) | (n = 8) | (n = 8) | (n = 8) | (n = 9) | (n = 8) | |
| Max no. songs/hour | 152 ± 33b | 73 ± 29a,b | 93 ± 46a,b | 104 ± 46a,b | 32 ± 9b | 33 ± 21b | 17 ± 12b | F(6, 62)=2.5623, p = 0.0279 |
| Spectral feature | (n = 11 birds*) | (n = 8) | (n = 4) | (n = 6) | (n = 7) | (n = 4) | (n = 2) | |
| Duration (s) | 1.68 ± 0.07b | 1.65 ± 0.09b | 1.42 ± 0.14a,b | 1.16 ± 0.19b | 1.16 ± 0.09b | 1.33 ± 0.18a,b | 1.09 ± 0.31b | F(6, 38)=3.9942, p = 0.0042 |
| Aggregate entropy | 3.51 ± 0.11b | 3.48 ± 0.14a,b | 3.27 ± 0.12a,b,c | 3.07 ± 0.14b,c | 3.14 ± 0.16b,c | 3.37 ± 0.16a,b | 2.63 ± 0.02c | F(6, 38)=2.5117, p = 0.0381 |
| Average power (dB) | 64.60 ± 1.89a,b | 66.01 ± 3.38a,b | 61.06 ± 6.83b | 64.64 ± 6.05a,b | 71.35 ± 4.84a,b | 75.72 ± 3.43b | 56.70 ± 6.59b | F(6, 38)=1.4236, p = 0.2311 |
| Coefficient of variation | ||||||||
| High frequency | 0.05 ± 0.01b | 0.05 ± 0.02b | 0.09 ± 0.05b | 0.08 ± 0.02b | 0.08 ± 0.02b | 0.05 ± 0.02b | 0.19 ± 0.05b | F(6, 38)=2.4167, p = 0.0446 |
| Low frequency | 0.12 ± 0.02 | 0.14 ± 0.05 | 0.23 ± 0.05 | 0.12 ± 0.03 | 0.11 ± 0.03 | 0.08 ± 0.04 | 0.08 ± 0.04 | F(6, 38)=0.2938, p = 0.9361 |
| Cross correlation | ||||||||
| To LD+T 21 d | 21 d: 0.48 ± 0.02b 23 d: 0.43 ± 0.02a,b |
0.36 ± 0.04b,c | 0.37 ± 0.02b,c | 0.37 ± 0.04b,c | 0.34 ± 0.04c | 0.32 ± 0.03c | N/A | F(6, 62)=4.0390, p = 0.0018 |
| Percentage complete | ||||||||
| Relative to LD+T | 0.943 ± 0.04b | 0.89 ± 0.06a,b | 0.64 ± 0.07c | 0.71 ± 0.04c | 0.87 ± 0.09a,b | 0.73 ± 0.02b,c | F(6, 35)=9.8902, p < 0.001 | |
Bold indicates significant differences.
*For spectral features, CV, cross correlation, and percentage complete, only birds that sang at least 30 songs for the given day were analyzed. All values are mean ± SEM.
a,benotes significant differences across treatment groups. Lack of letters indicates no differences.
Figure 7.

Song degrades as Gambel's white-crowned sparrows are transferred from breeding to nonbreeding conditions. A, Spectrograms of songs produced by three different individuals before and after the birds were transferred to nonbreeding conditions. The manner in which song degraded varied between birds. Bird 1 song illustrates degradation of the spectral properties within individual syllables. Birds 2 and 3 continued to sing individual syllables similar in spectral properties to those sung under breeding condition, but sang fewer syllables over time. Bird 3 stopped singing before 14 d of SD, as did 40% of the birds remaining in the experiment through at least 14 d of SD. B, Song completeness across the time course of regression plotted as percentage of songs that contained each of the syllable types produced under breeding conditions. Song completeness decreased significantly by 4 d into nonbreeding conditions. C, Cross-correlation, a measure of similarity, of song from 21 and 23 d of LD+T and days 1–14 of SD compared with 21 d of LD+T song. Song similarity decreased significantly by 7 d of SD relative to 23 d of LD+T. Letters above bars indicate significant differences among groups. All data plotted as mean ± SEM.
Figure 8.

Summary of the morphological and behavioral changes in Gambel's white-crowned sparrows occurring throughout breeding and nonbreeding conditions and transitions between the two. Data from previous publications (Smith et al., 1995; Tramontin et al., 2000; Thompson et al., 2007; Meitzen et al., 2009) were pooled with our data to construct the time course of growth and regression of HVC and the associated song behavior. Each property is presented as a percentage relative to the maximum value regardless of seasonal condition for that property. Solid lines represent existing data; dashed lines represent interpolated values. Gray background indicates nonbreeding condition, and white background indicates breeding condition.
Discussion
The question of how neuronal birth and death are balanced in the adult brain is of considerable interest because the proper balance is necessary for normal neural maintenance and function (Gage et al., 2008). The relationship between natural cell death and reactive proliferation, and resulting changes in behavior are not well understood. Here, we demonstrate that during rapid seasonal-like regression of the song production pathway in adult sparrows, apoptosis increases 2 d following transition from breeding to nonbreeding conditions and that vVZ neural progenitor cell proliferation increases shortly thereafter. Moreover, we find that this change in vVZ proliferation is dependent on HVC cell death; inhibiting caspase-dependent apoptosis in HVC decreases vVZ proliferation. We demonstrate that baseline vVZ proliferation correlates positively with HVC cell apoptosis and that neuronal turnover decreases with age. We show that song, a learned sensorimotor skill, degrades as HVC regresses (Fig. 8). Our study shows that reactive neurogenesis is not limited to injury-induced neuronal death, but also appears to occur with noninjury-induced degradation of a neural circuit.
Relationship between cell death and neural stem-cell proliferation
We found that HVC apoptosis peaked 2 d following initiation of HVC regression. Neural progenitor-cell proliferation in the vVZ peaked 4 d following HVC regression onset and 2 d after the peak in HVC cellular apoptosis. This increase in proliferation follows a time course similar to that observed in other species; new neuronal precursors are generated at highest levels 2–7 d following lesion of different brain regions in the lizard, Podarcis hispanica (Molowny et al., 1995), several rodent species (for review, see Wiltrout et al., 2007), and zebrafish (Danio rerio; Kroehne et al., 2011).
We found that the increased vVZ proliferation was functionally linked to HVC cell death: infusion of caspase inhibitor cocktail decreased HVC neuronal death and vVZ proliferation. These results are consistent with observations that (1) apoptosis is correlated with new HVC neuronal addition in canary (Kirn et al., 1994), and (2) experimentally induced neuronal death increased new HVC neuron number in zebra finch (Scharff et al., 2000). Moreover, Thompson and Brenowitz (2008, 2009) demonstrated that infusion of the same caspase inhibitor cocktail into HVC decreased both HVC regression and HVC neuronal addition in white-crowned sparrows. Our observations suggests that both the reduced neuronal addition observed by Thompson and Brenowitz (2008, 2009) and the increase in HVC neuronal addition following ablation of RA-projecting neurons in HVC observed by Scharff et al. (2000) may have resulted from a decrease in vVZ neuronal precursor proliferation.
Given the physical proximity of the VZ and HVC, it is possible that caspase inhibitors diffused to and acted directly on the vVZ neural stem cells. This scenario seems unlikely to explain our results, however. Given the anti-apoptotic action of the inhibitors, one might expect them to increase the number of surviving daughter cells, rather than decrease the number of these cells in the vVZ. The alternative proposal that inhibitor infusion decreased stem-cell proliferation by decreasing HVC cell death, therefore, seems more parsimonious.
It might seem puzzling that vVZ proliferation increases as total HVC neuron number is decreasing; most of the new neurons added to HVC in nonbreeding birds subsequently die (T.A.L., N.M.T., and E.A.B., unpublished observation). Why generate large numbers of new neurons only to have most of them die? It may be that the reactive neurogenesis observed in HVC did not evolve specifically to regenerate HVC, but rather reflects a generalized response to selection for brain repair following neurodegeneration. Thus, the linkage between HVC cell death and vVZ proliferation could be mediated by mechanisms that promote injury-induced reactive neurogenesis: neuroinflammation and activation of the innate immune response associated with apoptotic cells. Neuroinflammation and immune cells including microglia, regenerative astrocytes, and leukocytes have emerged as factors regulating injury-induced neurogenesis (for review, see Kohman and Rhodes, 2013). After neuronal death, microglia migrate to the injury site to remove cell debris, whereupon they release proinflammatory cytokines and proproliferative factors (for review, see Smith et al., 2012; Chen et al., 2013) to promote regeneration (Molowny et al., 1995; Kizil et al., 2012). Thus, a neuroinflammatory response may mediate apoptotic neuron clean up during HVC regression and may promote the vVZ proliferation increase we observed.
Alternatively, both HVC apoptosis and vVZ proliferation may be driven independently by a common factor such as reduced T levels. Direct regulation by T is unlikely, however. We found no significant correlations between T plasma levels and either apoptotic cell number or vVZ proliferation, and there was no significant difference in baseline vVZ proliferation between breeding and nonbreeding seasons. Moreover, treatment of canaries with T, estradiol, or sex steroid antagonists did not alter VZ proliferation (Brown et al., 1993). These findings suggest that T and its metabolites do not directly regulate vVZ proliferation.
Persistence of neurons and neuroblasts
Approximately half of newly generated neurons in both early development and the adult brain undergo apoptosis before functionally incorporating into neural circuits (for review, see Gage et al., 2008). Although factors regulating death of excess neurons in early brain development are well understood to include electrical activity and trophic support (McAllister, 2002), few studies have examined the causes and consequences of neuronal pruning in the adult brain. We found that nearly half of the new neurons survive through HVC regression. This observation suggests that whether a neuron survives is not determined by its age alone. Other factors, such as trophic support derived from target cells in RA, may influence the survival of HVC neurons (Larson et al., 2013).
We observed a small increase in HVC AC-3-positive cell number at 14 d of SD. This increase may reflect the well documented 50% die off of migrating neuroblasts (Alvarez-Buylla and Nottebohm, 1988). A large number of new cells were born by 4 d of SD and many presumably died over the next 2 weeks during migration or incorporation. New HVC neurons that do not establish functional connections with RA likely die due to lack of trophic support derived from their target neurons. Thus, lower trophic support (e.g., from T and BDNF) during nonbreeding conditions not only initiates regression of HVC (Wissman and Brenowitz, 2009), but also may account for the second peak in cell death observed at 14 d of SD.
Reduction of neuronal turnover and regenerative rate with age
Adult neurogenesis is ongoing and assumed to continue throughout the entire lifespan of an animal. Several studies, however, have demonstrated that neural stem-cell proliferation decreases with age (Molowny et al., 1995; Kuhn et al., 1996; Wang et al., 2002; Leuner et al., 2007). We too found that vVZ proliferation decreases with age in adult white-crowned sparrows. Unique to our study, we found that under baseline conditions apoptosis in HVC is also lower in older sparrows, suggesting that neuronal turnover declines with age. We observed, however, that regardless of age, birds have similar breeding and nonbreeding HVC volumes and neuronal number. Reduced neuronal turnover but similar amounts of HVC cell death during regression in older birds suggest that older birds may take more time than younger birds to repopulate the neurons that die during HVC regression.
Effect of circuit regression on song behavior
As the seasonally shifting balance between neuronal birth and death favors neuronal birth and incorporation of new HVC neurons in breeding conditions, song quality improves across several songbird species. In Gambel's white-crowned sparrows, transition into breeding condition drives both an increase in HVC neuronal number and an increase in song duration, completeness, and stereotypy (Tramontin et al., 2000; Meitzen et al., 2009). Moreover, the number of new neurons incorporated into HVC is positively correlated with quantity of song in canaries (Li et al., 2000; Alvarez-Borda and Nottebohm, 2002) and accuracy of song recovery following vocal muscle paralysis in zebra finches (Pytte et al., 2011). Conversely, song degrades as HVC regresses, as neuronal death exceeds neuronal addition. The manner in which each individual bird's song degraded varied: some birds' songs changed only in syntactical structure, whereas other birds' songs changed in stereotypy or spectral properties, or some combination of the two. Regardless of degradation manner and degree, the majority of birds stopped singing entirely by 28 d of SD. Overall, song degradation matched the timing of HVC regression, corroborating song quality as a measurable output of the dynamic cellular composition and function of the song production pathway.
Conclusion
We have shown that a pallial nucleus in adult songbirds is capable of reactive neurogenesis in a context where neurodegeneration occurs naturally rather than as the result of an insult. This observation suggests that the ability to replace lost neurons may be a fundamental feature of the adult brain. The pronounced regenerative capacity of the white-crowned sparrow brain and the discrete singing behavior that represents the functional output of the song production circuit provides an excellent system in which to examine the mechanisms driving natural neuronal replacement and how neuronal loss and replacement contributes to the maintenance of normal behavior.
Footnotes
This work was supported by NIH R01 MH53032 and R01 NS075331 to E.A.B. and National Research Service Award T32 GM007270 and Washington Research Foundation, Hall Fellowship to T.A.L. We thank Darren Hou and Matthew Shapiro for assistance with data collection, and David Perkel, Janneka Hille-Ris-Lambers, and Raymond Huey for assistance with data interpretation and paper preparation.
The authors declare no competing financial interests.
References
- Alvarez-Borda B, Nottebohm F. Gonads and singing play separate, additive roles in new neuron recruitment in adult canary brain. J Neurosci. 2002;22:8684–8690. doi: 10.1523/JNEUROSCI.22-19-08684.2002. [DOI] [PMC free article] [PubMed] [Google Scholar]
- Alvarez-Buylla A, Nottebohm F. Migration of young neurons in adult avian brain. Nature. 1988;335:353–354. doi: 10.1038/335353a0. [DOI] [PubMed] [Google Scholar]
- Barami K, Iversen K, Furneaux H, Goldman SA. Hu protein as an early marker of neuronal phenotypic differentiation by subependymal zone cells of the adult songbird forebrain. J Neurobiol. 1995;28:82–101. doi: 10.1002/neu.480280108. [DOI] [PubMed] [Google Scholar]
- Brenowitz EA. Plasticity of the song control system in adult birds. In: Zeigler HP, Marler P, editors. Neuroscience of birdsong. Cambridge: Cambridge UP; 2008. pp. 332–349. [Google Scholar]
- Brown SD, Johnson F, Bottjer SW. Neurogenesis in adult canary telencephalon is independent of gonadal hormone levels. J Neurosci. 1993;13:2024–2032. doi: 10.1523/JNEUROSCI.13-05-02024.1993. [DOI] [PMC free article] [PubMed] [Google Scholar]
- Chen BY, Wang X, Wang ZY, Wang YZ, Chen LW, Luo ZJ. Brain-derived neurotrophic factor stimulates proliferation and differentiation of neural stem cells, possibly by triggering the Wnt/β-catenin signaling pathway. J Neurosci Res. 2013;91:30–41. doi: 10.1002/jnr.23138. [DOI] [PubMed] [Google Scholar]
- Cho KO, Kim SY. Effects of brain insults and pharmacological manipulations on the adult hippocampal neurogenesis. Arch Pharm Res. 2010;33:1475–1488. doi: 10.1007/s12272-010-1002-y. [DOI] [PubMed] [Google Scholar]
- Gage FH, Kempermann G, Song H. Adult neurogenesis. Cold Spring Harbor: Cold Spring Harbor Laboratory; 2008. [Google Scholar]
- Grote HE, Hannan AJ. Regulators of adult neurogenesis in the healthy and diseased brain. Clin Exp Pharmacol Physiol. 2007;34:533–545. doi: 10.1111/j.1440-1681.2007.04610.x. [DOI] [PubMed] [Google Scholar]
- Kim WR, Sun W. Programmed cell death during postnatal development of the rodent nervous system. Dev Growth Differ. 2011;53:225–235. doi: 10.1111/j.1440-169X.2010.01226.x. [DOI] [PubMed] [Google Scholar]
- Kirn JR, Alvarez-Buylla A, Nottebohm F. Production and survival of projection neurons in a forebrain vocal center of adult male canaries. J Neurosci. 1991;11:1756–1762. doi: 10.1523/JNEUROSCI.11-06-01756.1991. [DOI] [PMC free article] [PubMed] [Google Scholar]
- Kirn J, O'Loughlin B, Kasparian S, Nottebohm F. Cell death and neuronal recruitment in the high vocal center of adult male canaries are temporally related to changes in song. Proc Natl Acad Sci U S A. 1994;91:7844–7848. doi: 10.1073/pnas.91.17.7844. [DOI] [PMC free article] [PubMed] [Google Scholar]
- Kizil C, Kyritsis N, Dudczig S, Kroehne V, Freudenreich D, Kaslin J, Brand M. Regenerative neurogenesis from neural progenitor cells requires injury-induced expression of gata3. Dev Cell. 2012;23:1230–1237. doi: 10.1016/j.devcel.2012.10.014. [DOI] [PubMed] [Google Scholar]
- Kohman RA, Rhodes JS. Neurogenesis, inflammation and behavior. Brain Behav Immun. 2013;27:22–32. doi: 10.1016/j.bbi.2012.09.003. [DOI] [PMC free article] [PubMed] [Google Scholar]
- Kroehne V, Freudenreich D, Hans S, Kaslin J, Brand M. Regeneration of the adult zebrafish brain from neurogenic radial glia-type progenitors. Development. 2011;138:4831–4841. doi: 10.1242/dev.072587. [DOI] [PubMed] [Google Scholar]
- Kuhn HG, Dickinson-Anson H, Gage FH. Neurogenesis in the dentate gyrus of the adult rat: age-related decrease of neuronal progenitor proliferation. J Neurosci. 1996;16:2027–2033. doi: 10.1523/JNEUROSCI.16-06-02027.1996. [DOI] [PMC free article] [PubMed] [Google Scholar]
- Larson TA, Wang TW, Gale SD, Miller KE, Thatra NM, Caras ML, Perkel DJ, Brenowitz EA. Postsynaptic neural activity regulates neuronal addition in the adult avian song control system. Proc Natl Acad Sci U S A. 2013;110:16640–16644. doi: 10.1073/pnas.1310237110. [DOI] [PMC free article] [PubMed] [Google Scholar]
- Leuner B, Kozorovitskiy Y, Gross CG, Gould E. Diminished adult neurogenesis in the marmoset brain precedes old age. Proc Natl Acad Sci U S A. 2007;104:17169–17173. doi: 10.1073/pnas.0708228104. [DOI] [PMC free article] [PubMed] [Google Scholar]
- Li XC, Jarvis ED, Alvarez-Borda B, Lim DA, Nottebohm F. A relationship between behavior, neurotrophin expression, and new neuron survival. Proc Natl Acad Sci U S A. 2000;97:8584–8589. doi: 10.1073/pnas.140222497. [DOI] [PMC free article] [PubMed] [Google Scholar]
- McAllister AK. Neurotrophins and cortical development. Results Probl Cell Differ. 2002;39:89–112. doi: 10.1007/978-3-540-46006-0_5. [DOI] [PubMed] [Google Scholar]
- Meitzen J, Thompson CK, Choi H, Perkel DJ, Brenowitz EA. Time course of changes in Gambel's white-crowned sparrow song behavior following transitions in breeding condition. Horm Behav. 2009;55:217–227. doi: 10.1016/j.yhbeh.2008.10.006. [DOI] [PMC free article] [PubMed] [Google Scholar]
- Molowny A, Nacher J, Lopez-Garcia C. Reactive neurogenesis during regeneration of the lesioned medial cerebral cortex of lizards. Neuroscience. 1995;68:823–836. doi: 10.1016/0306-4522(95)00201-S. [DOI] [PubMed] [Google Scholar]
- Pytte CL, Gerson M, Miller J, Kirn JR. Increasing stereotypy in adult zebra finch song correlates with a declining rate of adult neurogenesis. Dev Neurobiol. 2007;67:1699–1720. doi: 10.1002/dneu.20520. [DOI] [PubMed] [Google Scholar]
- Pytte C, Yu YL, Wildstein S, George S, Kirn JR. Adult neuron addition to the zebra finch song motor pathway correlates with the rate and extent of recovery from Botox-induced paralysis of the vocal muscles. J Neurosci. 2011;31:16958–16968. doi: 10.1523/JNEUROSCI.2971-11.2011. [DOI] [PMC free article] [PubMed] [Google Scholar]
- Reiner A, Perkel DJ, Bruce LL, Butler AB, Csillag A, Kuenzel W, Medina L, Paxinos G, Shimizu T, Striedter G, Wild M, Ball GF, Durand S, Güntürkün O, Lee DW, Mello CV, Powers A, White SA, Hough G, Kubikova L, et al. Revised nomenclature for avian telencephalon and some related brainstem nuclei. J Comp Neurol. 2004;473:377–414. doi: 10.1002/cne.20118. [DOI] [PMC free article] [PubMed] [Google Scholar]
- Riddle DR, Lichtenwalner RJ. Neurogenesis in the adult and aging brain. In: Riddle DR, editor. Brain aging: models, methods, and mechanisms, Chap 6. Boca Raton, FL: CRC Press; 2007. [PubMed] [Google Scholar]
- Scharff C, Kirn JR, Grossman M, Macklis JD, Nottebohm F. Targeted neuronal death affects neuronal replacement and vocal behavior in adult songbirds. Neuron. 2000;25:481–492. doi: 10.1016/S0896-6273(00)80910-1. [DOI] [PubMed] [Google Scholar]
- Scott BB, Lois C. Developmental origin and identity of song system neurons born during vocal learning in songbirds. J Comp Neurol. 2007;502:202–214. doi: 10.1002/cne.21296. [DOI] [PubMed] [Google Scholar]
- Scott BB, Gardner T, Ji N, Fee MS, Lois C. Wandering neuronal migration in the postnatal vertebrate forebrain. J Neurosci. 2012;32:1436–1446. doi: 10.1523/JNEUROSCI.2145-11.2012. [DOI] [PMC free article] [PubMed] [Google Scholar]
- Scotto-Lomassese S, Rochefort C, Nshdejan A, Scharff C. HVC interneurons are not renewed in adult male zebra finches. Eur J Neurosci. 2007;25:1663–1668. doi: 10.1111/j.1460-9568.2007.05418.x. [DOI] [PubMed] [Google Scholar]
- Smith GT, Brenowitz EA, Wingfield JC, Baptista LF. Seasonal changes in song nuclei and song behavior in Gambel's white-crowned sparrows. J Neurobiol. 1995;28:114–125. doi: 10.1002/neu.480280110. [DOI] [PubMed] [Google Scholar]
- Smith GT, Brenowitz EA, Wingfield JC. Seasonal changes in the size of the avian song control nucleus HVC defined by multiple histological markers. J Comp Neurol. 1997a;381:253–261. doi: 10.1002/(SICI)1096-9861(19970512)381:3<253::AID-CNE1>3.0.CO%3B2-1. [DOI] [PubMed] [Google Scholar]
- Smith GT, Brenowitz EA, Wingfield JC. Roles of photoperiod and testosterone in seasonal plasticity of the avian song control system. J Neurobiol. 1997b;32:426–442. doi: 10.1002/(SICI)1097-4695(199704)32:4<426::AID-NEU6>3.0.CO%3B2-8. [DOI] [PubMed] [Google Scholar]
- Smith JA, Das A, Ray SK, Banik NL. Role of pro-inflammatory cytokines released from microglia in neurodegenerative diseases. Brain Res Bull. 2012;87:10–20. doi: 10.1016/j.brainresbull.2011.10.004. [DOI] [PMC free article] [PubMed] [Google Scholar]
- Srinivasan A, Roth KA, Sayers RO, Shindler KS, Wong AM, Fritz LC, Tomaselli KJ. In situ immunodetection of activated caspase-3 in apoptotic neurons in the developing nervous system. Cell Death Differ. 1998;5:1004–1016. doi: 10.1038/sj.cdd.4400449. [DOI] [PubMed] [Google Scholar]
- Thompson CK, Brenowitz EA. Caspase inhibitor infusion protects an avian song control circuit from seasonal-like neurodegeneration. J Neurosci. 2008;28:7130–7136. doi: 10.1523/JNEUROSCI.0663-08.2008. [DOI] [PMC free article] [PubMed] [Google Scholar]
- Thompson CK, Brenowitz EA. Neurogenesis in an adult avian song nucleus is reduced by decreasing caspase-mediated apoptosis. J Neurosci. 2009;29:4586–4591. doi: 10.1523/JNEUROSCI.5423-08.2009. [DOI] [PMC free article] [PubMed] [Google Scholar]
- Thompson CK, Bentley GE, Brenowitz EA. Rapid seasonal-like regression of the adult avian song control system. Proc Natl Acad Sci U S A. 2007;104:15520–15525. doi: 10.1073/pnas.0707239104. [DOI] [PMC free article] [PubMed] [Google Scholar]
- Thompson CK, Meitzen J, Replogle K, Drnevich J, Lent KL, Wissman AM, Farin FM, Bammler TK, Beyer RP, Clayton DF, Perkel DJ, Brenowitz EA. Seasonal changes in patterns of gene expression in avian song control brain regions. PLoS One. 2012;7:e35119. doi: 10.1371/journal.pone.0035119. [DOI] [PMC free article] [PubMed] [Google Scholar]
- Tramontin AD, Brenowitz EA. Seasonal plasticity in the adult brain. Trends Neurosci. 2000;23:251–258. doi: 10.1016/S0166-2236(00)01558-7. [DOI] [PubMed] [Google Scholar]
- Tramontin AD, Smith GT, Breuner CW, Brenowitz EA. Seasonal plasticity and sexual dimorphism in the avian song control system: stereological measurement of neuron density and number. J Comp Neurol. 1998;396:186–192. doi: 10.1002/(SICI)1096-9861(19980629)396:2<186::AID-CNE4>3.0.CO%3B2-X. [DOI] [PubMed] [Google Scholar]
- Tramontin AD, Hartman VN, Brenowitz EA. Breeding conditions induce rapid and sequential growth in adult avian song control circuits: a model of seasonal plasticity in the brain. J Neurosci. 2000;20:854–861. doi: 10.1523/JNEUROSCI.20-02-00854.2000. [DOI] [PMC free article] [PubMed] [Google Scholar]
- Walton C, Pariser E, Nottebohm F. The zebra finch paradox: song is little changed, but number of neurons doubles. J Neurosci. 2012;32:761–774. doi: 10.1523/JNEUROSCI.3434-11.2012. [DOI] [PMC free article] [PubMed] [Google Scholar]
- Wang N, Hurley P, Pytte C, Kirn JR. Vocal control neuron incorporation decreases with age in the adult zebra finch. J Neurosci. 2002;22:10864–10870. doi: 10.1523/JNEUROSCI.22-24-10864.2002. [DOI] [PMC free article] [PubMed] [Google Scholar]
- Wiltrout C, Lang B, Yan Y, Dempsey RJ, Vemuganti R. Repairing brain after stroke: a review on post-ischemic neurogenesis. Neurochem Int. 2007;50:1028–1041. doi: 10.1016/j.neuint.2007.04.011. [DOI] [PubMed] [Google Scholar]
- Wissman AM, Brenowitz EA. The role of neurotrophins in the seasonal-like growth of the avian song control system. J Neurosci. 2009;29:6461–6471. doi: 10.1523/JNEUROSCI.0638-09.2009. [DOI] [PMC free article] [PubMed] [Google Scholar]
- Zupanc GK. Towards brain repair: insights from teleost fish. Semin Cell Dev Biol. 2009;20:683–690. doi: 10.1016/j.semcdb.2008.12.001. [DOI] [PubMed] [Google Scholar]