Abstract
Opsin 4 (Opn4)/melanopsin-expressing intrinsically photosensitive retinal ganglion cells (ipRGCs) play a major role in non-image-forming visual system. Although advances have been made in understanding their morphological features and functions, the molecular mechanisms that regulate their formation and survival remain unknown. Previously, we found that mouse T-box brain 2 (Tbr2) (also known as Eomes), a T-box-containing transcription factor, was expressed in a subset of newborn RGCs, suggesting that it is involved in the formation of specific RGC subtypes. In this in vivo study, we used complex mouse genetics, single-cell dye tracing, and behavioral analyses to determine whether Tbr2 regulates ipRGC formation and survival. Our results show the following: (1) Opn4 is expressed exclusively in Tbr2-positive RGCs; (2) no ipRGCs are detected when Tbr2 is genetically ablated before RGC specification; and (3) most ipRGCs are eliminated when Tbr2 is deleted in established ipRGCs. The few remaining ipRGCs display abnormal dendritic morphological features and functions. In addition, some Tbr2-expressing RGCs can activate Opn4 expression on the loss of native ipRGCs, suggesting that Tbr2-expressing RGCs may serve as a reservoir of ipRGCs to regulate the number of ipRGCs and the expression levels of Opn4.
Keywords: circadian, Eomes, ipRGC, retina development, RGC subtypes, Tbr2
Introduction
Retinal ganglion cells (RGCs) are the sole output neurons of the retina and convey distinct features of visual information to specific nuclei in the brain (Masland, 2012). In the mouse retina, >20 types of RGCs have been described on the basis of their distinct morphological features (Rockhill et al., 2002; Coombs et al., 2007; Völgyi et al., 2009). Each RGC subtype is postulated to have a unique genetic makeup, and the establishment of diverse RGC subtypes is likely controlled by distinct combinatorial transcriptional cohorts. Nevertheless, the molecular mechanisms that lead to such diversity remain essentially unknown.
Among these diverse types of RGCs, opsin 4 (Opn4)/melanopsin-expressing intrinsically photosensitive RGCs (ipRGCs) are the only cells with comprehensively characterized morphological features, anatomical targets, and physiological functions (Provencio et al., 1998a,b; Hattar et al., 2006; Do et al., 2009; Schmidt and Kofuji, 2009; Berson et al., 2010; Ecker et al., 2010; Xue et al., 2011; Estevez et al., 2012; Hu et al., 2013). Their primary task is to control non-image-forming visual functions, including pupillary light reflex (PLR) and circadian photo-entrainment (Provencio et al., 2000; Lucas et al., 2001; Berson et al., 2002; Hattar et al., 2002; Panda et al., 2002; Provencio et al., 2002). Attempts to address the functions of the RGC transcriptional regulators POU class 4 homeobox 2 (Pou4f2; also known as Brn3b) and Islet 1 (Isl1) in ipRGCs prompted more questions regarding the molecular mechanism of ipRGC formation (Chen et al., 2011; Shi et al., 2013). Pou4f2 and Isl1 are activated in all RGCs during the early phase of RGC development [approximately embryonic day 12 (E12); Gan et al., 1999; Mu et al., 2008], which is much earlier than the onset of ipRGCs (approximately E15; McNeill et al., 2011). Throughout retinal development, they are not associated with a specific RGC type (Gan et al., 1999; Mu et al., 2008). Genetically deleting either of them caused a drastic loss of total RGCs, including, but not specific to, ipRGCs (Gan et al., 1999; Lin et al., 2004; Mu et al., 2008; Shi et al., 2013), suggesting the presence of other downstream factors that are more specific for ipRGC formation.
We observed previously that T-box brain 2 (Tbr2; also known as Eomes), a T-box-containing transcription factor, was expressed in a subset of newborn RGCs starting at E14.5, shortly preceding the onset of Opn4 expression. Most importantly, Tbr2 has been shown to be a common downstream factor of Pou4f2 and Isl1 (Mao et al., 2008; Mu et al., 2008). Single-cell transcriptome analysis also found that Tbr2 was enriched in ipRGCs (Siegert et al., 2012). Here, we used the rich resource of genetically modified mice in Opn4 and Tbr2 loci to address the molecular mechanisms regulating ipRGC formation and sustaining their survival by Tbr2. Our results demonstrate the following: (1) no ipRGCs are detected when Tbr2 is genetically ablated before RGC specification; (2) most ipRGCs are eliminated when Tbr2 is deleted in established ipRGCs; and (3) additional ipRGCs are produced from Tbr2-expressing (Tbr2+) RGCs on the loss of native ipRGCs.
Materials and Methods
Animal models.
The generation and genotyping of the mouse lines used in this study were described previously [Tbr2flox, Mao et al., 2008; SIX homeobox 3 (Six3)–Cre, Furuta et al., 2000; Opn4Tau–LacZ, Hattar et al., 2002; Opn4Cre:Z/EG, Ecker et al., 2010; and Brn3b−/−, Wang et al., 2000]. All mice were maintained in a mixed BL/6:129SvJ background. Both male and female mice were used in this study, and no differences were observed according to sex. All animal procedures followed the U.S. Public Health Service Policy on the Humane Care and Use of Laboratory Animals. The use of animals was approved by the local Institutional Animal Care and Use Committee and the Animal Welfare Committee at the University of Texas Health Science Center at Houston.
Immunohistochemical analysis.
We used Opn4 reporter mice to conduct Tbr2 and Opn4 colabeling analyses because the available antibodies against Tbr2 and Opn4 were both derived from rabbits. Embryos and embryonic or adult eyes were fixed, cryoembedded, and sectioned into 12–20 μm slices for immunofluorescent staining, as described by Mao et al. (2008). Retinal sections or whole retinas were placed in a 300 W microwave oven in 10 mm sodium citrate for 18 min to expose the antigen epitopes. Microwave-treated sections or whole retinas were then incubated with the following primary antibodies: rabbit anti-Tbr2/Eomes (1:1000 dilution; catalog #AB23345; Abcam), chicken anti-β-galactosidase (1:2000 dilution; catalog #9361; Abcam), chicken anti-green fluorescent protein (GFP; 1:600 dilution; catalog #A10262; Life Technologies), and rabbit anti-melanopsin/Opn4 (1:1000 dilution; catalog #N39; Advanced Targeting Systems). Alexa Fluor-conjugated secondary antibodies were obtained from Life Technologies (1:600 dilution). DAPI (1.5 μg/ml; Vector Laboratories) was used to stain the nuclei. Images were acquired on a Zeiss 510 confocal laser scanning microscope (Carl Zeiss) and exported as .TIFF files into Adobe Photoshop (Adobe Systems). Cell counting was conducted using the cell counter plugin of NIH ImageJ. All animals used in the immunohistochemical comparisons were littermates.
Morphological analysis of ipRGCs.
Mice were killed by cervical dislocation. Retinas were quickly isolated from sclera, mounted flat on black membrane filter paper, and perfused with oxygenated Ames medium (Sigma-Aldrich) in a recording chamber. The glass microelectrodes were pulled with a Brown-Flaming horizontal micropipette puller (Sutter Instruments), tip-filled with a mixture of 1% Lucifer yellow-CH (Life Technologies) and 3.5% Neurobiotin (NBT; Vector Laboratories), and backfilled with 3 m LiCl. The GFP+ ipRGCs were viewed with an epifluorescence microscope with a 40× water-immersion objective and randomly targeted. Cell penetration was verified within the first minute by iontophoresis of Lucifer yellow with negative current (−1 nA at 3 Hz). NBT was then injected into cells with positive current (+1 nA at 3 Hz) for 10–12 min. Tissue was fixed with 4% paraformaldehyde (PFA) in 0.1 m phosphate buffer for 1 h at ambient temperature. Dye-filled cells were visualized by incubating with Alexa Fluor 488-conjugated streptavidin (1:1000 dilution; Life Technologies) at 4°C overnight. The injected retinal tissue was immunostained with anti-GFP antibody to confirm the correct cell targeting and colabeled with anti-Opn4 antibody to distinguish the M2, M4, and M5 ipRGC subtypes on the basis of their distinct Opn4 expression levels. A goat polyclonal antibody for choline acetyltransferase (ChAT; 1:100 dilution; Millipore) was used to indicate the depth of dendritic stratification of the injected cells.
PLR analysis.
Mice aged 3–6 months were dark adapted for >30 min, gently restrained by hand, and exposed to infrared light (λ > 650 nm). Under infrared illumination, a single eye was illuminated with white light, starting from the dimmest intensity [−7 log unattenuated light density (Io)] to the brightest (0 log Io), in 30 s, 1 log unit incremental steps. Io at the level of the mouse eye was 15 mW/cm2 and was measured at the end of each experiment (IL-1700 radiometer; International Light). A series of pictures of the illuminated eye was captured with a digital camera at the end of the 30 s period, from which the percentage of pupil constriction was determined. The light source was a 150 W xenon arc lamp attenuated through neutral density filters (Lambda 10-3 and 10-2B; Sutter Instruments). To estimate the maximum pupil constriction, data were fitted to a sigmoidal dose–response curve with the lower asymptote fixed to y = 0 using OriginLab 8.5 software.
Wheel-running activity.
Mice aged 3–6 months were individually housed in wheel-running cages (Columbus Instruments). Wheel-running activity was constantly recorded and binned in 2 min. Mice were kept in each of the different light/dark cycling conditions for 10–25 cycles. During the light phase, mice were exposed to ∼650 lux of fluorescent white light. Data analysis was performed using NIH ImageJ software with the ActogramJ plug-in (Schmid et al., 2011) and the X2 periodogram.
X-gal staining of the brain.
To visualize the expression of β-galactosidase (LacZ) from the Opn4Tau–LacZ allele, mice were anesthetized by intraperitoneal injection of tribromoethanol (0.2 ml/g) and arterially perfused for 20 min with 30 ml of cold 4% PFA in PBS, pH 7.3. Their brains were removed, cryoprotected in 30% sucrose in PBS, pH 7.3, overnight, and sliced coronally into 50 μm sections. For X-gal staining, brain sections were washed twice for 10 min in wash buffer (100 mm phosphate buffer at pH 7.3, 2 mm MgCl2, 0.01% deoxycholate, and 0.02% Nonidet P-40), and incubated in staining solution (5 mm potassium ferricyanide, 5 mm potassium ferrocyanide, and 1 mg/ml X-gal in wash buffer) at ambient temperature in a light-tight chamber overnight.
RGC axon tracing.
Two microliters of cholera toxin subunit B (CTB) conjugated with Alexa Fluor-555 (1 mg/ml; Invitrogen) was injected into the vitreous of the right eye using a 35 gauge NanoFil system (World Precision Instruments) to trace the RGC axons in the suprachiasmatic nuclei (SCNs). One day after CTB injection, animals were anesthetized and killed with perfusion using 4% PFA. Whole brains were dissected and postfixed with 4% PFA. Cryopreserved brains were sectioned into consecutive 100 μm coronal sections for additional processing.
Results
Expression of Tbr2 and Opn4 in developing and mature mouse retinas suggests a stringent epistatic relationship between Tbr2 and Opn4/ipRGCs
To demonstrate the link between ipRGCs and Tbr2, we first studied the spatiotemporal relationship between Tbr2 and Opn4 during retinal development using retinas from Opn4Tau–LacZ/+ mice (Hattar et al., 2002). Consistent with the findings of a previous report (McNeill et al., 2011), a few Opn4Tau–LacZ/+ RGCs were readily detectable at E15 (Fig. 1A1), and all Opn4Tau–LacZ-expressing cells were found in Tbr2+ RGCs (Fig. 1A1–A3, arrowheads; six retinas and >100 LacZ+ RGCs examined). At postnatal day 0 (P0), when the number of ipRGCs peaked, Tbr2 was found in every LacZ+ cell (Fig. 1B1–B3, arrowheads; six retinas and >1000 LacZ+ RGCs examined). As the retinas matured from P5 to P60, Opn4Tau–LacZ expression was consistently restricted to Tbr2+ RGCs (Fig. 1C--E). A limited number of displaced ipRGCs was reported in the inner nuclear layer (Hattar et al., 2002); we found that these displaced ipRGCs also expressed Tbr2 (Fig. 1F1–F3). Without exception, Opn4 expression was restricted to Tbr2+ RGCs at all stages examined.
Figure 1.
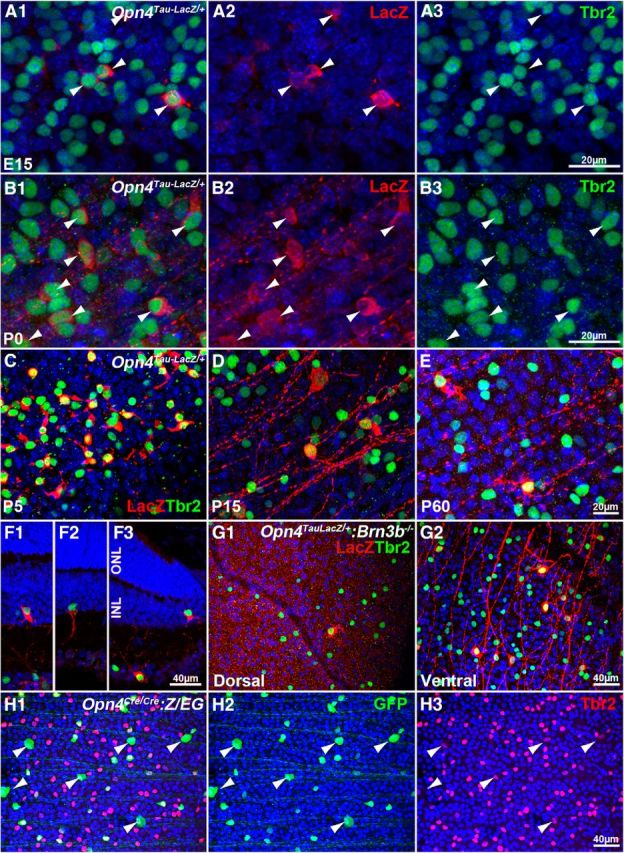
All ipRGCs express Tbr2. A1–G2, Confocal images of Opn4Tau–LacZ/+ retinas labeled with Tbr2 (green) and LacZ (red). A–E, Flat-mounted Opn4Tau–LacZ/+ retinas at E15 (A1–A3), P0 (B1–B3), P5 (C), P15 (D), and P60 (E). F1–F3, Cryosections of Opn4Tau–LacZ/+ retinas at P30 that show rare displaced LacZ+ ipRGCs in the inner nuclear layer are also Tbr2+. G, Dorsal (G1) and ventral (G2) quadrants of flat-mounted Opn4Tau–LacZ/+:Brn3b−/− retinas at P30 show more Tbr2+ cells in the ventral quadrant. H1–H3, Flat-mounted Opn4Cre/Cre:Z/EG retinas at P30, labeled with anti-Tbr2 and anti-GFP antibodies, show confinement of GFP+ cells in the Tbr2+ cells. INL, Inner nuclear layer; ONL, outer nuclear layer. Scale bars are presented in the last image of each series. In all panels, blue is DAPI-labeled nuclei.
The tight association between Opn4 and Tbr2 expression was further substantiated in a Brn3b-deficient retina that had a reduced number of RGCs and a skewed ipRGC distribution pattern. Brn3b is a key regulator of RGC differentiation. In Brn3b−/− retinas, ∼80% of RGC precursors die or trans-differentiate into other cell types during development, and the remaining 20% develop evenly across the retina (Gan et al., 1999; Lin et al., 2004; Qiu et al., 2008). However, Opn4+ cells are concentrated at the ventral retina (Lin et al., 2004). We reasoned that any key transcription factors involved in regulating the formation of ipRGCs would likely present a similarly distorted expression pattern in the Brn3b−/− retina. Indeed, Tbr2+ cells were distributed in a dorsal-low and ventral-high pattern in Brn3b−/−:Opn4Tau–LacZ/+ retinas (Fig. 1G1,G2), in which every remaining ipRGC was Tbr2+ (Fig. 1G1,G2).
Of the five known subtypes (M1–M5) of ipRGCs (Schmidt and Kofuji, 2009; Ecker et al., 2010; Schmidt et al., 2011b; Hu et al., 2013), the Opn4Tau–LacZ mice, which were used to collect the data shown in Figure 1, mainly reported that the M1 subtype dominated expression (Hattar et al., 2002; Schmidt et al., 2011a). To determine whether non-M1 ipRGCs also expressed Tbr2, we examined retinas from Opn4Cre/Cre:Z/EG mice, in which the GFP signal reports all known ipRGC subtypes (Ecker et al., 2010; Schmidt et al., 2011a). We found that all ipRGCs were Tbr2+, but not all Tbr2+ cells were ipRGCs (number of GFP+/number of Tbr2+ = 21.1 ± 4.6%, n = 4) (Fig. 1H1–H3). Some GFP+ ipRGCs with significantly larger soma, known as the M4 subtype (Ecker et al., 2010; Estevez et al., 2012), were untraceable in Opn4Tau–LacZ/+ retinas because of their low Opn4 levels (Ecker et al., 2010; Schmidt et al., 2011a). Correspondingly, these cells had lower levels of Tbr2 (Fig. 1H1–H3, arrowheads). Therefore, expression levels of Opn4 were also correlated with expression levels of Tbr2 in ipRGCs. These results are consistent with those of a previous transcript-profiling study that showed enrichment of Tbr2 in ipRGCs (Siegert et al., 2012). Our data show that all ipRGCs expressed Tbr2, indicating that a stringent epistatic relationship exists between Tbr2 and Opn4 and suggesting that Tbr2 plays a significant role in regulating ipRGCs.
Tbr2 is essential for the formation of ipRGCs
To determine whether Tbr2 is involved in the formation of ipRGCs, we deleted Tbr2 specifically in the retinal primordia before RGC specification by crossing Six3–Cre:Tbr2flox/flox:Opn4Tau–LacZ/+ and Tbr2flox/+ mice. The distribution of ipRGCs, as indicated by Opn4Tau–LacZ expression, in Tbr2-deficient retinas (Six3–Cre:Tbr2flox/flox:Opn4Tau–LacZ/+) was compared with that in control littermate retinas (Tbr2flox/+:Opn4Tau–LacZ/+). Six3–Cre functions effectively in the central region of retinal primordium before neuronal formation (Furuta et al., 2000), thereby causing a near complete deletion of the Tbr2flox/flox allele in the central retina. Although Tbr2 and Opn4 were expressed evenly throughout the control retinas (Fig. 2A1,A2), their expression disappeared concurrently in the central region of Six3–Cre:Tbr2flox/flox:Opn4Tau–LacZ/+ retinas (Fig. 2B1,B2). In the peripheral region of Six3–Cre:Tbr2flox/flox:Opn4Tau–LacZ/+ retinas, in which Six3–Cre was less effective (Furuta et al., 2000), some Opn4Tau–LacZ ipRGCs remained and expressed Tbr2 (Fig. 2C,D), indicating that Six3–Cre was not functional in these cells.
Figure 2.
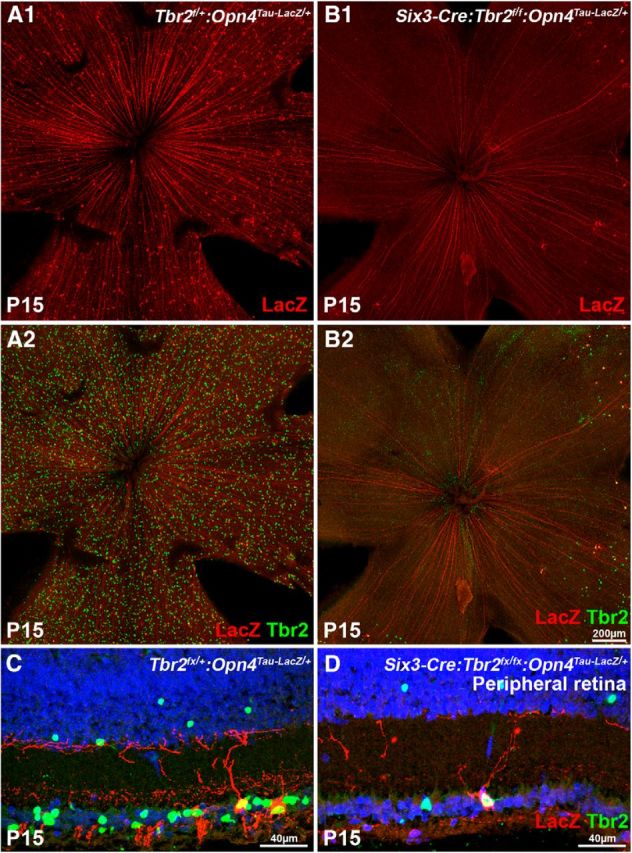
Tbr2 is essential for the formation of ipRGCs. Confocal images of P15 control and Tbr2-deficient retinal flat mounts (A, B) and cryosections at the peripheral region (C, D) that show Tbr2 and LacZ (reporting Opn4) labeling. A1, A2, C, The control Tbr2flox/+:Opn4Tau–LacZ/+ retinas show normal distribution of Tbr2+ and LacZ+ cells. A1 shows only the red channel from A2. B1, B2, D, The mutant Six3–Cre:Tbr2flox/flox:Opn4Tau–LacZ/+ retinas show the absence of Tbr2+ and LacZ+ cells in the central retina. Only a few LacZ+ cells can be found in the periphery. All remaining LacZ+ cells are also positive for Tbr2, indicating that Tbr2 is not removed by Cre in these cells. B1 shows only the red channel from B2.
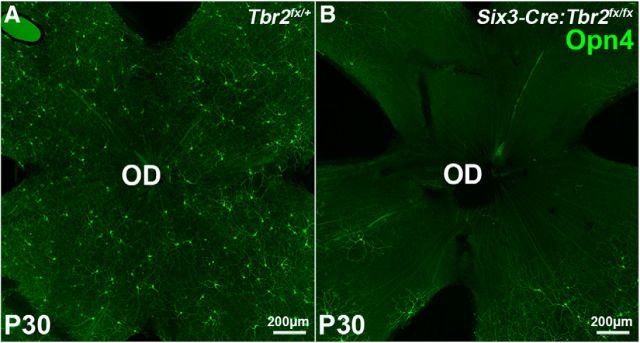
Because the Opn4Tau–LacZ line primarily reports the M1 ipRGC subtype (Hattar et al., 2002; Schmidt et al., 2011a), we also used anti-Opn4 antibody to determine whether the formation of M1–M3 ipRGC subtypes was affected in Six3–Cre:Tbr2flox/flox retinas by immunostaining. We found that Opn4 expression was completely absent in the central region of the Six3–Cre:Tbr2flox/flox retina (Fig. 3A,B). These results indicate that Tbr2 is required for the formation of at least the M1–M3 subtypes of ipRGCs. However, we could not directly determine whether Tbr2 is required for the formation of M4 and M5 subtypes because these ipRGC subtypes have subdetectable levels of Opn4 and can only be visualized in the Opn4Cre:Z/EG line (Ecker et al., 2010; Schmidt et al., 2011a). Currently, the best known reporter line that can reveal M4 and M5 is Opn4Cre/+:Z/EG, in which activation of enhanced GFP (eGFP) reporter relies on the activity of the Opn4 promoter (i.e., ipRGCs have to be specified and Opn4 has to be activated before cells can be detected). Therefore, this specific Opn4 reporter line cannot be used to test ipRGC formation.
Figure 3.
Tbr2 is essential for the formation of M1–M3 ipRGCs. Confocal images of control Tbr2flox/+ (A) and mutant Six3–Cre:Tbr2flox/flox (B) flat-mounted retinas, immunolabeled with anti-melanopsin/Opn4 antibody at P30. The central retina in B shows no Opn4+ cells, which is consistent with the presence of the LacZ reporter in the Six3–Cre:Tbr2flox/flox:Opn4Tau–LacZ/+ retina shown in Figure 2. OD: Optic disc.
Tbr2 is essential for maintaining the survival and dendritic integrity of ipRGCs
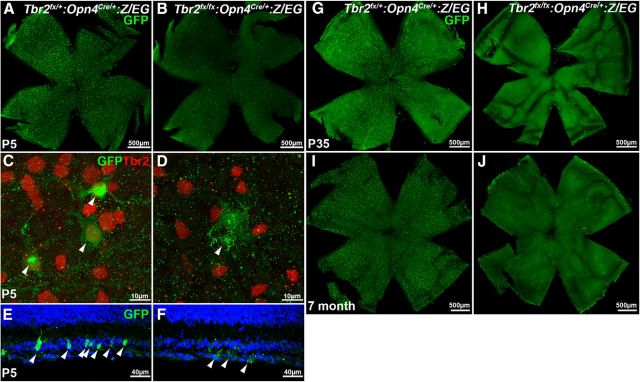
To determine whether Tbr2 is required for maintaining ipRGCs, we generated a Tbr2flox/flox:Opn4Cre/+:Z/EG line for simultaneously deleting the Tbr2flox allele and activating GFP by Opn4Cre in newly formed ipRGCs. Our results revealed that ∼90% of ipRGCs had disappeared in Tbr2flox/flox:Opn4Cre/+:Z/EG retinas at P5 (307.3 ± 45.8 GFP+ ipRGCs, n = 3, compared with 3239 ± 170 GFP+ ipRGCs in Tbr2flox/+:Opn4Cre/+:Z/EG control retinas, n = 3; Fig. 4A,B). The few remaining GFP+ ipRGCs were negative for Tbr2 (Fig. 4C,D), indicating that Opn4-driven Cre effectively removed the Tbr2flox/flox allele and activated the Z/EG allele in ipRGC development. The GFP-marked dendritic structures and cell bodies of the residual Tbr2−/− ipRGCs appeared to be less organized and more diffuse than did those in the control retinas (compare the arrowheads in Fig. 4C,D and E,F), suggesting that the residual cells were unhealthy and dying.
Figure 4.
Tbr2 is essential for the maintenance of ipRGCs. A–J, Confocal images of Opn4Cre/+:Z/EG (A, C, E, G, I) and Tbr2flox/flox:Opn4Cre/+:Z/EG (B, D, F, H, J) retinas at P5 (A–F), P35 (G, H), and 7 months (I, J) that were labeled for GFP only (A, B, E–J) or GFP and Tbr2 (C, D). C–F, Representative images show normal GFP signal in the control Opn4 Cre/+:Z/EG ipRGCs (C, E) and diffused abnormal GFP signal in Tbr2flox/flox:Opn4Cre/+:Z/EG cells (D, F).
Consistent with these findings, we observed additional ipRGC reduction at a later stage. More than 93% of ipRGCs were missing in the Tbr2flox/flox:Opn4Cre/+:Z/EG retinas at P35 (142.7 ± 7.8 GFP+ ipRGCs, n = 3, compared with 2028.7 ± 48.1 GFP+ ipRGCs, n = 3; Fig. 4G,H). This difference remained stable at 7 months of age (144 ± 9 GFP+ ipRGCs, n = 3, compared with 2677 ± 55 GFP+ ipRGCs, n = 3; Fig. 4I,J). The small number of surviving ipRGCs raised the possibility that Tbr2 is not required for the survival of specific ipRGC subtypes. To determine whether these residual GFP+ cells belong to any specific ipRGC subtypes, we injected NBT tracer into the control and mutant GFP+ cells and systematically compared their morphological characteristics, an indicator of ipRGC subtype. In total, 52 cells from 10 control retinas (Tbr2flox/+:Opn4Cre/+:Z/EG at P21–P28) and 71 cells from 14 mutant retinas (Tbr2flox/flox:Opn4Cre/+:Z/EG at P21–p28) were dye filled and imaged for analyses. On the basis of dendritic morphological features, stratifications, and Opn4 expression, we were able to detect five subtypes of ipRGCs [11 M1 (21.1%), 20 M2 (38.5%), 10 M3 (19.2%), 7 M4 (13.5%), and 4 M5 (7.7%) cells] from control retinas with similar features, as described previously (Schmidt and Kofuji, 2009; Ecker et al., 2010; Schmidt et al., 2011a,b; Hu et al., 2013). Among the 71 NBT-filled mutant GFP+ cells, two (2.8%) had M1-like OFF-lamina dendritic stratification, but their dendrites had less extensive ramifications and smaller dendritic fields (Fig. 5B, 125 μm) than did the wild-type (WT) M1 (Fig. 5A, 281 μm). Thirty-five (49.3%) mutant cells displayed ON-lamina dendritic stratifications. These cells contained at least two subtypes on the basis of their nuclear sizes, M4 (∼14 μm) plus M2 or M5 (9.7 ± 1.4 μm). We could not further distinguish M2 and M5 because of the lack of Opn4 expression for verification and the nonstandard dendritic diameter (average diameter, 290 μm for mutant ON cells vs 266 μm for M2, 314 μm for M4, and 158 μm for M5; Fig. 5C,D). Thirty-four (47.9%) mutant cells had bistratified M3-like morphological features, but their dendritic ramifications in ON and OFF laminas appeared uneven (Fig. 5E,F). In addition, their dendritic processes often traveled from one sublamina into another to form small loose-end branches (Fig. 5D,F, arrowheads). These data suggest that the residual ipRGCs did not belong to a specific subtype; they also exhibited apparent abnormalities in the absence of Tbr2. Together, our data demonstrate that Tbr2 is essential for the maintenance and maturation of the dendritic structures of ipRGCs. Our data also suggest that Tbr2 is not merely required for the expression of Opn4 but also for the formation and survival of ipRGCs.
Figure 5.
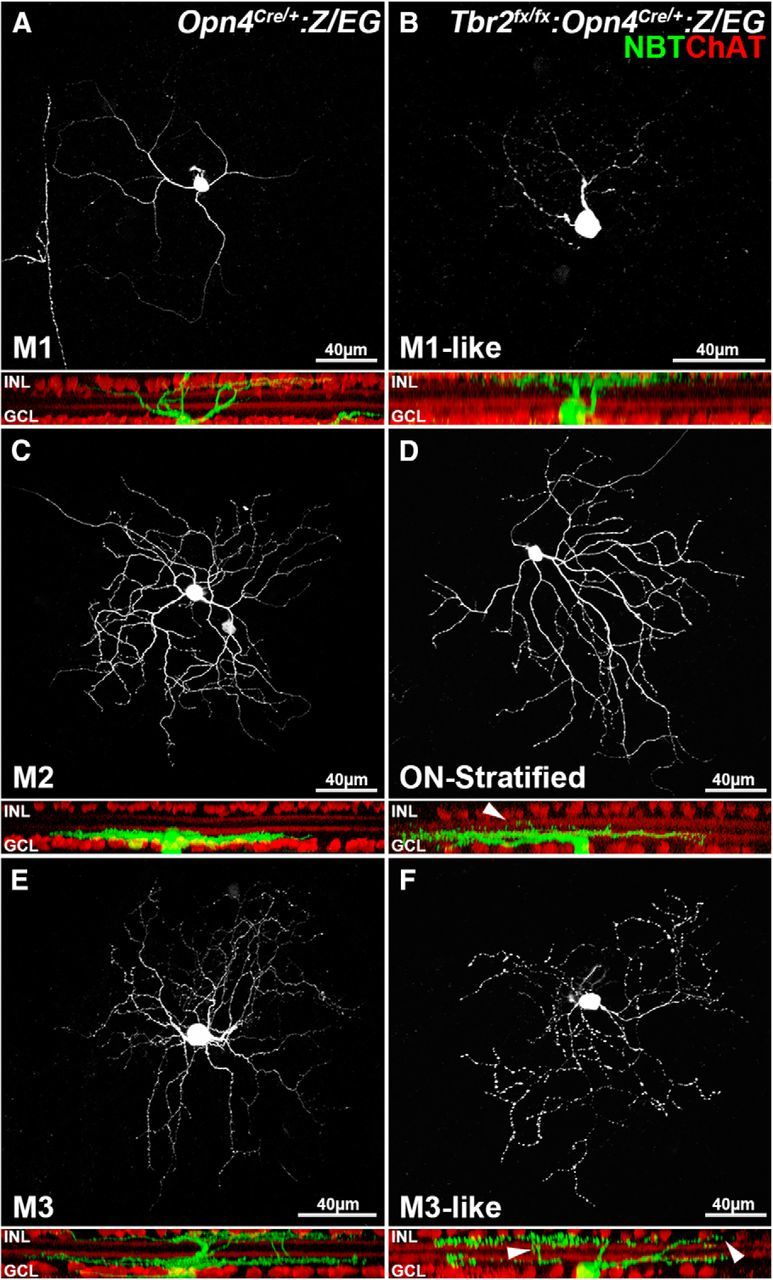
Tbr2 is required for the normal dendritic morphological features of ipRGCs. A–F, Representative confocal images show the morphological features of NBT-injected GFP+ cells in Tbr2flox/+:Opn4Cre/+:Z/EG control (A, C, E) and Tbr2flox/flox:Opn4Cre/+:Z/EG mutant (B, D, F) retinas. A, A representative M1 cell shows sparse dendrites in a whole-mount control retina. The side view revealed its single stratification (green) distal to the OFF cholinergic (ChAT+) band (red). C, A representative M2 cell displayed more complex dendritic branches proximal to the ON cholinergic band. E, A representative M3 cell had bistratified dendritic arbors ramifying at both the OFF and ON sublayers. In the mutant retinas, immunostaining for Opn4 was negative in all GFP+ cells. Therefore, dye-filled cells could only be categorized on the basis of their dendritic stratifications. B, A representative M1-like mutant cell extended its dendrites solely to the OFF sublayer. It had a smaller dendritic field and fewer branches than did the M1 cell in the control retina. D, A representative ON-layer-stratified mutant cell that may be M2 or M4. Although the major stratification is at the ON layer, minor runoffs can be found in the OFF layer. Thirty-five dye-filled cells (49.3%) ramified to the ON layer. Half of them displayed a small number of dendritic arbors extending to the OFF layer, as shown in the side view. The other half was relatively normal. F, An M3-like bistratified mutant cell. The side view shows less organized stratification. NBT, White in top view, green in side view; ChAT, red; GCL, ganglion cell layer; INL, inner nuclear layer.
The remaining ipRGCs in Tbr2flox/flox:Opn4Cre/+ mice are sufficient to drive light entrainment and masking and the PLR
To determine the extent to which the residual ipRGCs contribute to non-image-forming visual functions, we conducted circadian photo-entrainment and PLR analyses on Tbr2flox/flox:Opn4Cre/+ mice at the 3–6 months of age. WT and Tbr2flox/flox:Opn4Cre/Cre mice were also included, as positive and negative controls, respectively.
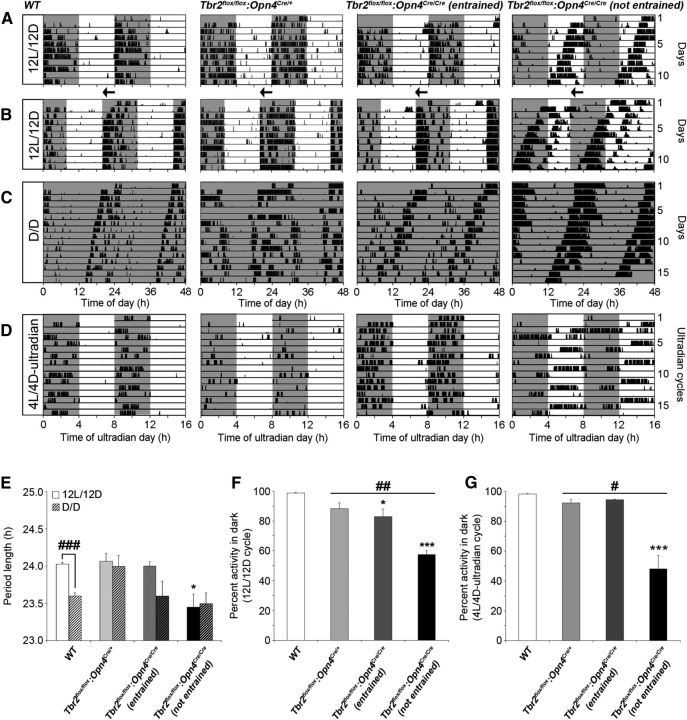
In the free wheel-running assay under four distinct conditions of the light/dark cycle, including the 12 h light/dark (12L/12D) cycle (Fig. 6A), a 4 h phase advance shifting (jetlag; Fig. 6B), a dark/dark (D/D) cycle (Fig. 6C), and a 4 h light/dark (4L/4D) ultradian cycle (Fig. 6D), we found that mice from all genotypes showed daily (Fig. 6A,B) and circadian (Fig. 6C) organization of their locomotor activity rhythm. We found small but significant differences between WT and Tbr2flox/flox:Opn4Cre/+ animals. For example, contrary to the WT controls, the endogenous period of the locomotor activity rhythm of the Tbr2flox/flox:Opn4Cre/+ animals recorded in a D/D cycle was not significantly different from that recorded in a 12L/12D cycle (Fig. 6C,E). In addition, mice lacking Tbr2 in ipRGCs had a higher percentage of daily activity confined to the light period compared with the WT mice (Fig. 6D,F,G). The double knock-out mice showed greater difficulty to entrain and mask compared with the WT or the Tbr2flox/flox:Opn4Cre/+ mice, presumably because these animals combined a more severe reduction in the number of ipRGCs with the lack of Opn4 (Fig. 6).
Figure 6.
Tbr2 is necessary for normal light entrainment and masking. A–D, Representative double-plotted profiles of wheel-running activity of a WT control (Tbr2flox/flox:Opn4+/+), a Tbr2flox/flox:Opn4Cre/+ mutant, and two Tbr2flox/flox:Opn4Cre/Cre mutant mice, obtained under a 12L/12D cycle (A, B), including after a 4 h phase shift (jetlag paradigm; B), D/D (C), and a 4L/4D ultradian cycle (D). Of five Tbr2flox/flox:Opn4Cre/Cre mice, three showed photo-entrainment to the 12L/12D cycle (entrained to light/dark), and two were unable to photo-entrain (not entrained to light/dark). Mice from all genotypes were able to run freely under D/D conditions. E, Average period lengths of the wheel activity rhythm under 12L/12D and D/D conditions. A two-way ANOVA revealed significant differences between the genotypes (F(3,22) = 4.59, p < 0.01) but not between lighting cycles (F(1,22) = 4.38, p = 0.054) or genotype × lighting cycles (F(3,22) = 1.42, p = 0.28). The genotypes under 12L/12D and D/D were compared using one-way ANOVA, followed by a Tukey's post hoc test (*p < 0.05, compared with WT). A comparison between the two lighting cycles within a genotype was performed using Student's t test (###p < 0.001). F, G, Percentage activity in the dark under 12L/12D (F) and 4L/4D (G) cycles. Data were collected from six WT, four Tbr2flox/flox:Opn4Cre/+, and five Tbr2flox/flox:Opn4Cre/Cre mice. A comparison between WT and combined Tbr2flox/flox:Opn4Cre/+ and Tbr2flox/flox:Opn4Cre/Cre animals was performed using Student's t test (#p < 0.05, ##p < 0.01). Comparisons among the four groups of animals were performed using one-way ANOVA, followed by a Tukey's post hoc test (*p < 0.05, ***p < 0.001, compared to WT). Error bars represent SEM. Shaded areas indicate periods of darkness. Arrows indicate the direction of the 4 h phase shift.
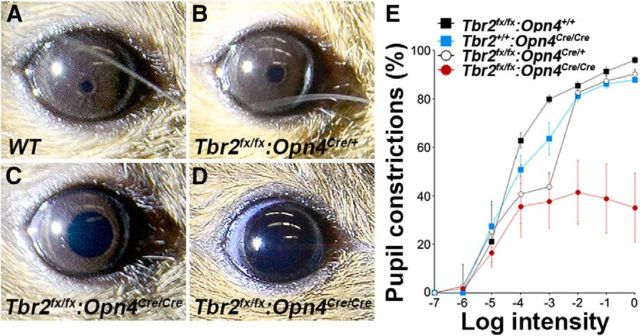
In the PLR test, the Tbr2flox/flox:Opn4Cre/+ mice, despite the severe loss of ipRGCs, exhibited surprisingly mild contractile defect at high irradiance levels compared with the WT (Fig. 7A,B,E). As for the locomotor activity data, Tbr2flox/flox:Opn4Cre/Cre mice presented a more severe defect, likely reflecting the additional lack of Opn4 (Fig. 7A–E), yet Tbr2flox/flox:Opn4Cre/Cre mice were still able to constrict their pupil by ∼40% in response to bright light (Fig. 7A,E).
Figure 7.
Tbr2 is required for normal PLR. A–D, Representative PLR images of WT control (A), Tbr2flox/flox:Opn4Cre/+ (B), and Tbr2flox/flox:Opn4Cre/Cre (C, D) pupils in response to a 30 s bright light stimulation (0 log Io). Some Tbr2flox/flox:Opn4Cre/Cre mice (3 of 5) showed an ∼60% pupil constriction (C), and others (2 of 5) were unable to maintain pupil constriction (D). E, Quantification of the PLR as a function of light intensity. Data were collected from five animals of each genotype. A two-way ANOVA revealed significant light intensity (F(7,119) = 58.74, p < 0.001), phenotype (F(2,119) = 29.64, p < 0.001), and light intensity × phenotype (F(14,119) = 4.75, p < 0.001) effects. The maximum constriction was 96.03 ± 1.36% in the WT control mice, 90.22 ± 1.94% in the Tbr2flox/flox:Opn4Cre/+ mice, 38.35 ± 5.41% in the Tbr2flox/flox:Opn4Cre/Cre mice, and 87.85 ± 0.89% in Opn4Cre/Cre mice. Io = 15 mW·cm−2 white light. Error bars represent SEM.
Although these results are globally consistent with the requirement of ipRGCs and Opn4 for normal non-image-forming visual functions, the deficits observed in Tbr2flox/flox:Opn4Cre/+ mice were surprisingly mild given the fact that the number of ipRGCs in the retinas of these animals is reduced by ∼93% (Figs. 4, 5). However, the next few experiments (Figs. 8, 9) may be able to explain these mild behavioral deficits.
Figure 8.
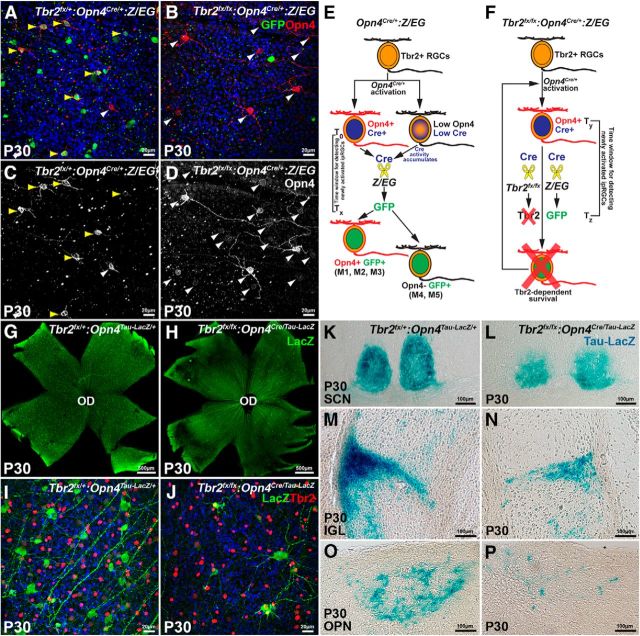
Tbr2+ RGCs activate Opn4 on the loss of ipRGCs. A–D, Confocal images of randomly selected regions from Tbr2flox/+:Opn4Cre/+:Z/EG control retinas (A) and Tbr2flox/flox:Opn4Cre/+:Z/EG mutant retinas (B) at P30, labeled for GFP (green) and Opn4 (red). In the Tbr2flox/flox:Opn4Cre/+:Z/EG retina, all Opn4+ RGCs were negative for GFP (white arrowheads in B), suggesting that they are new ipRGCs. C, D, Same images as in A and B, respectively, but showing only the red (Opn4) channel. Note that only two new ipRGCs can be detected in the control retinas (white arrowheads in C), yet many more new ipRGCs with weak Opn4 expression can be seen in the Tbr2-deficient retinas (white arrowheads in D). E, An illustration of the molecular events in ipRGCs in the Opn4Cre/+:Z/EG retinas, which are commonly used as WT to trace the morphological features of M1–M5 ipRGC subtypes. In this WT control retina, Tbr2 activates Opn4Cre/+, which produces Cre and Opn4. Over time, the accumulated Cre activity removes loxP-flanked βgeo (a LacZ and Neo fusion cassette) from the Z/EG allele to allow eGFP expression. A transitional time window of variable lengths (represented by the bracket between T0 and Tx) exists between Opn4 activation and GFP visualization. Opn4+/GFP− cells are detected in the transitional time and can be identified as “new ipRGCs” because their Opn4 has been activated but their GFP has not. T0, the time point when Tbr2 activates Opn4 and Cre in the new ipRGCs; Tx, the time point when the newly produced GFP becomes visible. F, An illustration showing the dynamics of Tbr2-activated new ipRGCs in the mutant Tbr2flox/flox:Opn4Cre/+:Z/EG retina. Tbr2 activates Opn4Cre/+ in ipRGCs. Both Opn4 and Cre are presumably initially produced using the same kinetics. The accumulated Cre recombinase eventually excises the floxed Tbr2, leading to Opn4 inactivation and ultimately cell death. Similar to the control, a transitional time window of unknown length (between Ty and Tz) should be present to detect Opn4+/GFP− new ipRGCs. G–J, Confocal images of Tbr2flox/+:Opn4Tau–LacZ/+ retinas (G, I) and Tbr2flox/flox:Opn4Cre/Tau–LacZ retinas (H, J) at P30 had been labeled for LacZ (G, H) or LacZ and Tbr2 (I, J). The mutant retinas show many LacZ+ cells throughout the retinas. This finding is in contrast to the Six3–Cre-active region in Figure 2B, which has no LacZ+ cells. K–P, Opn4Tau–LacZ ipRGCs from the control Tbr2flox/+:Opn4Tau–LacZ/+ and the mutant Tbr2flox/flox:Opn4Cre/Tau–LacZ retinas project to identical brain regions in the SCN (K, L), IGL (M, N), and olivary pretectal nuclei (OPN; O, P). OD: Optic Disc.
Figure 9.
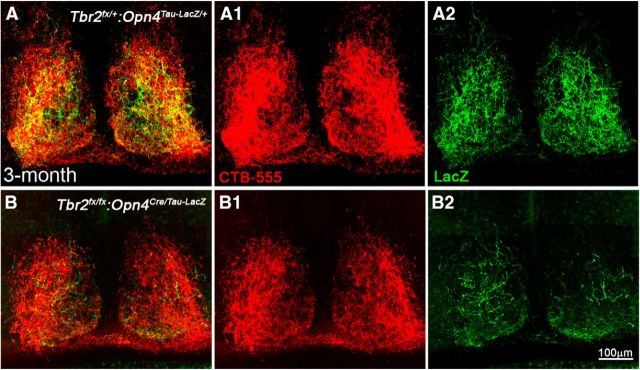
Anterograde RGC axon tracing reveals more axon coverage in the SCN than reported by Opn4Tau–LacZ. A, A section of center SCN from a Tbr2flox/+:Opn4Tau–LacZ/+ control mouse that received 2 μl of CTB-555 in the right eye. A1 shows CTB-555 labeling, and A2 shows LacZ labeling. B, A section of center SCN from a Tbr2flox/flox:Opn4Cre/Tau–LacZ mutant mouse received the same CTB-555 treatment as the control. B1 shows CTB-555 labeling, and B2 shows LacZ labeling.
Tbr2+ RGCs activate Opn4 on the loss of ipRGCs
The distinct behavioral outcomes in Tbr2flox/flox:Opn4Cre/+ and Tbr2flox/flox:Opn4Cre/Cre mice indicate that there is a small, but relatively stable (compared with the Tbr2flox/flox:Opn4Cre/Cre retina), number of ipRGCs in the Tbr2flox/flox:Opn4Cre/+ retina. To investigate the underlying mechanism responsible for the presence of these cells, we examined Tbr2flox/+:Opn4Cre/+:Z/EG (control) and Tbr2flox/flox:Opn4Cre/+:Z/EG (mutant) retinas at P30 to compare their Opn4 and GFP expression. In the control retinas, the Opn4-expressing cells that were positive for GFP (Fig. 8A,C, yellow arrowheads) were M1–M3 subtypes (Ecker et al., 2010). Many of the GFP+ ipRGCs that were Opn4 negative (Opn4−; Fig. 8A,C, green cells not marked by arrowheads) were defined as M4 or M5 ipRGC subtypes (Ecker et al., 2010). We consistently found that a small percentage of Opn4+ cells were GFP− (1.5 ± 0.6 per 0.1 mm2, n = 4; Fig. 8A,C, white arrowheads). As illustrated in Figure 8E and reasoned below, these Opn4+ but GFP− cells were designated as “newly activated” ipRGCs with recently activated Opn4 but no activated GFP. In the Tbr2flox/+:Opn4Cre/+:Z/EG control retinas, Tbr2 activated Opn4Cre/+, which produced Cre and Opn4. Over time, the accumulated Cre activity removed loxP-flanked βgeo (a LacZ and Neo fusion cassette) from the Z/EG allele to allow eGFP expression. An important determinant of Cre efficiency is Opn4 promoter activity, which is variable in different ipRGCs. Therefore, a transitional time window of variable lengths exists between Opn4 activation and GFP visualization. Opn4+/GFP− cells were detected in the transitional time when Opn4-driven Cre was accumulating to an effective level to activate the Z/EG allele.
The few remaining GFP+ cells in the Tbr2flox/flox:Opn4Cre/+:Z/EG mutant retina did not contain Opn4, as we predicted, because of the Opn4Cre-mediated Tbr2 deletion (Fig. 8B,D,F). Nonetheless, an extensive number of newly activated Opn4+/GFP− cells (11.8 ± 3.1 per 0.1 mm2, n = 4; Fig. 8B,D) was detected throughout the entire retina, suggesting that some RGCs begin to turn on Opn4 expression in the absence of ipRGCs. Given the stringent requirement for Tbr2 in the formation and maintenance of ipRGCs (results from Figs. 2–4), it is conceivable that these Opn4+ cells arose from other Tbr2+ RGCs. As illustrated in Figure 8F, in the mutant Tbr2flox/flox:Opn4Cre/+:Z/EG retina, Tbr2 activates Opn4Cre/+ in ipRGCs. Both Opn4 and Cre are presumably initially produced using the same kinetics. The accumulated Cre recombinase eventually excises the floxed Tbr2, leading to Opn4 inactivation and ultimately cell death. Other Tbr2+ RGCs sense the loss of ipRGCs and activate Opn4Cre/+. Over time, the accumulated Cre activity removed loxP-flanked βgeo from the Z/EG allele to allow eGFP expression. Similar to the control (Fig. 8E), a transitional time window of unknown length (between Ty and Tz) should be present to detect Opn4+/GFP− newly activated ipRGCs.
To trace whether these newly activated Opn4+ cells project axons to the same brain areas as native ipRGCs, we created a Tbr2flox/flox:Opn4Cre/Tau–LacZ line on the basis of genetic logic similar to that used to develop the Tbr2flox/flox:Opn4Cre/+:Z/EG allele. In brief, Tbr2-dependent Opn4Cre/Tau–LacZ activation produces Cre and Tau–LacZ. Accumulated Cre excises the floxed Tbr2 allele, while Tau–LacZ aggregates in cell bodies and processes. Tbr2 excision leads to ipRGC death. New rounds of Opn4Cre/Tau–LacZ are activated in other Tbr2+ cells, which leads to additional cell death and Opn4Cre/Tau–LacZ activation. We learned from the Tbr2flox/flox:Opn4Cre/+:Z/EG retina that most Opn4 active cells are newly activated ipRGCs at P30. Although differences exist between Opn4Cre/+ and Opn4Cre/Tau–LacZ, it is known that a lack of Opn4 does not cause ipRGC death (Lucas et al., 2003). Therefore, Tau–LacZ+ cells found in the Tbr2flox/flox:Opn4Cre/Tau–LacZ retina represent the equivalent population of Opn4+ cells in the Tbr2flox/flox:Opn4Cre/+:Z/EG retina at the same age described in Figure 8, B and D. Our results showed that many Tau–LacZ+ cells were present throughout P30 Tbr2flox/flox:Opn4Cre/Tau–LacZ retinas (Fig. 8G,H); as predicted, they were all positive for Tbr2 (Fig. 8I,J), supporting the hypothesis that additional Tbr2+ RGCs activate Opn4 in response to the loss of native ipRGCs. More importantly, these Tbr2+/Tau–LacZ+ cells projected to central brain targets that are identical to those of native ipRGCs, including SCNs, intergeniculate leaflet (IGL), and olivary pretectal nuclei (Fig. 8K–P); thus, these cells are indeed ipRGCs (henceforth termed new ipRGCs vs native ipRGCs).
However, it was noticeable that the LacZ signal in the brain targets of a Tbr2flox/flox:Opn4Cre/Tau–LacZ mouse is less intense than those in a control mouse. We believe, in addition to cell loss, one important reason for such low LacZ signal is that most new ipRGCs have very low Opn4 promoter activity as indicated by extremely weak Opn4 labeling in Figure 8, B and D. If this is true, an anterograde label of ipRGCs should reveal axons that are not detected using the Tau–LacZ reporter. Therefore, we injected Alexa Fluor-555-tagged CTB (CTB-555) into the eyes of 3-month-old mutant (Tbr2flox/flox:Opn4Cre/Tau–LacZ) and control (Tbr2flox/+:Opn4Tau–LacZ/+) mice (n = 3) and compared their RGC projections in the SCN. Results showed that CTB-555 signal covered a much bigger area than did the LacZ reporter in both mutant and control SCN (Fig. 9), indicating that more RGCs target to SCNs than those revealed by LacZ reporter. The extra SCNs coverage revealed by CTB-555 anterograde tracing may include ipRGCs that have low Opn4 promoter activity and other Tbr2+ RGCs that have projected to the same area.
To further substantiate that the new ipRGCs were pre-routed to their brain targets but not produced through de novo genesis in the mature retinas, we conducted birthdating experiments by injecting BrdU into P23 animals (one injection per day for 5 consecutive days) and concluded that the new ipRGCs were not born in the adult retina (negative data not shown). Our cumulative results indicate that some Tbr2+ RGCs that were initially lacking Opn4 but projected to the same regions as ipRGCs began to activate Opn4 expression on the loss of native ipRGCs.
Tbr2+ RGCs serve as a reservoir for ipRGCs
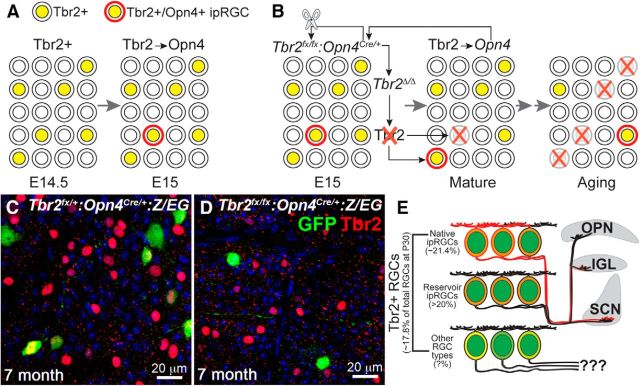
Overall, our data support a model in which many Tbr2+ RGCs have the capacity to activate Opn4 expression and can serve as a reservoir for ipRGCs. They are pre-established during retinogenesis and project to the same regions as native ipRGCs. In Tbr2flox/flox:Opn4Cre/+ mutant mice, most native ipRGCs die shortly after the Opn4Cre-mediated deletion of Tbr2, triggering the activation of Opn4 in these reservoir Tbr2+ RGCs (as illustrated in Fig. 10A,B). If this model is correct, we predict that the number of Tbr2+ RGCs will decline in older Tbr2flox/flox:Opn4Cre/+ mutant retinas when the pool of Tbr2+ cells decreases because of recurring Tbr2 deletion (Fig. 10B). To test this, we examined retinas from 7-month-old mice and found that the density of Tbr2+ cells dropped significantly in the mutant mice (8.55 ± 2.28% as normalized by DAPI+ cells, n = 3; Fig. 10D) compared with that in the control mice (13.65 ± 2.29% as normalized by DAPI+ cells, n = 3; Fig. 10C). Furthermore, <30 Opn4+ cells were found in the entire mutant retina at 7 months of age (data not shown), suggesting that Tbr2+ RGCs, which can activate Opn4, were nearly exhausted in the aging mutant retinas.
Figure 10.
A working model of Tbr2+ RGCs as a reservoir for ipRGCs. A, In normal development, Tbr2+ RGCs (represented by yellow circles) appear at approximately E14.5. Many of them begin to project to SCN, IGL, and olivary pretectal nuclei (OPN) from E15 onward. A few Opn4+ ipRGCs (represented by yellow circles with red rings) emerge from these Tbr2+ RGCs. Tbr2–Opn4 regulation continues through developmental stages and is maintained in adulthood. B, In Tbr2flox/flox:Opn4Cre/+ retinas, Opn4-driven Cre deletes Tbr2flox/flox alleles and Tbr2 protein slowly diminishes, leading to inactivation of Opn4 and finally the death of native ipRGCs. Through an as-yet unclear mechanism, this event triggers activation of Opn4 in other Tbr2+ RGCs that have projected to the same brain regions during development. These new ipRGCs with newly activated Opn4 repeat the Opn4Cre-mediated deletion of the Tbr2flox/flox cycle until the Tbr2+ RGC source is exhausted, as found in older animals. C, D, Confocal images of control Tbr2flox/+:Opn4Cre/+:Z/EG (C) and mutant Tbr2flox/flox:Opn4Cre/+:Z/EG (D) retinas labeled for GFP (green) and Tbr2 (red) at 7 months of age show a drastically reduced density of Tbr2+ cells in the mutant retina. This result supports the model that Tbr2+ RGCs can serve as a reservoir for ipRGCs. E, Tbr2+ RGC population in a P30 WT mouse retina. Tbr2+ RGCs occupy ∼17.8% of all RGCs. Among them, ∼21.4% (4–5% of total RGCs) are native ipRGCs that are detectable by the Opn4Cre:Z/EG reporting system. A currently unknown number of other Tbr2+ RGCs that project to identical regions in the brain as do the native ipRGCs can serve as reservoir, or buffer, ipRGCs. Additional populations of Tbr2+ RGCs with yet-to-be characterized morphological features, functions, and central projections (labeled by question marks) may also be present.
Discussion
We present an integrated study that combines sophisticated mouse genetics, single-cell dye filling, and behavior analyses to demonstrate that Tbr2 is required to regulate the formation and survival of ipRGCs; this represents the first report of this molecular regulator in conjunction with any known RGC subtypes. Our study also reveals a previously unknown mechanism whereby some Tbr2+ RGCs, which are pre-established during developmental stages, can compensate for the loss of native ipRGCs by activating Opn4. It is known that there is no neurogenesis in the WT adult retina (Kiyama et al., 2012). However, the number of GFP+ ipRGCs in Opn4Cre/+:Z/EG control mice increases significantly with age [2028 ± 48.1 at P35 (Fig. 3G); 2677 ± 55 at 7 months; 2870 at 10 months], suggesting that the number of ipRGCs can be modulated and that Tbr2+ RGCs can serve as a reservoir for this task (details described in Fig. 10E). The number of reservoir ipRGCs is currently unknown. The Opn4-expressing new ipRGCs in P30 Tbr2flox/flox:Opn4Cre/+ retinas is ∼1840 (Fig. 8D, 11.8 per 0.1 mm2 × 15.6 mm2, total area of mouse retina; derived from Remtulla and Hallett, 1985), which accounts for ∼20% of Tbr2+ RGCs. Because the upregulation of Opn4 in reservoir ipRGCs is a continuous process in Tbr2flox/flox:Opn4Cre/+ retinas, more RGCs may also have the potential to activate Opn4 expression. Supporting this view is the finding that the SCN of 3-month-old Tbr2flox/flox:Opn4Cre/Tau–LacZ animals still received extensive RGC axon projection (Fig. 9B). Whether these SCN-projected RGCs are all Tbr2+ and whether they all have the potential to activate Opn4 expression remain to be studied.
The novel concept of reservoir ipRGCs provides mechanistic explanations of why ipRGCs are more resistant to injury and mitochondrial optic neuropathies (La Morgia et al., 2010; Sexton et al., 2012), why the SCN receives projections from RGCs that do not express Opn4 in rats and hamsters (Gooley et al., 2003; Morin et al., 2003; Sollars et al., 2003), and why the number of ipRGCs and Opn4 level can be modulated by light/dark conditions (Hannibal et al., 2005; Hannibal, 2006). In addition, the increased number of GFP+ cells detected in older Opn4Cre/+:Z/EG retinas suggest that Opn4 expression in the ipRGC reservoir likely fluctuates at subdetectable levels. In this reporting system, the fluctuating Opn4Cre in each ipRGC may activate the Z/EG allele to turn on GFP when it reaches the threshold level. Subsequently, the ipRGC will be registered as a GFP+ ipRGC in its lifetime, regardless of its current Opn4 expression level. A plausible explanation for rodents (and perhaps other mammals) developing a reservoir of ipRGCs is to cope with the need to adapt to the distinct light/dark regimens in different geographic environments and seasons and thus reduce the sensory noise for reliable irradiance detection (Hannibal, 2006; Peirson et al., 2009). Despite our speculation, whether this ipRGC buffering mechanism is used by normal retinas to respond to changes in environmental lighting conditions remains to be scrutinized.
Consistent with our findings, a recent study using Tbr2–GFP bacterial artificial chromosome transgenic mice showed that Tbr2+ RGCs primarily project to non-image-forming visual brain targets (Marsh et al., 2014). Our results are in line with those of all existing reports except one (eGFP-expressing pseudorabies virus was used for retrograde labeling in mouse SCN; all SCN-afferent RGCs expressed Opn4; Baver et al., 2008). The difference is likely attributable to the sensitivity of techniques for detecting Opn4 expression in separate studies or other unknown mechanisms that trigger Opn4 expression in virus-infected SCN afferent RGCs because pseudorabies virus can cause aberrant gene expression in other regions of the CNS (Taharaguchi et al., 2003; Ono et al., 2007).
The results of the present study not only demonstrate that Tbr2 is a key regulator of the formation and survival of ipRGC but also reveal that retinal neurons have a novel compensatory response to the loss of native ipRGCs. In addition to ipRGCs, Sweeney et al. (2014) reported that several subsets of non-ipRGC exist in Tbr2+ RGCs, including CART+ (cocaine- and amphetamine-regulated transcript-expressing) ON–OFF direction-selective RGCs, Cdh3–GFP-labeled RGCs, and Unc5d+ (Unc-5 homolog D-expressing) RGCs. Future studies of how Tbr2 specifies and regulates different aspects of ipRGCs and other RGC types will provide novel insights into the genetic regulatory networks of RGC subtype formation.
Whether or not the Tbr2+ RGCs are hardwired during developmental stages and serve only as a reservoir for ipRGCs, how Tbr2+ RGCs activate Opn4 expression in distinct lighting conditions, and whether similar mechanisms are adopted by other neurons in the CNS are all pressing questions that remain to be elucidated.
Footnotes
This work was supported by National Eye Institute Grants EY018352 (S.W.W.), EY010121 (S.L.M.), EY016807 (S.P.), and EY018640 (C.P.R.), a grant from the E. Matilda Ziegler Foundation for the Blind (S.W.W.), and an unrestricted award from Research to Prevent Blindness to the Department of Ophthalmology and Visual Science, The University of Texas at Houston Health Science Center. C.A.M. was supported by National Eye Institute Grant EY011930 and Robert A. Welch Foundation Grant G-0010. Other support was provided in part by National Eye Institute Vision Core Grant P30EY10608 and the Hermann Eye Fund. We are grateful to Dr. King-Wai Yau (Johns Hopkins University) for insightful suggestions and thank Drs. King-Wai Yau and Yasuhide Furuta [RIKEN (The Institute of Physical and Chemical Research)] for sharing mouse strains. We also thank Michael W. Wise for editing the manuscript.
The authors declare no competing financial interests.
References
- Baver SB, Pickard GE, Sollars PJ, Pickard GE. Two types of melanopsin retinal ganglion cell differentially innervate the hypothalamic suprachiasmatic nucleus and the olivary pretectal nucleus. Eur J Neurosci. 2008;27:1763–1770. doi: 10.1111/j.1460-9568.2008.06149.x. [DOI] [PubMed] [Google Scholar]
- Berson DM, Dunn FA, Takao M. Phototransduction by retinal ganglion cells that set the circadian clock. Science. 2002;295:1070–1073. doi: 10.1126/science.1067262. [DOI] [PubMed] [Google Scholar]
- Berson DM, Castrucci AM, Provencio I. Morphology and mosaics of melanopsin-expressing retinal ganglion cell types in mice. J Comp Neurol. 2010;518:2405–2422. doi: 10.1002/cne.22381. [DOI] [PMC free article] [PubMed] [Google Scholar]
- Chen SK, Badea TC, Hattar S. Photoentrainment and pupillary light reflex are mediated by distinct populations of ipRGCs. Nature. 2011;476:92–95. doi: 10.1038/nature10206. [DOI] [PMC free article] [PubMed] [Google Scholar]
- Coombs JL, Van Der List D, Chalupa LM. Morphological properties of mouse retinal ganglion cells during postnatal development. J Comp Neurol. 2007;503:803–814. doi: 10.1002/cne.21429. [DOI] [PubMed] [Google Scholar]
- Do MT, Kang SH, Xue T, Zhong H, Liao HW, Bergles DE, Yau KW. Photon capture and signalling by melanopsin retinal ganglion cells. Nature. 2009;457:281–287. doi: 10.1038/nature07682. [DOI] [PMC free article] [PubMed] [Google Scholar]
- Ecker JL, Dumitrescu ON, Wong KY, Alam NM, Chen SK, LeGates T, Renna JM, Prusky GT, Berson DM, Hattar S. Melanopsin-expressing retinal ganglion-cell photoreceptors: cellular diversity and role in pattern vision. Neuron. 2010;67:49–60. doi: 10.1016/j.neuron.2010.05.023. [DOI] [PMC free article] [PubMed] [Google Scholar]
- Estevez ME, Fogerson PM, Ilardi MC, Borghuis BG, Chan E, Weng S, Auferkorte ON, Demb JB, Berson DM. Form and function of the M4 cell, an intrinsically photosensitive retinal ganglion cell type contributing to geniculocortical vision. J Neurosci. 2012;32:13608–13620. doi: 10.1523/JNEUROSCI.1422-12.2012. [DOI] [PMC free article] [PubMed] [Google Scholar]
- Furuta Y, Lagutin O, Hogan BL, Oliver GC. Retina- and ventral forebrain-specific Cre recombinase activity in transgenic mice. Genesis. 2000;26:130–132. doi: 10.1002/(SICI)1526-968X(200002)26:2<130::AID-GENE9>3.0.CO%3B2-I. [DOI] [PubMed] [Google Scholar]
- Gan L, Wang SW, Huang Z, Klein WH. POU domain factor Brn-3b is essential for retinal ganglion cell differentiation and survival but not for initial cell fate specification. Dev Biol. 1999;210:469–480. doi: 10.1006/dbio.1999.9280. [DOI] [PubMed] [Google Scholar]
- Gooley JJ, Lu J, Fischer D, Saper CB. A broad role for melanopsin in nonvisual photoreception. J Neurosci. 2003;23:7093–7106. doi: 10.1523/JNEUROSCI.23-18-07093.2003. [DOI] [PMC free article] [PubMed] [Google Scholar]
- Hannibal J. Regulation of melanopsin expression. Chronobiol Int. 2006;23:159–166. doi: 10.1080/07420520500464544. [DOI] [PubMed] [Google Scholar]
- Hannibal J, Georg B, Hindersson P, Fahrenkrug J. Light and darkness regulate melanopsin in the retinal ganglion cells of the albino Wistar rat. J Mol Neurosci. 2005;27:147–155. doi: 10.1385/JMN:27:2:147. [DOI] [PubMed] [Google Scholar]
- Hattar S, Liao HW, Takao M, Berson DM, Yau KW. Melanopsin-containing retinal ganglion cells: architecture, projections, and intrinsic photosensitivity. Science. 2002;295:1065–1070. doi: 10.1126/science.1069609. [DOI] [PMC free article] [PubMed] [Google Scholar]
- Hattar S, Kumar M, Park A, Tong P, Tung J, Yau KW, Berson DM. Central projections of melanopsin-expressing retinal ganglion cells in the mouse. J Comp Neurol. 2006;497:326–349. doi: 10.1002/cne.20970. [DOI] [PMC free article] [PubMed] [Google Scholar]
- Hu C, Hill DD, Wong KY. Intrinsic physiological properties of the five types of mouse ganglion-cell photoreceptors. J Neurophysiol. 2013;109:1876–1889. doi: 10.1152/jn.00579.2012. [DOI] [PMC free article] [PubMed] [Google Scholar]
- Kiyama T, Li H, Gupta M, Lin YP, Chuang AZ, Otteson DC, Wang SW. Distinct neurogenic potential in the retinal margin and the pars plana of mammalian eye. J Neurosci. 2012;32:12797–12807. doi: 10.1523/JNEUROSCI.0118-12.2012. [DOI] [PMC free article] [PubMed] [Google Scholar]
- La Morgia C, Ross-Cisneros FN, Sadun AA, Hannibal J, Munarini A, Mantovani V, Barboni P, Cantalupo G, Tozer KR, Sancisi E, Salomao SR, Moraes MN, Moraes-Filho MN, Heegaard S, Milea D, Kjer P, Montagna P, Carelli V. Melanopsin retinal ganglion cells are resistant to neurodegeneration in mitochondrial optic neuropathies. Brain. 2010;133:2426–2438. doi: 10.1093/brain/awq155. [DOI] [PMC free article] [PubMed] [Google Scholar]
- Lin B, Wang SW, Masland RH. Retinal ganglion cell type, size, and spacing can be specified independent of homotypic dendritic contacts. Neuron. 2004;43:475–485. doi: 10.1016/j.neuron.2004.08.002. [DOI] [PubMed] [Google Scholar]
- Lucas RJ, Douglas RH, Foster RG. Characterization of an ocular photopigment capable of driving pupillary constriction in mice. Nat Neurosci. 2001;4:621–626. doi: 10.1038/88443. [DOI] [PubMed] [Google Scholar]
- Lucas RJ, Hattar S, Takao M, Berson DM, Foster RG, Yau KW. Diminished pupillary light reflex at high irradiances in melanopsin-knockout mice. Science. 2003;299:245–247. doi: 10.1126/science.1077293. [DOI] [PubMed] [Google Scholar]
- Mao CA, Kiyama T, Pan P, Furuta Y, Hadjantonakis AK, Klein WH. Eomesodermin, a target gene of Pou4f2, is required for retinal ganglion cell and optic nerve development in the mouse. Development. 2008;135:271–280. doi: 10.1242/dev.009688. [DOI] [PMC free article] [PubMed] [Google Scholar]
- Marsh J, Bryant D, MacDonald SJ, Naudie D, Remtulla A, McCalden R, Howard J, Bourne R, McAuley J. Are patients satisfied with a web-based followup after total joint arthroplasty? Clin Orthop Relat Res. 2014;472:1972–1981. doi: 10.1007/s11999-014-3514-0. [DOI] [PMC free article] [PubMed] [Google Scholar]
- Masland RH. The neuronal organization of the retina. Neuron. 2012;76:266–280. doi: 10.1016/j.neuron.2012.10.002. [DOI] [PMC free article] [PubMed] [Google Scholar]
- McNeill DS, Sheely CJ, Ecker JL, Badea TC, Morhardt D, Guido W, Hattar S. Development of melanopsin-based irradiance detecting circuitry. Neural Dev. 2011;6:8. doi: 10.1186/1749-8104-6-8. [DOI] [PMC free article] [PubMed] [Google Scholar]
- Morin LP, Blanchard JH, Provencio I. Retinal ganglion cell projections to the hamster suprachiasmatic nucleus, intergeniculate leaflet, and visual midbrain: bifurcation and melanopsin immunoreactivity. J Comp Neurol. 2003;465:401–416. doi: 10.1002/cne.10881. [DOI] [PubMed] [Google Scholar]
- Mu X, Fu X, Beremand PD, Thomas TL, Klein WH. Gene regulation logic in retinal ganglion cell development: Isl1 defines a critical branch distinct from but overlapping with Pou4f2. Proc Natl Acad Sci U S A. 2008;105:6942–6947. doi: 10.1073/pnas.0802627105. [DOI] [PMC free article] [PubMed] [Google Scholar]
- Ono E, Tomioka Y, Taharaguchi S. Possible roles of transcription factors of pseudorabies virus in neuropathogenicity. Fukuoka Igaku Zasshi. 2007;98:364–372. [PubMed] [Google Scholar]
- Panda S, Sato TK, Castrucci AM, Rollag MD, DeGrip WJ, Hogenesch JB, Provencio I, Kay SA. Melanopsin (Opn4) requirement for normal light-induced circadian phase shifting. Science. 2002;298:2213–2216. doi: 10.1126/science.1076848. [DOI] [PubMed] [Google Scholar]
- Peirson SN, Halford S, Foster RG. The evolution of irradiance detection: melanopsin and the non-visual opsins. Philos Trans R Soc Lond B Biol Sci. 2009;364:2849–2865. doi: 10.1098/rstb.2009.0050. [DOI] [PMC free article] [PubMed] [Google Scholar]
- Provencio I, Cooper HM, Foster RG. Retinal projections in mice with inherited retinal degeneration: implications for circadian photoentrainment. J Comp Neurol. 1998a;395:417–439. doi: 10.1002/(SICI)1096-9861(19980615)395:4<417::AID-CNE1>3.0.CO%3B2-4. [DOI] [PubMed] [Google Scholar]
- Provencio I, Jiang G, De Grip WJ, Hayes WP, Rollag MD. Melanopsin: an opsin in melanophores, brain, and eye. Proc Natl Acad Sci U S A. 1998b;95:340–345. doi: 10.1073/pnas.95.1.340. [DOI] [PMC free article] [PubMed] [Google Scholar]
- Provencio I, Rodriguez IR, Jiang G, Hayes WP, Moreira EF, Rollag MD. A novel human opsin in the inner retina. J Neurosci. 2000;20:600–605. doi: 10.1523/JNEUROSCI.20-02-00600.2000. [DOI] [PMC free article] [PubMed] [Google Scholar]
- Provencio I, Rollag MD, Castrucci AM. Photoreceptive net in the mammalian retina. This mesh of cells may explain how some blind mice can still tell day from night. Nature. 2002;415:493. doi: 10.1038/415493a. [DOI] [PubMed] [Google Scholar]
- Qiu F, Jiang H, Xiang M. A comprehensive negative regulatory program controlled by Brn3b to ensure ganglion cell specification from multipotential retinal precursors. J Neurosci. 2008;28:3392–3403. doi: 10.1523/JNEUROSCI.0043-08.2008. [DOI] [PMC free article] [PubMed] [Google Scholar]
- Remtulla S, Hallett PE. A schematic eye for the mouse, and comparisons with the rat. Vision Res. 1985;25:21–31. doi: 10.1016/0042-6989(85)90076-8. [DOI] [PubMed] [Google Scholar]
- Rockhill RL, Daly FJ, MacNeil MA, Brown SP, Masland RH. The diversity of ganglion cells in a mammalian retina. J Neurosci. 2002;22:3831–3843. doi: 10.1523/JNEUROSCI.22-09-03831.2002. [DOI] [PMC free article] [PubMed] [Google Scholar]
- Schmid B, Helfrich-Förster C, Yoshii T. A new ImageJ plug-in “ActogramJ” for chronobiological analyses. J Biol Rhythms. 2011;26:464–467. doi: 10.1177/0748730411414264. [DOI] [PubMed] [Google Scholar]
- Schmidt TM, Kofuji P. Functional and morphological differences among intrinsically photosensitive retinal ganglion cells. J Neurosci. 2009;29:476–482. doi: 10.1523/JNEUROSCI.4117-08.2009. [DOI] [PMC free article] [PubMed] [Google Scholar]
- Schmidt TM, Chen SK, Hattar S. Intrinsically photosensitive retinal ganglion cells: many subtypes, diverse functions. Trends Neurosci. 2011a;34:572–580. doi: 10.1016/j.tins.2011.07.001. [DOI] [PMC free article] [PubMed] [Google Scholar]
- Schmidt TM, Do MT, Dacey D, Lucas R, Hattar S, Matynia A. Melanopsin-positive intrinsically photosensitive retinal ganglion cells: from form to function. J Neurosci. 2011b;31:16094–16101. doi: 10.1523/JNEUROSCI.4132-11.2011. [DOI] [PMC free article] [PubMed] [Google Scholar]
- Sexton TJ, Golczak M, Palczewski K, Van Gelder RN. Melanopsin is highly resistant to light and chemical bleaching in vivo. J Biol Chem. 2012;287:20888–20897. doi: 10.1074/jbc.M111.325969. [DOI] [PMC free article] [PubMed] [Google Scholar]
- Shi M, Kumar SR, Motajo O, Kretschmer F, Mu X, Badea TC. Genetic interactions between Brn3 transcription factors in retinal ganglion cell type specification. PLoS One. 2013;8:e76347. doi: 10.1371/journal.pone.0076347. [DOI] [PMC free article] [PubMed] [Google Scholar]
- Siegert S, Cabuy E, Scherf BG, Kohler H, Panda S, Le YZ, Fehling HJ, Gaidatzis D, Stadler MB, Roska B. Transcriptional code and disease map for adult retinal cell types. Nat Neurosci. 2012;15:487–495. S1–S2. doi: 10.1038/nn.3032. [DOI] [PubMed] [Google Scholar]
- Sollars PJ, Smeraski CA, Kaufman JD, Ogilvie MD, Provencio I, Pickard GE. Melanopsin and non-melanopsin expressing retinal ganglion cells innervate the hypothalamic suprachiasmatic nucleus. Vis Neurosci. 2003;20:601–610. doi: 10.1017/S0952523803206027. [DOI] [PubMed] [Google Scholar]
- Sweeney NT, Tierney H, Feldheim DA. Tbr2 is required to generate a neural circuit mediating the pupillary light reflex. J Neurosci. 2014;34:5447–5453. doi: 10.1523/JNEUROSCI.0035-14.2014. [DOI] [PMC free article] [PubMed] [Google Scholar]
- Taharaguchi S, Kon Y, Yoshino S, Ono E. Impaired development of the cerebellum in transgenic mice expressing the immediate-early protein IE180 of pseudorabies virus. Virology. 2003;307:243–254. doi: 10.1016/S0042-6822(02)00062-4. [DOI] [PubMed] [Google Scholar]
- Venturini C, Nag A, Hysi PG, Wang JJ, Wong TY, Healey PR, Mitchell P, Hammond CJ, Viswanathan AC, Wellcome Trust Case Control Consortium, BGG Clarifying the role of ATOH7 in glaucoma endophenotypes. Br J Ophthalmol. 2014;98:562–566. doi: 10.1136/bjophthalmol-2013-304080. [DOI] [PubMed] [Google Scholar]
- Völgyi B, Chheda S, Bloomfield SA. Tracer coupling patterns of the ganglion cell subtypes in the mouse retina. J Comp Neurol. 2009;512:664–687. doi: 10.1002/cne.21912. [DOI] [PMC free article] [PubMed] [Google Scholar]
- Wang SW, Gan L, Martin SE, Klein WH. Abnormal polarization and axon outgrowth in retinal ganglion cells lacking the POU-domain transcription factor Brn-3b. Mol Cell Neurosci. 2000;16:141–156. doi: 10.1006/mcne.2000.0860. [DOI] [PubMed] [Google Scholar]
- Xue T, Do MT, Riccio A, Jiang Z, Hsieh J, Wang HC, Merbs SL, Welsbie DS, Yoshioka T, Weissgerber P, Stolz S, Flockerzi V, Freichel M, Simon MI, Clapham DE, Yau KW. Melanopsin signalling in mammalian iris and retina. Nature. 2011;479:67–73. doi: 10.1038/nature10567. [DOI] [PMC free article] [PubMed] [Google Scholar]


