

Abstract
Hippocampal place responses can be prospectively or retrospectively modulated by the animal's future or prior trajectory. Two main hypotheses explain this. The “multiple-map hypothesis” switches between different maps for different trajectories (rate remapping). In contrast, in the “buffer hypothesis,” the hippocampus encodes an ongoing representation that includes the recent past and/or the impending future choice. This study examines the distribution of prospective and retrospective responses distributed along a common path in a continuous T-maze (providing all four combinations of provenance and destination) during a visual discrimination task. The multiple-map hypothesis predicts either uniform distributions or concerted shifts about a task-decision relevant point, whereas the buffer hypothesis predicts a time-limited overexpression around choice points (with retrospective responses after the central arm entry point and prospective responses nearer its exit). Here bilateral recordings in the dorsal CA1 region of the rat hippocampus show that retrospective responses were twice as prevalent as prospective responses. Furthermore, retrospective and prospective modulations have distinct spatial distributions, with retrospective primarily in the first two-thirds of the central arm and prospective restricted to the last third. To test for possible trial-by-trial remapping in relation to the two-thirds transition point, data from the first and second halves of the sessions were compared. Backward drift of path-modulated activity was significant only for retrospective, but not prospective, fields. Thus, these data are more consistent with the buffer hypothesis. Retrospective and prospective modulation would then participate in a single hippocampal representation of spatial and behavioral context.
Keywords: extracellular recording, hippocampus, navigation, place cell, prospective, retrospective
Introduction
Hippocampal neuronal responses are correlated with the spatial position of the animal (O'Keefe and Dostrovsky, 1971). This activity can be modulated by the rat's current trajectory (Wood et al., 2000; Griffin et al., 2007), which is of particular interest for solving Markovian decision problems, requiring the memory of the immediate past and projecting to the imminent future (Foster and Knierim, 2012).
Two different hypotheses could explain trajectory-modulated activity (Griffin and Hallock, 2013). The “multiple-map hypothesis” (McNaughton et al., 1996; Redish, 2001) switches reference frames between trajectories. “Remapping” refers to hippocampal place response changes when the animal experiences substantial environmental changes (Thompson and Best, 1989; Muller, 1996; Fig. 1B). Trajectory-dependent modulation would then correspond to “rate remapping” (Leutgeb et al., 2005; Wills et al., 2005), where the firing field location remains unchanged, but the firing rate varies. On the other hand, the trajectory-modulated activity could be seen as the result of a time-limited integration (Morris, 2006) of other contextual information into the current spatial representation (O'Keefe and Nadel, 1978; Wood et al., 2000; Ferbinteanu and Shapiro, 2003; Smith and Mizumori, 2006). Indeed, there is substantial support in the literature for a role of the hippocampus in working memory (Olton et al., 1979; Axmacher et al., 2007), particularly in representing sequential behaviors (Wiener, 1996). We will refer to this as the “buffer hypothesis” as it is dynamically dependent on salient events surrounding the immediate experience.
Figure 1.

Experimental design and predictive hypotheses. A, Schemas of the task. Four possible trajectories (in green) lead to a water reward (blue ovals) in the continuous T-maze. The dark screen indicates the goal location. The red arrow and black dashed line represent the photobeam triggering the screen cue. B, Buffer hypothesis prediction. Retrospective modulation (orange) would diminish with distance from the previous choice, with prospective modulation (purple) increasing as the rat approaches the next choice point. C–E, Remapping hypothesis predictions. C, The maze is represented by two triangular maps overlapping in the central arm. Stable switching (black arrows) between maps at a single locus triggered by the cue and/or decision signals (red arrow and dashed line) is shown. Retrospective responses occur before this and prospective responses afterward so that only one map is engaged at any given time and place. D, Like C but with remapping occurring at random points (only three are shown). Retrospective and prospective activities are uniformly distributed along the common path. E, Like D, but prospective activity only appears after a delay for cue/decision signal appearance.
Trajectory-dependent activity can be modulated by either the destination of the animal (prospectively) or by its provenance (retrospectively; Frank et al., 2000; Wood et al., 2000; Ferbinteanu and Shapiro, 2003). The two hypotheses would predict different distributions along a common path joining different paths.
The buffer hypothesis would predict prospective and retrospective modulations to be distributed, respectively, at the end and at the beginning of the common path (Fig. 1B). Because of the time-limited nature of the representation, the retrospective modulation should diminish after the rat is distant from the entry point, whereas prospective modulation would only start as the rat makes the decision for and approaches the next choice point. In contrast, various forms of the multiple-map hypothesis would predict other distinct distributions and incidences of retrospective and prospective modulation (Fig. 1; detailed in Discussion).
To validate these hypotheses, we examined the incidence and distribution of hippocampal trajectory-dependent activities along the central arm in a continuous T-maze. A visual discrimination (VD) task provided four possible trajectories, allowing identification of retrospective and prospective activity, in contrast with previous work using alternation (ALT) tasks (Wood et al., 2000). Furthermore, in contrast with the plus-maze (Ferbinteanu and Shapiro, 2003) that detects retrospective and prospective modulations only on goal or start arms, respectively, this paradigm can determine their relative and overlapping distributions.
Materials and Methods
Animals.
Three male Long–Evans rats (275–325 g; CERJ) were handled daily after arrival. Food was restricted to 14 g of rat chow per day (the normal daily requirement), whereas access to water was restricted to a 20–30 min period daily to maintain 85% normal body weight. Rats were rehydrated for one full day at the beginning of weekends. Water restriction was ended if rats showed any sign of illness, excessive or poor grooming, or other atypical behaviors.
Housing facilities and experimental protocols followed institutional (CNRS Comité Opérationnel pour l'Ethique dans les Sciences de la Vie) and international (Directive 86/609/EEC; ESF-EMRC position paper 2010/63/EU; NIH guidelines) standards and legal regulations (certificate number 7186, Ministère de l'Agriculture et de la Pêche) regarding the use and care of laboratory animals.
Apparatus and behavioral task.
The T-maze central stem and top alley were 1 m long and 8 cm wide, with 2-cm-high borders. It had return arms (Wood et al., 2000) and was automated, permitting rats to perform successive trials continuously (Catanese et al., 2012). The rat autonomously initiated each trial by exiting a return arm. There, a photodetector triggered a white striped visual cue to appear on a video screen behind one goal site indicating that the other site with the unlit monitor would provide 60 μl of 0.5% saccharin water (Fig. 1). Crossing the photodetector on the reward arm triggered cue extinction and, when merited, reward delivery. Cue position was pseudorandom: the same arm was not rewarded more than four times successively and left–right alternation was also limited to four successive trials. Thus, consistent rewards could not be obtained with working memory strategies.
Training.
Rats were first familiarized with the maze for 5–7 d. Barriers prevented backtracking early in training. Choices were never forced. VD task training typically lasted 2 weeks until criterion performance of 80% was reached on 3 consecutive days. Then rats were also trained in a continuous ALT task in the absence of visual cues or in the ALT task intermittently interrupted by VD trials [reported by Catanese et al. (2012)]. Sessions with VD trials only are reported here.
Surgery.
After training, rats were rehydrated for several days, then tranquillized with an intramuscular injection of xylazine (Rompun, 0.1 ml) and deeply anesthetized with an intraperitoneal injection of sodium pentobarbital (40 mg/kg), with additional doses hourly or as needed. Body temperature was maintained at 38°C. The animal was fixed in a stereotaxic instrument with dull ear bars. Xylocaine solution was injected under the scalp, which was then incised and retracted to expose the skull surface. Jeweler's screws were inserted and fixed with dental cement. The multiple electrodes (connected to a multiple microdrive assembly) were implanted above CA1 (AP, 3.5 mm; ML, 2.5 mm relative to bregma; depth, 1.5 mm). A conical screen of fine copper mesh was fixed around the headstage to reduce electrical and mechanical artifacts. One to two weeks after surgery recovery, animals were retrained in VD until returning to 80% correct performance; then recording experiments commenced.
Electrophysiological recording.
The multichannel microdrive (Fig. 2, top right) included 16 independently drivable tetrodes (four twisted, insulated, 12.5-μm-diameter nichrome wires, gold plated to 300–500 KΩ impedances). Tetrodes were lowered gradually until reaching the pyramidal cell layer (Fig. 2, top left). The headstage was connected to two 32-channel unity-gain preamplifiers (Noted Bt; Pécs). Signals were amplified 1000×, filtered between 1 and 9000 Hz (Lynx-8; Neuralynx), digitized at 20 kHz, and stored (Power1401; CED). Two LEDs were mounted above the headstage (video sampling at 30 Hz). KlustaKwik and Klusters (klusters.sourceforge.net) isolated single-unit activity. Cells were discarded for Mahalanobis distances <10 and/or autocorrelograms with incidences of spikes in the refractory period (2 ms) exceeding 0.5%. Neurons were eliminated from analyses if average firing rates in reward and return arms exceeded 0.5 Hz, action potential duration from the peak to baseline return was <0.3 ms, or autocorrelogram values at ±300 ms exceeded 70% of the maximum (Fig. 2). Only those principal neurons with discharge rates exceeding 1 Hz in the central arm were considered for further analysis. To confirm recording sites, electrolytic marking lesions (cathodal current: 20 μA, 10 s) were applied to each tetrode. A lethal dose of pentobarbital was administered; then intraventricular perfusion was performed with a formalin–saline solution (10% v/v), and 50 μm frozen sections were stained with cresyl violet.
Figure 2.

Recording and analysis. Top left, The pyramidal cell layer was identified by the presence of ripples (high-frequency local field potential oscillations). Top right, The 16-tetrode microdrive headstage. Bottom, Distinctions between putative interneurons (first row) and principal neurons (second row; examples). Left column, Firing rate distribution. Hot colors indicate higher average firing. Middle column, Autocorrelations. Right column, Spike width measures (ordinate in microvolts).
Analysis and statistics.
Each trial was labeled LR, RL, LL, or RR corresponding to previous and current left–right choices. Only rewarded trials were analyzed. Trials were then grouped and compared either by provenance ([LL,LR] vs [RR,RL]) or by destination ([LL,RL] vs [RR,LR]) for determining retrospective and prospective modulation, respectively. In Figure 3, “difference L-R” refers to either comparison, permitting retrospective (orange; [LL,LR] − [RR,RL]) and prospective (violet; [LL,RL] − [RR,LR]) modulations to both be represented.
Figure 3.
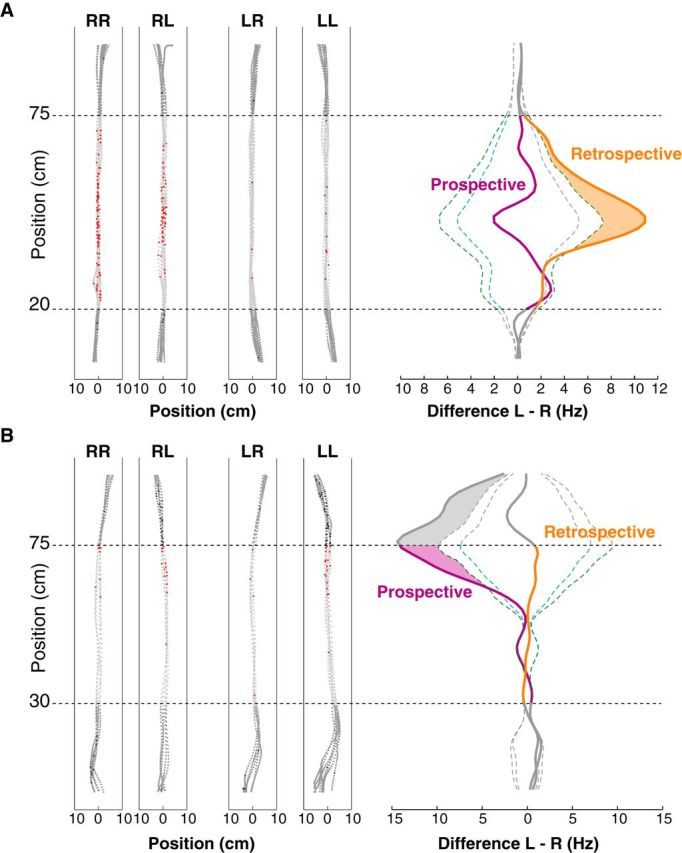
Examples of trajectory-modulated activity in CA1 place responses. A, Retrospective modulation. Left, Action potentials (red dots) superimposed on position samples of the four types of trajectories (RR, RL, LR, LL) along the central arm of the T-maze. Gray dots are position samples. Right, Left minus right differences (FfrdD) for prospective (purple trace) and retrospective (orange trace) analyses. The inner dashed blue line is the global confidence limit (α = 0.05) derived from the Monte Carlo bootstrap analysis, and the outer dashed green line is the pointwise confidence limit. The shaded zone corresponds to the significant retrospective activity; the prospective activity is not significant. Horizontal dashed lines delimit the zone where trajectories did not diverge. Data outside this zone is dark gray. B, Prospective modulation with the significant zone shaded in purple.
Analyses compared spike density functions to obtain the function of firing rate difference (FfrD) for both prospective and retrospective groups (Fujisawa et al., 2008; Catanese et al., 2012). We determined statistical threshold by 5000 randomly bootstrapped permutations of the data. If the FfrD (Fig. 3, orange trace) exceeded the global and pointwise bootstrapped confidence interval limits (Fig. 3, dashed lines), then it was considered significantly different from chance. This nonparametric method was selected since it requires no assumptions about the underlying distribution of the data set; rather, it is suited for any such distribution, which could vary between cells, sessions, and animals. Furthermore, it permits smaller bin sizes, providing greater spatial resolution than comparable approaches.
Segments of the maze where paths diverged significantly were identified similarly using the bootstrap analysis of Fujisawa et al. (2008). Speed and head-direction differences on compared trajectories were examined with a t test (p < 0.05).
Results
In the 19 sessions where well discriminated neurons were recorded, the rats' performance level in the VD task was 95.0 ± 5.8% correct, with no errors in eight of these sessions. Principal neurons constituted 893 of the total of 1106 recorded neurons. Of these, 239 had firing rates >1 spike/s in the central arm of the T-maze. Thirty-two cells were excluded because in those sessions, the respective trajectory types had differences in lateral position, head direction, or speed. In 80 (38%) of the remaining units, there was trajectory-modulated activity, with 58 (72%) of these retrospective and 22 (28%) prospective.
Figure 3 shows examples of retrospectively and prospectively modulated activity with raw data for each trajectory type and results of the Monte Carlo bootstrap analysis indicating where retrospective or prospective activity significantly exceeded the confidence limits. Data before the 25 cm mark and after the 75 cm mark were excluded because of divergent paths.
Figure 4 shows the distributions of prospective (violet) and retrospective (orange) responses. For each 1.75 cm segment of the central arm, Figure 4 indicates the proportion and number of cells that were significantly retrospective or prospective there (of the 239 cells active in the central arm). The two distributions are clearly distinct, with minor overlap between 55 and 75 cm. There is only retrospective activity on the first half of the central arm, whereas prospective activity is prevalent in the last third (beyond 65 cm) of the central arm. Indeed, the center of mass of the distribution of retrospective responses was at 31.1 ± 3.9 cm along the central arm, significantly different from the center of mass of prospective cells at 69.6 ± 3.9 cm (p = 1.19E-11, two-tailed Wilcoxon–Mann–Whitney test).
Figure 4.

Distribution of retrospective and prospective activities along the central arm of the maze. A, Top, Counts of retrospectively (orange) and prospectively (violet) modulated activity. Bin width, 1.75 cm. Bottom, Individual cell responses (one field per row). Bars represent the extent of significant retrospective or prospective activities. B, C, Data from individual rats show the same tendencies (Rat 1 is not shown, but is consistent with the others, with prospective cells after 58 cm only). D, To eliminate possible repeated recordings of the same neurons across different sessions, data from each tetrode are shown for only one day (when it yielded the maximum number of cells). The distributions of retrospective and prospective fields' center of masses remain significantly different (p = 5.5E-7, two-tailed Wilcoxon–Mann–Whitney test).
If there were consistent remapping at a fixed point on the common path (Fig. 1C), the drifts of place fields over the course of the recording session observed by Mehta et al. (1997) should be the same for prospectively and retrospectively modulated fields. We repeated the analyses independently for data from the first and second halves of each session (referred to as “early” and “late” groups of trials). The centers of mass of the retrospectively modulated cells drifted backward by 1.4 ± 0.3 cm between the early and late trials (significantly different from zero; p = 3.2E-4, Wilcoxon signed rank test), whereas prospectively modulated cells shifted only 0.2 ± 0.3 cm, not significantly different from zero (p = 0.93, Wilcoxon signed rank test). If there were consistent remapping at a point on the central arm, both distributions should have shifted together and in the same direction. Instead, the shifts observed were significantly different between retrospective and prospective distributions (p = 0.035, two-tailed Mann–Whitney U test). Thus, the intrasession drifts of retrospective but not prospective activity is more consistent with the buffer hypothesis.
Discussion
The main novel observation here is the distinct but overlapping distributions of retrospective and prospective modulations of hippocampal CA1 principal neurons along a common path joining two distinct paths. In this continuous T-maze, the retrospective modulation dominated the first half of the central arm and was twice as prevalent as prospective activity, which dominated the last third. In the intermediate zone, the two distributions overlapped in similar proportions, although some retrospective fields extended to the 75 cm limit. Prospective and retrospective centers of mass were separated by 38.5 cm, consistent with the buffer hypothesis that proposes that the trajectory-modulated activity is a time-limited representation of the ongoing experience. Considering this modulation as contextual rather than a spatial representation (Wood et al., 2000), information about the arrival path would be more relevant after entry into the common path than when exiting it. This would maintain the most recent trajectory (i.e., left or right) in the working memory buffer (Baddeley, 2000). Similarly, it would be more relevant for a contextual buffering representation to have prospective modulation where the future choice is imminent.
In one version of the remapping hypothesis (Fig. 1C), entry into the central arm and the simultaneous visual cue presentation there could have consistently triggered remapping at a single point on the central arm, perhaps with a delay for cue or decision signal transmission. (Before this point, prospective activity might reflect a possible spontaneous choice by the rat before arrival of cue signals.) Since in situations where there are no cue conflicts the hippocampal neuron population only represents a single map at a time, after this point only the two prospective maps (and the corresponding remapping/modulation) would appear (Olypher et al., 2002; Jackson and Redish, 2007; note that “overdispersion,” i.e., shifting between two hippocampal representations, occurs more rapidly than the delay between sequential arrivals of our rats at the central arm, and these too would be expected to be uniformly distributed in space). Our observations of an overlap between retrospective and prospective modulation and the inexplicably late appearance of prospective activity are inconsistent with this. Furthermore, the backward drift of retrospectively but not prospectively modulated fields is also incongruent with remapping. The backward shift of the retrospective fields is consistent with observations in rats running on triangular and rectangular tracks (Mehta et al., 1997), whereas the failure of prospective fields to drift supports their role as a contextual buffer with the impending behavioral choice overcoming any backward shift.
Alternatively, if the trajectory-dependent responses corresponded to rate remapping at a position along the central arm that changed unpredictably on each trial (Fig. 1D), uniform distributions of prospective and retrospective responses would have been expected since both global and rate remappings occur rapidly and both maps have homogeneous representations before and after the switch (Muller, 1996; Leutgeb et al., 2005; Wills et al., 2005; Jezek et al., 2011). If the rat had not made a spontaneous choice before cue onset, there would be no prospective modulation until the decision signal could be integrated into prospectively modulated responses (Fig. 1E). Only retrospective responses would appear during this delay, and retrospective and prospective responses would be uniformly distributed afterward. However, in a version of this same maze with cue onset at the 50 cm point (Catanese et al., 2012), prospective responses began 300 ms after cue presentation. Rats ran at 35–45 cm/s and thus traversed a distance of about 12 cm between cue onset and decision signal appearance. In contrast, prospective responses did not appear until much later, at least 55 cm after cue presentation. This failure to observe prospective responses earlier on the central arm is not attributable to insufficient sampling since numerous retrospective responses were observed before this point.
We observed a disproportionate incidence of retrospective (26%) relative to prospective (11%) responses, confirming the results of Ferbinteanu et al. (2011) in a plus-maze with 42% retrospective and 23% prospective. The functional significance of this is unclear. Surprisingly, a similar result has been observed in ensembles of eye-movement directional neurons in the dorsolateral prefrontal cortex of monkey (homolog of rat mPFC): “the majority of directional delay-period activity represents retrospective information, whereas the minority represents prospective information” (Funahashi, 2006). Furthermore, as observed here, the retrospective representation preceded prospective fields. These similarities could reflect some common principle of representations of past and future events, or signaling shared between hippocampus and PFC (Ringo et al., 1994; Rolls et al., 1997; note that oculomotor correlates of hippocampal activity have been observed in primates). The PFC is strongly implicated in working memory and could be crucial to generate these time-limited activity modulations in the hippocampus. Supporting this, Ito et al. (2013) showed that optogenetic inactivation of the nucleus reuniens relay from PFC to hippocampus eradicates trajectory-dependent modulation. Behaviorally, Kesner (1989) showed that experimental lesion of the PFC induced significant impairment in switching from a retrospective to a prospective strategy in rats performing a win-shift task on a 12-arm radial maze.
These observations were possible only because the present task permits simultaneous and overlapping presence of retrospectively and prospectively modulated place activity along a common path. In contrast, the plus-maze paradigm (Ferbinteanu and Shapiro, 2003) only can identify prospective modulation in the start arm and retrospective modulation in the goal arm. Continuous alternation does not distinguish between retrospective and prospective activity, and the T-maze without return arms (Ainge et al., 2012; Griffin et al., 2012) and the multiple Y-maze (Ainge et al., 2007) require manual displacement of the animal from goal to start positions, interfering with retrospective modulation.
Is there a relationship between the successive distinct distributions of retrospective and prospective activities on the central arm and the observation by Gupta et al. (2012) that sequences of simultaneously recorded hippocampal place cell spike activity within a theta cycle could represent a segment of the environment located ahead of (prospective theta sequence) or behind (retrospective theta sequence) the rat? Their prospective sequences appeared during acceleration, which occurs at the beginning of the central arm in the continuous T-maze, where we observed retrospective modulation. The inverse discrepancy appears at the end of the central arm. Thus, it is unlikely that there is a relationship between prospective and retrospective activity in theta sequences and trajectory modulation of place responses.
Overall, the present results favor the buffer hypothesis over the multiple-map hypothesis. This buffer could be engaged for representing ongoing behavioral information for contextual coding and is also consistent with a role for the hippocampus in working memory (Olton et al., 1979; Pastalkova et al., 2008). A question for future research concerns the third quarter of the track, where there is indeed an overlap between the two representations. Does this overlap provide additional information for contextual representations? Does it extend further when the central arm is longer or running speeds are faster? If not, then this would indicate that this overlap is simply related to the persistence of the retrospective modulation over a fixed time period. Alternatively, the continued presence of overlap could be related to simultaneous representation of past, present, and future events.
Footnotes
This work was supported by the European Community [Grants FP6-IST-027819 (ICEA); FP6-IST-027140 (BACS)], Fondation pour la Recherche Médicale (Grant SPF20110421459, and Grant FDT20110922969 to J.C.), French Agence National pour la Recherche [Grant ANR-10-BLAN-02 (Neurobot)], Paris Neuroscience School (to E.C.), and Fondation Fyssen (to J.C.). We thank Alice Fruchart for animal care and perfusions; France Maloumian for help with figures; Suzette Doutremer for histology; Yves Dupraz for mechanical engineering; P. Leboucher for developing the automated visual stimulation system; Sebastien Rateau for electronic engineering; Prof. Matthijs van der Meer for very helpful suggestions and discussions; and Prof. Philippe Gaussier, and Drs. Mehdi Khamassi, Adrien Peyrache, and Karim Benchenane for helpful discussions.
The authors declare no competing financial interests.
References
- Ainge JA, Tamosiunaite M, Wörgötter F, Dudchenko PA. Hippocampal CA1 place cells encode intended destination on a maze with multiple choice points. J Neurosci. 2007;27:9769–9779. doi: 10.1523/JNEUROSCI.2011-07.2007. [DOI] [PMC free article] [PubMed] [Google Scholar]
- Ainge JA, Tamosiunaite M, Wörgötter F, Dudchenko PA. Hippocampal place cells encode intended destination, and not a discriminative stimulus, in a conditional T-maze task. Hippocampus. 2012;22:534–543. doi: 10.1002/hipo.20919. [DOI] [PubMed] [Google Scholar]
- Axmacher N, Mormann F, Fernández G, Cohen MX, Elger CE, Fell J. Sustained neural activity patterns during working memory in the human medial temporal lobe. J Neurosci. 2007;27:7807–7816. doi: 10.1523/JNEUROSCI.0962-07.2007. [DOI] [PMC free article] [PubMed] [Google Scholar]
- Baddeley A. The episodic buffer: a new component of working memory? Trends Cogn Sci. 2000;4:417–423. doi: 10.1016/S1364-6613(00)01538-2. [DOI] [PubMed] [Google Scholar]
- Catanese J, Cerasti E, Zugaro M, Viggiano A, Wiener SI. Dynamics of decision-related activity in hippocampus. Hippocampus. 2012;22:1901–1911. doi: 10.1002/hipo.22025. [DOI] [PubMed] [Google Scholar]
- Ferbinteanu J, Shapiro ML. Prospective and retrospective memory coding in the hippocampus. Neuron. 2003;40:1227–1239. doi: 10.1016/S0896-6273(03)00752-9. [DOI] [PubMed] [Google Scholar]
- Ferbinteanu J, Shirvalkar P, Shapiro ML. Memory modulates journey-dependent coding in the rat hippocampus. J Neurosci. 2011;31:9135–9146. doi: 10.1523/JNEUROSCI.1241-11.2011. [DOI] [PMC free article] [PubMed] [Google Scholar]
- Foster DJ, Knierim JJ. Sequence learning and the role of the hippocampus in rodent navigation. Curr Opin Neurobiol. 2012;22:294–300. doi: 10.1016/j.conb.2011.12.005. [DOI] [PMC free article] [PubMed] [Google Scholar]
- Frank LM, Brown EN, Wilson M. Trajectory encoding in the hippocampus and entorhinal cortex. Neuron. 2000;27:169–178. doi: 10.1016/S0896-6273(00)00018-0. [DOI] [PubMed] [Google Scholar]
- Fujisawa S, Amarasingham A, Harrison MT, Buzsáki G. Behavior-dependent short-term assembly dynamics in the medial prefrontal cortex. Nat Neurosci. 2008;11:823–833. doi: 10.1038/nn.2134. [DOI] [PMC free article] [PubMed] [Google Scholar]
- Funahashi S. Prefrontal cortex and working memory processes. Neuroscience. 2006;139:251–261. doi: 10.1016/j.neuroscience.2005.07.003. [DOI] [PubMed] [Google Scholar]
- Griffin AL, Hallock HL. Hippocampal signatures of episodic memory: evidence from single-unit recording studies. Front Behav Neurosci. 2013;7:54. doi: 10.3389/fnbeh.2013.00054. [DOI] [PMC free article] [PubMed] [Google Scholar]
- Griffin AL, Eichenbaum H, Hasselmo ME. Spatial representations of hippocampal CA1 neurons are modulated by behavioral context in a hippocampus-dependent memory task. J Neurosci. 2007;27:2416–2423. doi: 10.1523/JNEUROSCI.4083-06.2007. [DOI] [PMC free article] [PubMed] [Google Scholar]
- Griffin AL, Owens CB, Peters GJ, Adelman PC, Cline KM. Spatial representations in dorsal hippocampal neurons during a tactile-visual conditional discrimination task. Hippocampus. 2012;22:299–308. doi: 10.1002/hipo.20898. [DOI] [PubMed] [Google Scholar]
- Gupta AS, van der Meer MA, Touretzky DS, Redish AD. Segmentation of spatial experience by hippocampal θ sequences. Nat Neurosci. 2012;15:1032–1039. doi: 10.1038/nn.3138. [DOI] [PMC free article] [PubMed] [Google Scholar]
- Ito HT, Zhang S-J, Witter MP, Moser EI, Moser M-B. Trajectory-dependent firing in hippocampal place cells reflects nucleus reuniens-mediated input from the medial prefrontal cortex. Soc Neurosci Abstr. 2013;39 769.11. [Google Scholar]
- Jackson J, Redish AD. Network dynamics of hippocampal cell-assemblies resemble multiple spatial maps within single tasks. Hippocampus. 2007;17:1209–1229. doi: 10.1002/hipo.20359. [DOI] [PubMed] [Google Scholar]
- Jezek K, Henriksen EJ, Treves A, Moser EI, Moser MB. Theta-paced flickering between place-cell maps in the hippocampus. Nature. 2011;478:246–249. doi: 10.1038/nature10439. [DOI] [PubMed] [Google Scholar]
- Kesner RP. Retrospective and prospective coding information: role of the medial prefrontal cortex. Exp Brain Res. 1989;74:163–167. doi: 10.1007/BF00248289. [DOI] [PubMed] [Google Scholar]
- Leutgeb S, Leutgeb JK, Barnes CA, Moser EI, McNaughton BL, Moser MB. Independent codes for spatial and episodic memory in hippocampal neuronal ensembles. Science. 2005;309:619–623. doi: 10.1126/science.1114037. [DOI] [PubMed] [Google Scholar]
- McNaughton BL, Barnes CA, Gerrard JL, Gothard K, Jung MW, Knierim JJ, Kudrimoti H, Qin Y, Skaggs WE, Suster M, Weaver KL. Deciphering the hippocampal polyglot: the hippocampus as a path integration system. J Exp Biol. 1996;199:173–185. doi: 10.1242/jeb.199.1.173. [DOI] [PubMed] [Google Scholar]
- Mehta MR, Barnes CA, McNaughton BL. Experience-dependent, asymmetric expansion of hippocampal place fields. Proc Natl Acad Sci U S A. 1997;94:8918–8921. doi: 10.1073/pnas.94.16.8918. [DOI] [PMC free article] [PubMed] [Google Scholar]
- Morris RG. Elements of a neurobiological theory of hippocampal function: the role of synaptic plasticity, synaptic tagging and schemas. Eur J Neurosci. 2006;23:2829–2846. doi: 10.1111/j.1460-9568.2006.04888.x. [DOI] [PubMed] [Google Scholar]
- Muller R. A quarter of a century of place cells. Neuron. 1996;17:813–822. doi: 10.1016/S0896-6273(00)80214-7. [DOI] [PubMed] [Google Scholar]
- O'Keefe J, Dostrovsky J. The hippocampus as a spatial map. Preliminary evidence from unit activity in the freely-moving rat. Brain Res. 1971;34:171–175. doi: 10.1016/0006-8993(71)90358-1. [DOI] [PubMed] [Google Scholar]
- O'Keefe J, Nadel L. The hippocampus as a cognitive map. Oxford: Clarendon; 1978. [Google Scholar]
- Olton DS, Becker JT, Handelmann GE. A re-examination of the role of hippocampus in working memory. Behav Brain Sci. 1979;2:352–365. doi: 10.1017/S0140525X00063068. [DOI] [Google Scholar]
- Olypher AV, Lánský P, Fenton AA. Properties of the extra-positional signal in hippocampal place cell discharge derived from the overdispersion in location-specific firing. Neuroscience. 2002;111:553–566. doi: 10.1016/S0306-4522(01)00586-3. [DOI] [PubMed] [Google Scholar]
- Pastalkova E, Itskov V, Amarasingham A, Buzsáki G. Internally generated cell assembly sequences in the rat hippocampus. Science. 2008;321:1322–1327. doi: 10.1126/science.1159775. [DOI] [PMC free article] [PubMed] [Google Scholar]
- Redish AD. The hippocampal debate: are we asking the right questions? Behav Brain Res. 2001;127:81–98. doi: 10.1016/S0166-4328(01)00356-4. [DOI] [PubMed] [Google Scholar]
- Ringo JL, Sobotka S, Diltz MD, Bunce CM. Eye movements modulate activity in hippocampal, parahippocampal, and inferotemporal neurons. J Neurophysiol. 1994;71:1285–1288. doi: 10.1152/jn.1994.71.3.1285. [DOI] [PubMed] [Google Scholar]
- Rolls ET, Robertson RG, Georges-François P. Spatial view cells in the primate hippocampus. Eur J Neurosci. 1997;9:1789–1794. doi: 10.1111/j.1460-9568.1997.tb01538.x. [DOI] [PubMed] [Google Scholar]
- Smith DM, Mizumori SJ. Hippocampal place cells, context, and episodic memory. Hippocampus. 2006;16:716–729. doi: 10.1002/hipo.20208. [DOI] [PubMed] [Google Scholar]
- Thompson LT, Best PJ. Place cells and silent cells in the hippocampus of freely-behaving rats. J Neurosci. 1989;9:2382–2390. doi: 10.1523/JNEUROSCI.09-07-02382.1989. [DOI] [PMC free article] [PubMed] [Google Scholar]
- Wiener SI. Spatial, behavioral and sensory correlates of hippocampal CA1 complex spike cell activity: implications for information processing functions. Prog Neurobiol. 1996;49:335–361. doi: 10.1016/S0301-0082(96)00019-6. [DOI] [PubMed] [Google Scholar]
- Wills TJ, Lever C, Cacucci F, Burgess N, O'Keefe J. Attractor dynamics in the hippocampal representation of the local environment. Science. 2005;308:873–876. doi: 10.1126/science.1108905. [DOI] [PMC free article] [PubMed] [Google Scholar]
- Wood ER, Dudchenko PA, Robitsek RJ, Eichenbaum H. Hippocampal neurons encode information about different types of memory episodes occurring in the same location. Neuron. 2000;27:623–633. doi: 10.1016/S0896-6273(00)00071-4. [DOI] [PubMed] [Google Scholar]