

Abstract
Chemical cross-linking, together with mass spectrometry, is established as a powerful combination for probing subunit interactions within static protein assemblies. To probe conformational changes in response to stimuli we have developed a comparative cross-linking strategy, employing lysine-specific deuterated and non-deuterated BS3 cross-linking reagents. Here we describe the experimental procedures as well as the data analysis, validation and interpretation. Briefly the protocol involves first assigning cross-linked peptides in the complex without ligand binding, or with post-translational modifications (PTMs) at natural abundance, using a standard procedure employing labeled cross-linkers, proteolysis and subsequent assignment of cross-linked peptides following LC-MS/MS and database searching. An aliquot of the protein complex is then exposed to the stimulus, either ligand binding, or incubation with a phosphatase or kinase to bring about changes in PTMs. Two solutions, one containing the apo/untreated complex the other the enzymatically modified/ligand-bound complex, are then cross-linked independently. Typically non-deuterated BS3-d0 is used or the untreated complex and deuterated BS3-d4 is used for the experiment. The two aliquots are then incubated at equal concentration, digested and processed as before. The ratios of labeled and unlabeled cross-linked peptides then provide a direct readout of the effect of the stimulus. We exemplify our method by quantifying changes in subunit interactions induced by dephosphorylation of an ATP synthase. The protocol is however widely applicable for determining conformational changes in protein complexes induced by various stimuli including ligand/drug binding, oligomerization and other PTMs. Application of the established protocol takes ~9 days, including protein complex purification.
Keywords: Protein interactions, cross-linking, mass spectrometry, LC-MS, protein complex, conformational change, comparative cross-linking
INTRODUCTION
Proteins and their assemblies are the building blocks of the cell and form the basis of all cellular processes. To carry out their function, proteins often network with other proteins via transient associations. This aspect, coupled with individual protein dynamics, when binding to ligands, co-factors or substrates, increases the complexity of protein assemblies. Because of this complexity, numerous structural techniques have evolved to study protein-protein and protein-ligand interactions. One such technique, chemical cross-linking, has provided significant insights into the structural arrangement within a number of protein networks and assemblies including PP2A1, TriC/CCT2 and Pol II-TFIIF3. When chemical cross-linking is used in conjunction with non-denaturing (native) MS, for example in the structure elucidation of clustered regularly interspersedshort palindromic repeats(CRISPR), both subunit stoichiometry and interactions could be defined and, together with an electron microscopy density map, the first molecular model could be described4. These examples highlight the power of chemical cross-linking, particular in an integrative modeling strategy, when used in combination with other approaches5.
The basis of chemical cross-linking involves covalent linkage of two reactive groups of amino acid side chains, in close proximity, using bi-functional chemical reagents6, 7. Typically after cross-linking, proteins are hydrolysed using specific endoproteinases yielding a mixture of peptides and covalently-linked di-peptides which are then separated and analyzed by LC-MS/MS to yield sequence information. While peptide and protein identification by database searching is relatively straightforward, and underlies all current proteomics strategies8, data analysis of cross-linked di-peptides remains challenging. The number of possibilities for cross-linked di-peptides increases dramatically since different proteins or distal sequence regions can become covalently linked. This difficulty is partially alleviated by the introduction of stable-isotope labeled cross-linking reagents used in 1:1 ratios giving rise to pairs of peaks of equal intensity in mass spectra, facilitating identification and database searching9. When used in this way, chemical cross-linking has provided insights into the subunit arrangement within large protein assemblies, the length of the cross-linker defining a distance constraint that can be implemented in computational modeling1, 3. Typically however, chemical cross-linking defines subunit interactions within one conformation of a protein assembly, or an average of dynamic states populated in solution3, 10. To define conformational changes in response to post translational modifications (PTMs) or ligand binding, new methods are required which report on changes in subunit interactions or spatial proximity of reactive amino acid residues.
How are conformational changes in protein complexes analyzed by other structural techniques?
Protein interactions, studied using conventional structural techniques, such as X-ray crystallography, provide atomic insight into static interactions within protein assemblies11. Electron microscopy, with the advent of new detectors, is now capable of near atomic resolution12 and nuclear magnetic resonance spectroscopy is attractive since it is capable of reporting on an average of coexisting populations in solution13. Challenges remain however for these established structural biology approaches when studying large assemblies with high compositional and conformational heterogeneity.
Mass spectrometry in combination with other techniques such as ion mobility or hydrogen/deuterium exchange has provided new insights into dynamic conformational changes within heterogeneous protein complexes14-16. These studies usually include comparison of two experiments, one studying the protein complex in its native state (i.e in its wild-type, apo, untreated form) and a second experiment after the complex has undergone structural change, (i.e. upon ligand binding or removal of PTMs). In this manner, chemical cross-linking has been applied to study the effects of ligand binding17 and conformational changes associated with protein aggregation in solution18. By contrast ion mobility mass spectrometry is a gas phase separation method which has given insight into gross conformational changes that arise due to lipid/drug and DNA/RNA binding19-21. However IM-MS methods lack the sensitivity needed to define precise changes in subunit interactions or subtle conformational changes in protein folds.
A more sensitive approach than IM-MS involves the application of either hydrogen/deuterium exchange or hydroxyl radical footprinting in conjunction with MS. When carried out in a time dependent way, the level of modification (i.e. incorporation of deuterium to the protein backbone or oxidation of amino acid side chains) after different time intervals can be used to report on conformational change as a function of time16, 22. Many spectra are acquired and interpreted to reveal conformational dynamics of protein complexes. H/D exchange or hydroxyl radical footprinting methods compare protein complexes in different states, often in independent experiments. This can be time-consuming and requires reproducible instrument conditions (e.g. when different time-points are analyzed over a course of several minutes or hours). In addition only an indirect measurement of conformational change is provided. The extent of perturbation of subunit interfaces is therefore sometimes difficult to interpret directly from the data.
In this protocol we describe a further development in the application of chemical cross-linking that overcomes some of the limitations to the independent experiments described above. In a procedure which we termed ‘comparative chemical cross-linking’ we showed how we can probe conformational changes in protein complexes, specifically in the chloroplast ATPase23. We make use of stable-isotopically labeled cross-linking reagents to cross-link protein complexes independently in different conformations and to process these complexes within the same solution. Practically this is achieved by pooling equimolar aliquots of the two cross-linked protein complexes. Consequently both complexes are digested and analyzed together, enabling us to compare directly different conformational states in one experiment. Since our approach uses cross-linkers with different stable-isotopes it enables us to compare protein complexes and their responses to defined stimuli and to obtain quantitative values for protein interactions giving insights into the extent of conformational change.
How does comparative cross-linking work?
The first step in our protocol is to assign the cross-linked peptides in the complex without ligand binding or with natural abundance PTMs (Figure 1, step i). This is achieved by using a standard procedure employing labeled cross-linkers, proteolysis and subsequent assignment of cross-linked peptides. This assignment then provides the starting point for investigating change. For comparative cross-linking an aliquot of the protein complex is exposed to a stimulus, e.g. a ligand, or incubation with a phosphatase or kinase to bring about changes in PTMs. Solutions containing either the apo/untreated complex or enzymatically modified/ligand-bound complex are then cross-linked independently with BS3 (bis(sulfosuccinimidyl)suberate) typically non-deuterated BS3-d0 for the untreated complex and deuterated BS3-d4 for the experiment. Following cross-linking an aliquot of the BS3-d0 protein complex (control) is pooled with equal volumes of the BS3-d4 cross-linked complex in a 1:1 ratio (Figure 1, step ii) and processed together throughout sample preparation and LC-MS/MS analysis. Both protein complexes are therefore separated simultaneously on a 1D gel, the resulting bands subjected to tryptic digestion and the cross-linked peptides identified by LC-MS/MS following database searching (Figure 1, steps iii-v).
Figure 1. Comparative cross-linking workflow.

(i) The first step is to assign cross-links in the protein complex without perturbation or ligand binding. The protein complex is cross-linked using a 1:1 mixture of BS3-d0/d4. (ii) For comparative cross-linking, the same protein complex present in different conformations is cross-linked with non-deuterated (d0) and deuterated (d4) BS3, respectively. Both samples are subsequently pooled in equal quantities. Gel electrophoresis confirms cross-linking of the protein subunits by appearance of bands at higher molecular weight. (iii) The proteins are digested with trypsin and the peptide mixture containing cross-linked and non-cross-linked peptides is separated by nanoLC. (iv) Peptides are directly eluted into a mass spectrometer and peak pairs with a specific mass difference (Δm = 4Da) are indicative of light (d0) and heavy (d4) cross-linked peptides. (v) MS/MS and database searching identifies the cross-linked peptides. (vi) Ratios of the peptides corresponding to the different conformations of the protein complex (d0:d4) are determined by generation of extracted ion chromatograms (XICs) for both light (d0) and heavy (d4) cross-linked peptides.
Critical to our method is the fact that the BS3 cross-linked peptides (d0/d4) derived from complexes, exposed to different conditions, have the same physicochemical properties in terms of elution time, ionisation and fragmentation, but importantly are separated by a defined mass shift according to the stable isotopes incorporated. This procedure therefore results in pairs of peaks, with relative intensities reflecting changes in subunit interactions in response to a stimulus, and thus provides a direct and quantitative readout of these effects. By extracting ion chromatograms (so-called XICs) of d0- and d4-cross-linked peptides and comparing the ratios of the peak areas (d0:d4) we obtain quantitative values for changes in protein-protein interactions (Figure 1, step vi). Figure 2 gives an overview of the detailed protocol and the timings involved in each step.
Figure 2. Schematic of Protocol and approximate timing.

Comparative cross-linking protocol and timing of each step starting with the isolation of the complex and considering the alternative strategies for cross-linking and separation of cross-linked peptides is given. The time taken for data analysis is also considered and possible pause points throughout the protocol are highlighted in red.
An alternative comparative cross-linking protocol includes in-solution digestion and reduction of sample complexity by additional chromatography steps after cross-linking and tryptic digestion (see PROCEDURE for more details). Different chromatographic steps, such as cation exchange, could also serve to verify subtle differences in cross-linked peptides. Reproducibility can also be assessed by performing comparative cross-linking in a reverse direction (i.e by swapping the cross-linkers such that the labeled and unlabeled cross-linking reagents are used for complexes in the control and the experiment respectively). A similar step is often included in quantitative proteomic experiments to confirm the changes observed (e.g. 24).
What is the advantage of comparative cross-linking?
One of the most exciting attributes of comparative cross-linking is its ability to deliver quantitative values for structural changes within protein assemblies. In contrast, methods that have been applied in previous studies (hydrogen exchange and radical footprinting) only provide insights into the structural change itself but not the extent of change. This will likely prove powerful when ranking ligands for example on the basis of their effects on subunit interactions. Moreover we anticipate that these quantitative values will enable calculation of KD values for ligand binding to protein complexes.
An experimental advantage of comparative cross-linking over conventional techniques is that structural information is deduced from the same measurement, i.e. the protein complexes in different conformational states are analyzed at the same time. Pooling of the samples thus reduces the time needed for sample preparation or LC-MS/MS analysis. Importantly, similar to quantitative proteomics25, pooling of samples at an early time-point minimises errors caused during sample processing (e.g. sample loss, mixing errors etc).
Another potential advantage of our protocol is that it is universal enabling the use of different cross-linking reagents. All chemical cross-linkers in unlabeled and labeled form (e.g. incorporation of 2D, 15N or 13C) can be used to perform comparative cross-linking experiments. Moreover the scope could be broadened to include labeled photo cross-linking reagents26. As different biological systems require very different cross-linking strategies (e.g. integral membrane proteins, nucleic acids) adaptability to a wide range of cross-linkers will be particularly powerful. A further considerations is the use of isotopically-labeled cross-linkers to enable so-called multiplexing of experiments, i.e. more than two conformational states can be compared in one measurement with the use of multiple cross-linkers. The BS3 cross-linker used in this protocol for example is available in two deuterated forms (d4 and d8) thus allowing us to compare three different stimuli/experimental conditions of the same protein complex.
Which changes can be probed by comparative cross-linking?
Conformational changes in protein complexes are induced by a variety of stimuli, including ligand binding, activation/deactivation, oligomerisation or changes in PTMs (Figure 3). As such we believe that our comparative cross-linking strategy is widely applicable not only for phosphorylation events described below but also for other modifications including methylation, acetylation and glycosylation, as well as ligand binding (including lipid and drug binding) and oligomerisation. Essentially conformational changes that are caused by a defined stimulus can be probed. One pre-requisite however is that the stimulus can be controlled in vitro or in vivo, i.e. the two states of the protein complex need to be accessible in their isolated forms to allow cross-linking of the two states independently.
Figure 3. Comparative cross-linking to probe conformational changes.

Protein interactions affected by PTMs, oligomerisation, activation/deactivation and ligand binding are shown. Cross-linking intensities are obtained from peak pairs in mass spectra representing intensities before and after stimulating the protein complex. Changes in protein-interaction intensities are shown as dotted lines: no change (black), increased cross-linking intensities (green) and reduced cross-linking intensities (red).
We have successfully applied our protocol to study conformational changes in a variety of biological systems. These included tRNA binding to eukaryotic initiation factor 2 from yeast (C. Schmidt, C.V. Robinson, unpublished data) and sub-complexes of the Hsp70-Hsp90 cycle (N. Morgner, C. Schmidt, IO. Ebong, V. Beilsten-Edmands, N.A. Patel, E. Kirschke et al., submitted). Comparative cross-linking of subcomplexes of the Hsp70-Hsp90 cycle allowed us to study phosphorylation-dependent dimerisation of Hsp70 and conformational changes in response to binding of different nucleotides such as ATP, ADP and non-hydrolysable analogues.
We also envisage that oligomerisation of proteins and formation of super-complexes from multi-subunit protein complexes represents a promising application. For multi-subunit complexes this allows not only a measure of conformational change in protein subunits upon complexes formation, but also changes in their interaction surfaces. In the latter case, cross-linking intensities at interaction interfaces can be drastically reduced after formation of new protein complexes (Figure 3). These changes can be incorporated into integrative approaches and provide critical information for assembly of molecular models.
What are the limitations of comparative cross-linking?
As described above comparative cross-linking is widely applicable and proves particularly powerful when dynamic heterogeneous protein complexes are studied. However, one major drawback is its time-consuming data analysis workflow (Figure 4). There are several software packages for identification of cross-linked di-peptides available27-30, however none of these packages include quantification of the cross-linked peptides. Manual quantification, in addition to manual inspection of MS and MS/MS spectra, is therefore required for use in this protocol. Integrating quantification tools for peak intensities into software packages thus represents a future improvement for automation of this protocol. An initial proof-of-principle study reported the quantification of differentially cross-linked di-peptides by integrating the quantification approach into cross-linking identification tools31.
Figure 4. Data analysis workflow.

BS3-d0 and BS3-d4 cross-linked peptides co-elute during LC-MS/MS analysis (i). MS and MS/MS spectra are submitted to database searching (ii) yielding a list of potential cross-links (PXLs). MS spectra are inspected for specific peak pairs corresponding to BS3-d0 and BS3-d4 cross-linked peptides (iii). Spectra without peak pairs are rejected from further analysis (false positives, FP) (iv). MS/MS spectral quality of precursors with specific peak pair is checked (v) and spectra of poor quality are rejected (false positives, FP) (vi). The false discovery rate is calculated from the number of false positives (FP) and the total number of potential cross-linked peptides (PXLs) (vii). For comparative cross-linking XICs are generated for both the light (d0) and heavy (d4) cross-linked peptides (viii). d0/d4 cross-linking ratios are calculated (ix). Protein-protein interactions that change upon stimulation of the protein complex show d0:d4 fractions that are < or > 1:1. (x). If the majority of d0:d4 ratios deviate from 1:1, normalization of the dataset can be performed (xi).
A second potential drawback to the application of comparative cross-linking is the limitation imposed by conformational changes that are beyond the range of chemical cross-linker, i.e. the distances between cross-linked amino acid residues can no longer be bridged by the cross-linking reagent. Minimal changes in the distance between two residues, i.e. within the range employed by the cross-linking reagent, cannot be detected since the respective amino acid residues can form cross-links in both conformational states. With the emergence of an increasing array of synthetic cross-linking reagents, fine-tuning the length of a cross-linker for a particular investigation may become a real possibility in the very near future32.
MATERIALS
Reagents
CAUTION! General laboratory safety precautions should be taken when working with flammable, toxic and corrosive substances. Work in a fume hood and wear appropriate gloves and safety goggles. Do not inhale toxic vapours.
-
Acetic acid, ≥99.99% trace metals basis (Sigma-Aldrich, cat. no. 338826)
CAUTION! Acetic acid is flammable and corrosive.
-
Acetonitrile, LC-MS grade Optima (ACN, Fisher Scientific, cat. no. A955)
CAUTION! Acetonitrile is flammable and toxic.
-
Ammonium acetate solution, 7.5 M (Sigma-Aldrich, cat. no. A2706)
CAUTION! Ammonium acetate is toxic.
Ammonium bicarbonate (NH4CO3, Sigma-Aldrich, cat. no. 09830
-
bis(sulfosuccinimidyl)suberate (BS3) non-deuterated (d0) and deuterated (d4) (BS3-d0 and BS3-d4, Thermo Scientific, cat. no. 21590 (d0) and 21595 (d4))
CAUTION! BS3 is toxic.
-
Coomassie staining solution (e.g., Expedeon, InstantBlue, cat. no. ISB1L)
CAUTION! InstantBlue causes burns. Prevent inhalation and contact with skin or eyes.
-
DL-Dithiotreitol, > 99 % (DTT, Sigma-Aldrich, cat. no. D5545)
CAUTION! DTT is toxic.
-
Ethanol, absolute, > 99.8 % (Sigma-Aldrich, cat. no. 32221)
CAUTION! Ethanol is flammable.
-
Formic acid, LC-MS grade Optima (FA, Fisher Scientific, cat. no. A117)
CAUTION! FA is corrosive.
Gel electrophoresis reagents (e.g., life technologies, NuPAGE LDS Sample Buffer, cat. no. NP0008; NuPAGE Reducing agent, cat. no. NP0009; NuPAGE MES running buffer, cat. no. NP0002; NuPAGE Antioxidant, cat. no. NP0005)
-
Hydrochloric acid, approx. 36 % (HCl, Fisher Scientific, cat. no. H1200/PB17)
CAUTION! HCl is corrosive and toxic.
-
Iodoacetamide (IAA, Sigma-Aldrich, cat. no. I1149)
CAUTION! IAA is toxic.
Calcium chloride, >99% (CaCl2, Sigma-Aldrich, cat. no. P9333)
Pre-cast gels (e.g., NuPAGE® Bis-Tris Pre-Cast gels, life technologies, cat. no. NP0321)
Protein sample
-
RapiGest SF Surfactant (Waters, cat. no. 186001860)
CAUTION! May cause minor irritation if inhaled or upon eye or skin contact.
Sodium acetate (Sigma-Aldrich, cat. no. S2889)
Sodium chloride, >99.5 % (NaCl, Sigma-Aldrich, cat. no. S7653)
-
Trifluoroacetic acid, LC-MS grade Optima (TFA, Fisher Scientific, cat. no. A116)
CAUTION! TFA is corrosive.
Trypsin, sequencing grade (Roche, cat. no. 11418475001)
Water, HPLC grade (Rathburn, cat. no. RH1020)
Equipment
Centrifuge (e.g., Fresco 21 Centrifuge, Hereaus)
Centrifuge tubes, 50 and 15 ml (e.g. Fisher Scientific, cat. no. 11829650 and 11542293)
Combitips (Fisher Scientific, cat. no. PMP-117-537C)
Cross-linking software (e.g., MassMatrix Database Search Engine, www.massmatrix.net)
-
Gel electrophoresis chamber (e.g., NuPAGE XCell SureLock Mini-Cell, life technologies, cat. no. EI0001)
CAUTION! High voltages will be applied. Handle with care.
Gel loading pipette tips, 200 μl (e.g., VWR, cat. no. 613-0257)
Gel shaker (e.g., gyro rocker SSL3, Stuart)
Glass bottles (e.g. 100 ml, Fisher Scientific, cat. no. 12937630)
LC system (e.g., DionexUltiMate 3000 RSLC nano System, Thermo Scientific)
LC vials (e.g. short thread autosampler vials and short thread screw caps, Sigma-Aldrich, cat. no. SU861132 and SU860092)
Mass spectrometer (e.g., LTQ-Orbitrap XL hybrid mass spectrometer, Thermo Scientific)
MS software (e.g., XCalibur software v2.1, Thermo Scientific)
Pipette tips; 0.1-10 μl, 2-200 μl and 200-1000 μl (Gilson, F167101, F167103 and F167104)
Raw data conversion tool (e.g., MassMatrix Mass Spectrometric Data File Conversion Tools v 3.9, www.massmatrix.net)
Sample tubes (e.g. Eppendorf Safe-Lock Tubes, Eppendorf, cat. no. 0030121023)
-
Scalpel and blades (e.g., Fisher Scientific, cat. no. SCA-455-W and SCA-421-170T)
CAUTION! Scalpels are sharp! Handle with care.
SCX StageTips (Thermo Scientific, cat. no. SP341)
Syringe, 10 ml, plastic, disposable (e.g. Fisher Scientific, cat. no. 10683555)
Syringe filter, Millex-GV, 0.22 μm, PVDF (Millipore, cat. no. SLGV033RS)
Thermomixer (e.g., Thermomixer compact, Eppendorf, cat. no. 5355000038)
Vacuum centrifuge (e.g., SpeedVac SC110, Savant)
Reagent setup
20 % (v/v) ACN/0.4 % FA: Add 2 ml ACN and 40 μl FA to 7.96 ml water and mix. Prepare fresh prior to use.
1 M ammonium acetate: Mix 133 μl 7.5 M ammonium acetate stock solution and 867 μl water. Prepare fresh prior to use.
Ammonium acetate solutions for SCX: Mix 20 μl ACN with 2.5 μl, 5 μl, 10 μl, 20 μl, 30 μl, 40 μl and 50 μl 1 M ammonium acetate and top up to 100 μl to obtain 25 mM, 50 mM, 100 mM, 200 mM, 300 mM, 400 mM or 500 mM ammonium acetate/20 % (v/v) ACN. Prepare solutions fresh prior to use.
BS3-d0/d4 stock solution: Dissolve 1.43 mg BS3-d0 in 100 μl water and 1.43 mg BS3-d4 in 100 μl water to obtain 25 mM stock solutions. Pool BS3-d0 and BS3-d4 in equal amounts to obtain BS3-d0/d4 stock solution (25 mM). Dilute with water to obtain cross-linking solution of lower concentration. Prepare fresh prior to use.
BS3-d0 stock solution: Dissolve 1.43 mg BS3-d0 in 100 μl water to obtain 25 mM stock solution. Dilute with water to obtain lower concentration. Prepare fresh prior to use.
BS3-d4 stock solution: Dissolve 1.43 mg BS3-d4 in 100 μl water to obtain 25 mM stock solution. Dilute with water to obtain lower concentration. Prepare fresh prior to use.
10 mM DTT for in-gel digestion: Dissolve 1.52 mg in 1 ml 100 mM NH4CO3. Prepare fresh prior to use.
50 mM DTT for in-solution digestion: Dissolve 7.6 mg in 1 ml 25 mM NH4CO3. Prepare fresh prior to use.
Digestion buffer 1 (in-gel digestion): 50 μl water, 50 μl 100 mM NH4CO3, 5 μl 100 mM CaCl2, 15 μl Trypsin stock solution. Prepare fresh prior to use.
Digestion buffer 2 (in-gel digestion): 50 μl water, 50 μl 100 mM NH4CO3, 5 μl 100 mM CaCl2. Prepare fresh prior to use.
100 % (v/v) ethanol: 100 % (v/v) ethanol can be stored in a 50 ml centrifuge tube at −20°C for several months to provide ice-cold solution.
80 % (v/v) ethanol: mix 40 ml ethanol with 10 ml water and mix. Store solution at −20°C for several months.
5 % (v/v) FA: Add 50 μl FA to 950 μl water and mix. Prepare fresh prior to use.
1 mM HCl: Add 8.58 μl 36 % HCl to 100 ml water and mix. Store in a glass bottle for several years.
55 mM IAA for in-gel digestion: Dissolve 10.2 mg in 1 ml 100 mM NH4CO3. IAA is light-sensitive. Prepare fresh prior to use and protect solution from light by wrapping with aluminium foil.
100 mM IAA for in-solution digestion: Dissolve 18.5 mg in 1 ml 25 mM NH4CO3. IAA is light-sensitive. Prepare fresh prior to use and protect solution from light by wrapping with aluminium foil.
1 M NaCl/20 % (v/v) ACN/0.4 % (v/v) FA: Dissolve 0.6 g NaCl in 10 ml 20 % (v/v) ACN/0.4 % (v/v) FA. Prepare fresh prior to use.
25 mM NH4CO3 for in-solution digestion: Dissolve 19.75 mg in 10 ml water. Filter the solution using a syringe filter and check pH. The pH should be between 7.5 and 9 to ensure activity of trypsin. Prepare fresh prior to use.
100 mM NH4CO3 for in-gel digestion: Dissolve 316 mg in 40 ml water. Filter the solution using a syringe filter and check pH. The pH should be between 7.5 and 9 to ensure activity of trypsin. Prepare fresh prior to use.
Protein sample: Use amine-free buffer systems to prepare the protein sample. A concentration that yields well-stained bands on a protein gel is suggested for successful application of the protocol.
RapiGest: Dissolve one aliquot (1 mg) in 100 μl of 25 mM NH4CO3 to obtain 1 % (m/v) RapiGest. RapiGest solution can be stored at −20°C for several weeks.
3M sodium acetate pH 5.3: Dissolve 24.61 g sodium acetate in 100 ml water and adjust pH to 5.3 using acetic acid. Store in a glass bottle for several years.
5 % (v/v) TFA: Add 50 μl FA to 950 μl water and mix. Prepare fresh prior to use.
-
Trypsin stock solution: Dissolve 25 μg in 250 μl 1mM HCl to obtain 0.1 μg/μl stock solution.
Trypsin stock solution can be stored at −20°C for several weeks.
Trypsin solution (in-solution digestion): Add trypsin stock solution (1:20 enzyme: protein) to 25 mM NH4CO3 to a final volume of 70 μl. For instance, when digesting 2 μg of protein, mix 1 μl of trypsin stock solution and 69 μl of 25 mM NH4CO3 to obtain 70 μl of trypsin solution. Prepare fresh prior to use.
Equipment setup
LC-MS system: Since different laboratories have their own individual set-up for LC-MS/MS we have not provided a specific procedure for this step. General guidelines for analysis of samples generated for proteomic studies should be followed. Note, however, the following recommendations for LC-MS analysis specifically for cross-linked peptides: Cross-linked di-peptides have a higher hydrophobicity than linear peptides and the gradient during LC should be adjusted. We therefore employ a gradient from 4-80 % ACN and acquire MS and MS/MS spectra during the full gradient. In addition, as cross-linked di-peptides are usually of lower intensity compared to non-cross-linked peptides, we use long HPLC columns to achieve the highest separation of the peptide mixture and thus ensure high analytical depth during the analysis. Typically we use 50 cm columns packed with C18 material. The mass spectrometer should be operated in data-dependent mode. We employ in our analyses an LTQ-Orbitrap XL mass spectrometer. Full scan MS spectra are acquired in the Orbitrap (resolution of 30,000 at m/z 400 and an automatic gain control target at 106) and MS/MS spectra are acquired in the linear ion trap. Precursors of unknown charge state as well as singly charged ions are excluded from the analysis and selected precursors are dynamically excluded for 30 s. Depending on the mass spectrometer available these settings might need to be adjusted. Please also note that some current mass spectrometers also allow the analysis of fragment ions in the orbitrap using different fragmentation methods such as HCD (higher collision dissociation). The recording of these high-resolution fragment spectra can be used to confirm the identity of the cross-linked peptide.
PROCEDURE
Complex purification
TIMING 1 – 5 d
1. Proteins and protein complexes obtained from various purification protocols can be analyzed by cross-linking and comparative cross-linking. Use amine-free buffer systems such as phosphate buffers or HEPES during the purification and isolation procedures. A protein complex concentration that yields well-stained coomassie blue bands on a protein gel is suggested for successful application. Protein contamination of the complex does not influence the results of our protocol as long as the protein complex of interest is highly abundant in the sample and the contaminating proteins do not interact with the protein of interest or influence its activity (or conformational change). Handling of the protein complex (e.g. thawing/freezing, storage conditions, …) is specific to the system under investigation and the usual techniques should be followed.
CRITICAL STEP! Buffer systems and additives that contain primary amines quench the cross-linking reagent and thus lower the cross-linking yield. They should therefore be avoided during protein complex purification or be exchanged against compatible buffers before cross-linking the protein complex. Low protein concentrations of the complex under investigation will also affect the cross-linking yield.
Chemical cross-linking
TIMING 90 min – 2 h
2. The first step towards comparative cross-linking involves cross-linking of the protein complex in its untreated (i.e. apo and natural) state (option A, followed by sample preparation and MS as described in Steps 3-14); the results of this experiment form the basis of the cross-linking experiment. The amount of cross-linking reagent needs to be optimised with respect to the protein concentration. Comparative cross-linking utilizing deuterated and non-deuterated cross-linking reagents is then performed to find out what conformational changes in the protein complex result from induction by a defined stimulus (option B, followed by Steps 3-14).
(A) Chemical cross-linking of the protein complex in its native state
Determine the quantity of cross-linker required to get meaningful results. Using a 25 mM BS3-d0/d4 stock solution, add different quantities to a series of protein complex solution to yield a series of final cross-linker concentrations. Assuming a protein complex concentration of 1 mg ml−1, we recommend a cross-linker concentration range from 0.5 mg ml−1 to 2 mg ml−1. Mix gently by pipetting the solution several times.
Incubate for 1 h at 25°C and 350 rpm in a thermomixer.
-
Use gel electrophoresis to determine optimal cross-linking yields.
CRITICAL STEP! Cross-linked protein bands of higher molecular weight should have comparable intensity to un-cross-linked proteins. A gel with comparable intensities is shown in Figure 5 for a 20 μl aliquot of the cATPase (approx. 10 μM).
CRITICAL STEP! Avoid reaction buffers and additives that contain amine groups as these might be reactive with the cross-linking reagents and thus induce quenching.
Perform steps (i)-(iii) under the optimal reaction conditions and proceed immediately with step 3 option A or B. Before performing comparative cross-linking (steps in 2B) analyze the results. Identified cross-links yield information on protein interactions in the apo (untreated) form of the protein complex.
Figure 5. Gel electrophoresis of a cross-linked protein complex.
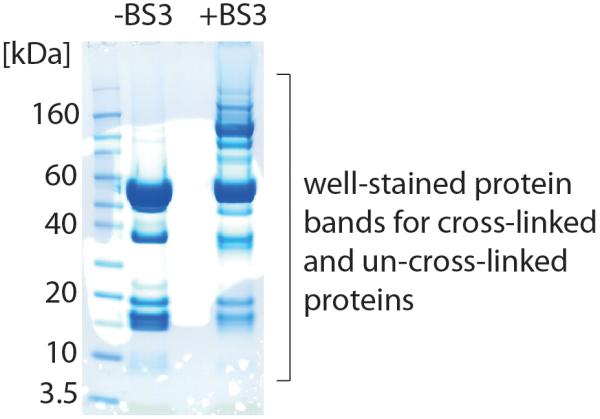
20 μl of the cATPase (approx. 20 μM) were cross-linked with 1 mM BS3. The gel shows the un-cross-linked and the cross-linked protein complex. Protein bands of covalently linked protein subunits are visible at higher molecular weight.
(B) Comparative cross-linking to probe conformational changes
Induce desired stimulus to the purified protein complex and incubate for the required time. Prepare a control sample (no addition of the stimulus inducing enzyme, ligand, etc.) and incubate for the same time. We incubated the cATPase with a phosphatase and incubated a control sample without phosphatase for the same time (Figures 6 and 7).
-
Add BS3-d4 solution to the stimulated protein complex and BS3-d0 solution to the control sample (untreated/apo form). Mix gently by pipetting the solution several times.
CRITICAL STEP! It is advised to repeat the comparative cross-linking experiment and reverse the use of deuterated and non-deuterated cross-linker. Use optimized concentration of the cross-linking solution obtained from step 2A(i-iii).
Incubate both samples for 1 h at 25°C and 350 rpm in a thermomixer.
-
Pool the stimulated and control samples in equal amounts. Proceed immediately with step 3 option A or B.
CRITICAL STEP! It is important to pool the two samples in exactly the same amounts. Use the same protein concentrations and buffer volumes for incubation of the two samples or adjust the volume accordingly. Pool samples in a fresh sample tube to minimize mixing errors.
Figure 6. Comparative cross-linking of the cATPase.

The cATPase was treated with a phosphatase and cross-linked with BS3-d4, while the untreated cATPase was cross-linked with BS3-d0. Both forms were pooled in a 1:1 ratio and proteins were separated by gel electrophoresis. After tryptic digestion and LC-MS/MS analysis, cross-links were identified by a database search (a). Protein interactions were compared by generating XICs and calculation of the ratios of their peak areas. Cross-links that showed equal intensities in MS spectra and in XICs represent protein interactions that are not affected by dephosphorylation (b). Cross-links showing reduced intensities in the dephosphorylated cATPase are identified by lower d4 intensities in MS spectra and smaller d4 XIC peak areas (c).
Figure 7. Summary of comparative cross-linking of phosphorylated and dephosphorylated cATPase.

Interactions within the untreated (phosphorylated, phos) and dephosphorylated (dephos) cATPase are represented with dotted lines. Changes in cross-linking intensities are colour-coded according to the legend. Phosphosites are shown space filled (yellow), cross-linked residues (red) and the nucleotide binding site (red, yellow circle). Interactions between the α/β head and I, II, γ, δ, and the extended helix of ε are reduced after dephosphorylation. Interactions between ε and the membrane ring (III) are not affected. Interactions on top of the α/β head did not change or showed only small changes. Interactions at the base were dramatically reduced inducing nucleotide release.
Sample preparation for LC-MS/MS analysis
TIMING 2-3 d (including overnight incubations)
3. Cross-linked peptides are usually of lower abundance than linear peptides that have not been cross-linked. To reduce the background of linear peptides and enhance analytical depth, and thus increase the chances of identifying cross-linked peptides during LC-MS/MS analysis, we consider two options to prepare the samples for LC-MS/MS: The first involves gel electrophoresis of proteins followed by in-gel digestion33 (option A). The second uses in-solution digestion and subsequent separation of peptides using cation exchange chromatography (SCX) (option B). Both options require similar quantities of protein complex and deliver comparable results. Different laboratories, however, prefer in-gel or in-solution digestion protocols and both have their advantages and disadvantages. In-gel digestion for instance allows the analysis of gel bands of particular molecular weight representing specific interaction modules in the protein assembly. In-solution digestion in contrast delivers an average of the protein interactions in the protein complex. Nonetheless, both options allow removal of MS-incompatible buffer additives (e.g. detergents), thus ensure adequate sample preparation for LC-MS/MS.
(A) Gel electrophoresis and in-gel digestion
-
Add gel electrophoresis sample buffer (e.g. NuPAGE LDS sample buffer) to the cross-linked protein sample and heat according to the manufacturer’s protocol.
CRITICAL STEP! Use enough protein to obtain well-stained coomassie blue bands. If no bands, or only faintly-stained protein bands, are obtained repeat the experiment (steps 1-2) using more of the protein complex. The volume that can be loaded onto the gel will depend upon the gel system used. Typically a final volume of 20 μl is appropriate.
Separate proteins by gel electrophoresis according to manufacturer’s protocol.
Stain the gel in a gel staining box by adding coomassie staining solution. Incubate 1-24 h on a gel shaker at room temperature.
Destain the gel on a gel shaker by replacing the staining solution with water. Exchange the water several times.
Cut protein bands from the gel using a scalpel. Wash the scalpel blade with water before cutting a new band.
-
Cut bands on a glass or metal plate into small pieces of approx. 1×1 mm and transfer into a sample tube.
CRITICAL STEP! Cross-contamination can occur when cutting gel bands which are not well resolved. Cut stained gel bands precisely; do not include unstained material between the protein bands. When cutting broad gel bands the amount of digestion buffer needs to be adjusted accordingly (Step 3A(xxiv)).
PAUSE POINT! Cut gel pieces can be stored for several months at −20 °C.
Wash the gel pieces with 150 μl of water. Incubate in a thermomixer at 26 °C and 1,050 rpm for 5 min.
Remove liquid using gel loader pipette tip.
Dehydrate gel pieces with 150 μl of ACN. Incubate in a thermomixer at 26 °C and 1,050 rpm for 15 min.
Remove liquid using gel loader pipette tip.
Dry gel pieces in a vacuum centrifuge for approx. 5 min.
Reduce disulfide bonds of proteins by addition of 100 μl of 10 mM DTT and incubation at 56 °C for 50 min.
Remove liquid using gel loader pipette tip.
Dehydrate gel pieces with 150 μl of ACN. Incubate in a thermomixer at 26 °C and 1,050 rpm for 15 min.
Remove liquid using gel loader pipette tip.
Alkylate reduced cysteine residues by addition of 100 μl of 55 mM IAA and incubation at 26 °C for 20 min in the dark.
Remove liquid using gel loader pipette tip.
-
Add 150 μl of 100 mM NH4CO3 and incubate in a thermomixer at 26 °C and 1,050 rpm for 15 min.
CRITICAL STEP! Do not remove liquid.
-
xiv
Add 150 μl of ACN and incubate in a thermomixer at 26 °C and 1,050 rpm for 15 min.
-
xx
Remove liquid using gel loader pipette tip.
-
xxi
Add 150 μl of ACN and incubate in a thermomixer at 26 °C and 1,050 rpm for 15 min.
-
xxii
Remove liquid using gel loader pipette tip.
-
xxiii
Dry gel pieces in a vacuum centrifuge for approx. 5 min.
-
xxiv
Rehydrate gel pieces on ice by adding digestion buffer 1 and incubating for 30 min.
CRITICAL STEP! The amount of digestion buffer 1 required to rehydrate gel pieces depends on the amount of gel material and needs to be adjusted for each gel band. Typically a volume of 20 μl is sufficient to rehydrate one gel band. Check after 30 min and add more digestion buffer if gel pieces are not rehydrated.
-
xxv
Cover gel pieces with digestion buffer 2 and incubate overnight at 37°C.
CRITICAL STEP! The gel pieces should be completely covered with digestion buffer 2. The amount of digestion buffer needs to be adjusted for every gel band depending on the amount of gel material. Typically use 50 μl of digestion buffer 2 for gel bands of 0.2-0.4 cm.
-
xxvi
Add 50 μl of water to the gel pieces and incubate in a thermomixer at 37 °C and 1,050 rpm for 15 min.
CRITICAL STEP! Do not discard supernatant after tryptic digestion as it contains the generated peptides.
-
xxvii
Add 50 μl of ACN to the gel pieces and incubate in a thermomixer at 37 °C and 1,050 rpm for 15 min.
-
xxviii
Collect supernatant using a gel loader tip and transfer to a new sample tube.
-
xxix
Add 50 μl of 5 % (v/v) FA to the gel pieces and incubate in a thermomixer at 37 °C and 1,050 rpm for 15 min.
-
xxx
Add 50 μl of ACN to the gel pieces and incubate in a thermomixer at 37 °C and 1,050 rpm for 15 min.
-
xxxi
Collect supernatant using a gel loader tip and pool with the first supernatant (step xxiii).
-
xxxii
Dry peptide solution in a vacuum centrifuge.
PAUSE POINT! Samples can be stored for several months at −20°C.
(B) In-solution digestion using RapiGest and SCX
-
Precipitate cross-linked proteins by adding 3 Vol. 100 % (v/v) ice-cold ethanol and 1/10 Vol. of 3M sodium acetate pH 5.3. Vortex for several seconds and incubate at −20°C for at least 2 h.
PAUSE POINT! Samples can be stored in ethanol at −20°C for several months.
Centrifuge at 16,200 × g and 4 °C for 30 min.
-
Remove supernatant and wash pellet by addition of 80 % (v/v) ice-cold ethanol. Vortex the sample for 30 s.
CRITICAL STEP! Remove supernatant carefully. Protein pellets are sometimes very small and might be withdrawn with the supernatant.
Centrifuge at 16,200 × g and 4 °C for 30 min.
-
Remove supernatant and dry pellet in a vacuum centrifuge.
CRITICAL STEP! Remove supernatant carefully. Protein pellets are sometimes very small and might be withdrawn in the pipette with the supernatant.
Re-dissolve pellet in 10 μl 1 % (m/v) RapiGest by vortexing for two min.
Add 10 μl 50 mM DTT and incubate in a thermomixer at 37 °C and 500 rpm for 1 h.
Add 10 μl 100 mM IAA and incubate in a thermomixer at 37 °C and 500 rpm for 1 h.
Add 70 μl trypsin solution and incubate at 37 °C overnight.
Add 20 μl 5 % (v/v) TFA and incubate at 37 °C for 2 hrs.
Centrifuge at 16,200 × g and 4 °C for 30 min.
-
Transfer the supernatant into a new sample tube and in a vacuum centrifuge.
PAUSE POINT! Samples can be stored for several months at −20°C.
Re-dissolve pellet in 20 μl of 20% (v/v) ACN/0.4% (v/v) FA by vortexing for 30 s.
Pre-condition SCX tips by loading 20 μl of 1M NaCl/20 % (v/v) ACN/0.4 % (v/v) FA. Push through using a combi syringe.
Repeat step xiv.
Load 30 μl of 20% (v/v) ACN/0.4% (v/v) FA and push through using a combi syringe.
Wash tip by loading 30 μl of 100 % (v/v) ACN. Push through using a combi syringe.
Repeat step xvii three times.
Load 20 μl of 1M NaCl/20 % (v/v) ACN/0.4 % (v/v) FA. Push through using a combi syringe.
Re-equilibrate by loading 30 μl of 20% (v/v) ACN/0.4% (v/v) FA and push through using a combi syringe.
Repeat step xx twice.
-
Load sample into SCX tips and push through using a combi syringe. Collect flow through and perform a second loading step.
CRITICAL STEP! Push sample through slowly to ensure maximum loading of the peptides to the SCX material.
Wash three times with 30 μl of 20% (v/v) ACN/0.4% (v/v) FA.
Elute peptides step-wise with different concentrations of ammonium acetate (typically 25, 50, 100, 200, 300, 400 and 500 mM) in 20% (v/v) ACN/0.4% (v/v) FA.
-
Collect eluents and dry in a vacuum centrifuge.
PAUSE POINT! Samples can be stored for several months at −20°C.
LC-MS/MS analysis
TIMING 90 min – 2 h
4. Dissolve dried peptide samples by addition of loading buffer and sonication for 1-2 mins. We recommend dissolving the samples obtained from one gel band or one elution step after SCX in 20 μl of loading buffer and injecting 5 μl of the solution into the nanoLC. Depending on the sensitivity of the mass spectrometer used, the volume of injection may differ and needs to be adjusted to obtain a good signal by LC-MS/MS.
5. Analyze samples by nanoLC-MS/MS (see equipment setup).
Identification of cross-linked peptides
TIMING 1 – 3 h per sample
CRITICAL STEP! There are various software packages for analysis of cross-linked peptides available27-30. In our studies we used the freely available search engine MassMatrix29 (www.massmatrix.net). However, other software for identification of cross-linked peptides is compatible with our protocol. We describe below our data analysis workflow (see also Figure 4) using the MassMatrix webserver.
6. Convert the raw data to mzXML or mgf format using the MassMatrix File Conversion tool. For further information see www.massmatrix.net.
7. Generate a protein database for cross-linking experiments in fasta-format as described in the MassMatrix user manual (www.massmatrix.net).
8. Define the mass of the deuterated cross-linker (BS3-d4) in the settings of MassMatrix (see www.massmatrix.net for help). Non-deuterated (d0) BS3 is included in the default settings.
9. Submit database search on the webserver or computer version of the MassMatrix search engine employing BS3-d0 as cross-linker (Figure 4 step ii). We use the following search parameters by default: Missed cleavage sites: 2; Variable modifications: Iodoacetamide and Oxidation of M; Min pp score: 5; Min PPtag score 1.3; Precursor ion tol: 10 ppm; Product ion tol: 0.8 Da.
CRITICAL STEP! The parameters might affect the database search result. It might be necessary to adjust the precursor and product ion tolerances depending on the mass accuracy achieved during LC-MS analysis. The minimum scores listed here present stringent values. If necessary they can be lowered to obtain a higher number of potential cross-linked peptides after database searching.
10. Scan the database search output for potential cross-linked peptides.
TROUBLESHOOTING
11. Check manually the respective MS spectra for the presence of specific peak pairs indicative for the d0/d4-BS3 cross-linker (Figure 4 step iii). Spectra without specific peak pairs represent false-positive hits (Figure 4 step iv).
TROUBLESHOOTING
CRITICAL STEP! Check the MS spectra carefully. Peptides representing a specific peak pair have the same charge state and an exact mass difference of 4 Da (when using BS3-d0/d4). When performing the database search employing BS3-d0 the heavy cross-linked di-peptide should be present in the respective MS spectrum and vice versa.
12. Check the quality of MS/MS spectra of confirmed potential cross-links (Figure 4 step v). Reject spectra of low quality that do not allow identification of the cross-linked peptides (Figure 4 step vi). Add these to the list of false-positives.
13. Repeat the database search, this time employing BS3-d4 as the cross-linker and analyze the database output as described in steps 10-12.
14. Calculate the False discovery rate (FDR) using the following equation: FDR [%] = FP / PXLs × 100, where FP is the number of false positives (see above) and PXLs is the number of potential cross-links obtained after database search (Figure 4 step vii).
Quantification of identified cross-links (comparative cross-linking)
TIMING 1 – 3 h per sample
CRITICAL STEP! Quantification of cross-links is performed to distinguish protein-protein interactions that change upon stimulation of the protein complex from interactions that do not change. This quantification is based on intensities of the respective cross-linked peptides, which are obtained from extracted ions chromatograms (XICs). There are different software packages available that can be used to generate XICs. The software of choice needs to support raw data files of the mass spectrometer used. It is therefore recommended to use the instrument control software which is provided with the mass spectrometer (e.g. XCalibur, Thermo Scientific).
15. Generate XICs of the validated d0- and d4-cross-linked peptides (Figure 4 step viii). Follow the instruction manual of the manufacturer. We used XCalibur (Thermo Scientific) to generate XICs of the cross-linked peptides.
16. Calculate d0/d4 and d4/d0 ratios by dividing peak areas of respective XICs (i.e. XICs of peak pairs) (Figure 4 step ix).
TROUBLESHOOTING
17. Inspect obtained d0/d4 and d4/d0 ratios. Cross-links that are not affected by the induced stimulus (e.g. ligand binding or incubation with an enzyme) should show a ratio close to 1. Cross-links that are affected show ratios that differ from 1 (Figure 4 step x).
CRITICAL STEP! Cross-linking ratios of interactions that do not change usually scatter around 1. Depending on the conformational change these should be the majority of ratios obtained. In particular intra-peptide cross-links should show a ratio of 1 as these are in general not expected to be affected by conformational change. If the majority of protein ratios scatter around a different value, normalization is needed (Figure 4 step xi). This is performed by calculating a normalization factor from the average ratio (normalization factor = 1 / average protein ratio) and multiplying all ratios with this normalization factor. Normalisation is correcting for mixing errors that have occurred during pooling of the samples (see above).
TIMING
Step 1, sample preparation: 1 – 5 d (depending on the protein complex to be purified)
Step 2, chemical cross-linking: 90 min – 2 h
Step 3, reducing sample complexity: 2 – 3 d (including overnight incubations)
Steps 4-5, LC-MS/MS analysis: 90 min – 2 h
Steps 6-14, Identification of cross-linked peptides: 1 – 3 h per sample (i.e. one gel band or one eluate from SCX; this time frame is dependent on the sample complexity and the cross-linking yield)
Steps 15 – 17, Quantification of identified cross-links: 1 – 3 h per sample (i.e. one gel band or one eluate from SCX; this time frame is dependent on the sample complexity and cross-linking yield)
TROUBLESHOOTING
Troubleshooting advice can be found in Table 1.
| Step | Problem | Possible Reason | Solution |
|---|---|---|---|
| 10 | Low cross-linking yield | Cross-linking experiment failed (Step 2) | Check cross-linking by gel electrophoresis |
| Buffers or additives contain primary amines (Step 2) | Change buffer system | ||
| Concentration of cross-linker is too low | Check cross-linking yield by gel electrophoresis and adjust amount of cross-linking reagent | ||
| In-gel digestion failed (Step 3A) | Check digestion by analysis of non-cross-linked peptides; if digestion was not sufficient use higher amounts of trypsin and/or use fresh trypsin stock solution for digestion | ||
| Cross-linked peptides were not extracted from gel (Step 3A) | Try analyzing option 3(B) | ||
| In-solution digestion failed (Step 3B) | Check digestion by the presence of non-cross-linked peptides; if digestion was not sufficient use higher amounts of trypsin and/or use fresh trypsin stock solution for digestion | ||
| Sample loss during SCX (Step 3B) | Check presence of peptides before and after SCX; test the protocol with standard protein (without cross-linking), repeat and strictly follow the protocol | ||
| Problems with LC-MS setup, sensitivity of the mass spectrometer (Steps 4 and 5) | Check LC-MS system using a standard peptide mix; optimize instrument/method parameters; load higher amounts of the sample onto the column, re-calibrate the instrument | ||
| 10 | No cross-links obtained/ low cross-linking yield | Database search parameters not adjusted (Step 9) | Vary database search parameters (e.g. increase precursor and product ion tolerance, lower minimum scores) |
| 11 | No peak pairs (cross-links obtained only from BS3-d0 or BS3-d4 cross-linking experiment) | BS3-d0 or BS3-d4 cross-linking experiment failed (Step 2B) | Check cross-linking of the individual reactions without pooling by gel electrophoresis |
| 16 | d0/d4 ratios do not show 1:1 ratio | Samples were not pooled in equal amounts | When obtained ratios are shifted, normalize dataset by multiplying ratios with the normalization factor |
| 16 | Unreasonable d0/d4 ratios | Generated XICs do not belong to the peak pair (Steps 15-17) | Check elution time window of the cross-linked peptides (BS3-d0 and -d4 cross-linked peptides co-elute) |
ANTICIPATED RESULTS
We exemplify our comparative cross-linking strategy using the ATP synthase isolated from spinach chloroplasts (cATPase). First we used a 1:1 mixture of d0:d4 BS3 to identify protein-protein interactions in the cATPase under natural conditions, i.e. before treatment with a phosphatase. We identified 105 intra- and inter-protein cross-links with a FDR of 9.29% and used this assignment as a basis for our comparative cross-linking strategy. We then took two aliquots of the complex, added a phosphatase to one and an equal volume of buffer to the other, and incubated the two solutions side by side (Figure 6a). Following incubation, BS3-d4 was added to the phosphatase treated aliquot while BS3-d0 was added to the untreated cATPase. A 1:1 ratio of the two solutions (by volume) was then prepared and subjected to 1D gel separation, trypsin digestion and LC-MS/MS analysis. Ratios of the intensities of the labeled and unlabeled cross-linked peptides were obtained by generating XICs (Figure 6b and c). We found that while some labeled and unlabeled cross-linked peptides had similar intensities (Figure 6b), allowing us to define interactions that are not affected by dephosphorylation, the majority showed reduced intensities for labeled cross-linked peptides compared with unlabeled ones (Figure 6c). This reduction in intensity is consistent with a reduction in subunit interactions following dephopsphorylation23 (Figure 7).
Because our method delivers quantitative values we can compare changes in cross-links. For example, following dephosphorylation cross-links between subunits I/II:α and α:β are 2-5 and 5-10 fold less intense respectively. We concluded therefore that dephosphorylation has a greater effect on the α:β interface than on interactions between F1 and the peripheral stalks. Together with results from mass spectra of intact complexes, our comparative cross-linking data prompt a mechanism whereby dephosphorylation causes conformational changes in the head which increase access to nucleotide binding sites23 (Figure 7).
ACKNOWLEDGEMENTS
We acknowledge funding from the Wellcome Trust (WT008150 and WT099141) and the ERC IMPRESS grant (ERC 268851) to CVR. CVR is a Royal Society Professor.
Footnotes
COMPETING FINANCIAL INTEREST
The authors declare that they have no competing financial interests.
Is-protocol-to Schmidt, C. et al. Comparative cross-linking and mass spectrometry of an intact F-type ATPase suggest a role for phosphorylation. Nat Commun 4, 1985 (2013).
Ontology
Biological sciences / Biological techniques / Spectroscopy / Mass spectrometry
Biological sciences / Chemical biology / Proteins
Biological sciences / Biological techniques / Structure determination
Categories Protein analysis; Mass spectrometry; Chemical cross-linking
REFERENCES
- 1.Herzog F, et al. Structural probing of a protein phosphatase 2A network by chemical cross-linking and mass spectrometry. Science. 2012;337:1348–1352. doi: 10.1126/science.1221483. [DOI] [PubMed] [Google Scholar]
- 2.Leitner A, et al. The molecular architecture of the eukaryotic chaperonin TRiC/CCT. Structure. 2012;20:814–825. doi: 10.1016/j.str.2012.03.007. [DOI] [PMC free article] [PubMed] [Google Scholar]
- 3.Chen ZA, et al. Architecture of the RNA polymerase II-TFIIF complex revealed by cross-linking and mass spectrometry. EMBO J. 2010;29:717–726. doi: 10.1038/emboj.2009.401. [DOI] [PMC free article] [PubMed] [Google Scholar]
- 4.Rouillon C, et al. Structure of the CRISPR interference complex CSM reveals key similarities with cascade. Mol Cell. 2013;52:124–134. doi: 10.1016/j.molcel.2013.08.020. [DOI] [PMC free article] [PubMed] [Google Scholar]
- 5.Politis A, et al. A mass spectrometry-based hybrid method for structural modeling of protein complexes. Nat Methods. 2014 doi: 10.1038/nmeth.2841. [DOI] [PMC free article] [PubMed] [Google Scholar]
- 6.Rappsilber J. The beginning of a beautiful friendship: cross-linking/mass spectrometry and modelling of proteins and multi-protein complexes. J Struct Biol. 2011;173:530–540. doi: 10.1016/j.jsb.2010.10.014. [DOI] [PMC free article] [PubMed] [Google Scholar]
- 7.Sinz A. Chemical cross-linking and mass spectrometry to map three-dimensional protein structures and protein-protein interactions. Mass Spectrom Rev. 2006;25:663–682. doi: 10.1002/mas.20082. [DOI] [PubMed] [Google Scholar]
- 8.Aebersold R, Mann M. Mass spectrometry-based proteomics. Nature. 2003;422:198–207. doi: 10.1038/nature01511. [DOI] [PubMed] [Google Scholar]
- 9.Pearson KM, Pannell LK, Fales HM. Intramolecular cross-linking experiments on cytochrome c and ribonuclease A using an isotope multiplet method. Rapid Commun Mass Spectrom. 2002;16:149–159. doi: 10.1002/rcm.554. [DOI] [PubMed] [Google Scholar]
- 10.Leitner A, et al. Probing native protein structures by chemical cross-linking, mass spectrometry, and bioinformatics. Mol Cell Proteomics. 2010;9:1634–1649. doi: 10.1074/mcp.R000001-MCP201. [DOI] [PMC free article] [PubMed] [Google Scholar]
- 11.Wlodawer A, Minor W, Dauter Z, Jaskolski M. Protein crystallography for aspiring crystallographers or how to avoid pitfalls and traps in macromolecular structure determination. FEBS J. 2013;280:5705–5736. doi: 10.1111/febs.12495. [DOI] [PMC free article] [PubMed] [Google Scholar]
- 12.Bai XC, Fernandez IS, McMullan G, Scheres SH. Ribosome structures to near-atomic resolution from thirty thousand cryo-EM particles. Elife. 2013;2:e00461. doi: 10.7554/eLife.00461. [DOI] [PMC free article] [PubMed] [Google Scholar]
- 13.Mainz A, et al. NMR spectroscopy of soluble protein complexes at one mega-dalton and beyond. Angew Chem Int Ed Engl. 2013;52:8746–8751. doi: 10.1002/anie.201301215. [DOI] [PubMed] [Google Scholar]
- 14.Hyung SJ, Ruotolo BT. Integrating mass spectrometry of intact protein complexes into structural proteomics. Proteomics. 2012;12:1547–1564. doi: 10.1002/pmic.201100520. [DOI] [PMC free article] [PubMed] [Google Scholar]
- 15.Zhong Y, Hyung SJ, Ruotolo BT. Ion mobility-mass spectrometry for structural proteomics. Expert Rev Proteomics. 2012;9:47–58. doi: 10.1586/epr.11.75. [DOI] [PMC free article] [PubMed] [Google Scholar]
- 16.Wales TE, Engen JR. Hydrogen exchange mass spectrometry for the analysis of protein dynamics. Mass Spectrom Rev. 2006;25:158–170. doi: 10.1002/mas.20064. [DOI] [PubMed] [Google Scholar]
- 17.Schwarz R, et al. Monitoring conformational changes in peroxisome proliferator-activated receptor alpha by a genetically encoded photoamino acid, cross-linking, and mass spectrometry. J Med Chem. 2013;56:4252–4263. doi: 10.1021/jm400446b. [DOI] [PubMed] [Google Scholar]
- 18.Serpa JJ, et al. Using multiple structural proteomics approaches for the characterization of prion proteins. J Proteomics. 2013;81:31–42. doi: 10.1016/j.jprot.2012.10.008. [DOI] [PubMed] [Google Scholar]
- 19.Marcoux J, et al. Mass spectrometry reveals synergistic effects of nucleotides, lipids, and drugs binding to a multidrug resistance efflux pump. Proc Natl Acad Sci U S A. 2013;110:9704–9709. doi: 10.1073/pnas.1303888110. [DOI] [PMC free article] [PubMed] [Google Scholar]
- 20.Politis A, Park AY, Hall Z, Ruotolo BT, Robinson CV. Integrative Modelling Coupled with Ion Mobility Mass Spectrometry Reveals Structural Features of the Clamp Loader in Complex with Single-Stranded DNA Binding Protein. J Mol Biol. 2013 doi: 10.1016/j.jmb.2013.04.006. [DOI] [PubMed] [Google Scholar]
- 21.van Duijn E, et al. Native tandem and ion mobility mass spectrometry highlight structural and modular similarities in clustered-regularly-interspaced shot-palindromic-repeats (CRISPR)-associated protein complexes from Escherichia coli and Pseudomonas aeruginosa. Mol Cell Proteomics. 2012;11:1430–1441. doi: 10.1074/mcp.M112.020263. [DOI] [PMC free article] [PubMed] [Google Scholar]
- 22.Xu G, Chance MR. Hydroxyl radical-mediated modification of proteins as probes for structural proteomics. Chem Rev. 2007;107:3514–3543. doi: 10.1021/cr0682047. [DOI] [PubMed] [Google Scholar]
- 23.Schmidt C, et al. Comparative cross-linking and mass spectrometry of an intact F-type ATPase suggest a role for phosphorylation. Nat Commun. 2013;4:1985. doi: 10.1038/ncomms2985. [DOI] [PMC free article] [PubMed] [Google Scholar]
- 24.Ong SE, et al. Stable isotope labeling by amino acids in cell culture, SILAC, as a simple and accurate approach to expression proteomics. Mol Cell Proteomics. 2002;1:376–386. doi: 10.1074/mcp.m200025-mcp200. [DOI] [PubMed] [Google Scholar]
- 25.Bantscheff M, Schirle M, Sweetman G, Rick J, Kuster B. Quantitative mass spectrometry in proteomics: a critical review. Anal Bioanal Chem. 2007;389:1017–1031. doi: 10.1007/s00216-007-1486-6. [DOI] [PubMed] [Google Scholar]
- 26.Preston GW, Radford SE, Ashcroft AE, Wilson AJ. Analysis of Amyloid Nanostructures Using Photo-cross-linking: In Situ Comparison of Three Widely Used Photo-cross-linkers. ACS Chem Biol. 2014 doi: 10.1021/cb400731s. [DOI] [PMC free article] [PubMed] [Google Scholar]
- 27.Gotze M, et al. StavroX--a software for analyzing crosslinked products in protein interaction studies. J Am Soc Mass Spectrom. 2012;23:76–87. doi: 10.1007/s13361-011-0261-2. [DOI] [PubMed] [Google Scholar]
- 28.Walzthoeni T, et al. False discovery rate estimation for cross-linked peptides identified by mass spectrometry. Nat Methods. 2012;9:901–903. doi: 10.1038/nmeth.2103. [DOI] [PubMed] [Google Scholar]
- 29.Xu H, Hsu PH, Zhang L, Tsai MD, Freitas MA. Database search algorithm for identification of intact cross-links in proteins and peptides using tandem mass spectrometry. J Proteome Res. 2010;9:3384–3393. doi: 10.1021/pr100369y. [DOI] [PMC free article] [PubMed] [Google Scholar]
- 30.Rinner O, et al. Identification of cross-linked peptides from large sequence databases. Nat Methods. 2008;5:315–318. doi: 10.1038/nmeth.1192. [DOI] [PMC free article] [PubMed] [Google Scholar]
- 31.Fischer L, Chen ZA, Rappsilber J. Quantitative cross-linking/mass spectrometry using isotope-labeled cross-linkers. J Proteomics. 2013;88:120–128. doi: 10.1016/j.jprot.2013.03.005. [DOI] [PMC free article] [PubMed] [Google Scholar]
- 32.Petrotchenko EV, Borchers CH. Crosslinking combined with mass spectrometry for structural proteomics. Mass Spectrom Rev. 2010;29:862–876. doi: 10.1002/mas.20293. [DOI] [PubMed] [Google Scholar]
- 33.Shevchenko A, Wilm M, Vorm O, Mann M. Mass spectrometric sequencing of proteins silver-stained polyacrylamide gels. Anal Chem. 1996;68:850–858. doi: 10.1021/ac950914h. [DOI] [PubMed] [Google Scholar]