

Abstract
Optical coherence tomography (OCT), scanning laser ophthalmoscopy (SLO) and other non-invasive imaging techniques are increasingly used in eye research to document disease-related changes in rodent eyes. Corneal dehydration is a major contributor to the formation of ocular opacities that can limit the repeated application of these techniques to individual animals. General anesthesia is usually required for imaging, which is accompanied by the loss of the blink reflex. As a consequence, the tear film cannot be maintained, drying occurs and the cornea becomes dehydrated. Without supplemental hydration, structural damage to the cornea quickly follows. Soon thereafter, anterior lens opacities can also develop. Collectively these changes ultimately compromise image quality, especially for studies involving repeated use of the same animal over several weeks or months. To minimize these changes, a protective shield was designed for mice and rats that prevent ocular dehydration during anesthesia. The eye shield, along with a semi-viscous ophthalmic solution, is placed over the corneas as soon as the anesthesia immobilizes the animal. Eye shields are removed for only the brief periods required for imaging and then reapplied before the fellow eye is examined. As a result, the corneal surface of each eye is exposed only for the time required for imaging. The device and detailed methods described here minimize the corneal and lens changes associated with ocular surface desiccation. When these methods are used consistently, high quality images can be obtained repeatedly from individual animals.
Keywords: Media, Opacity, Cataract, Imaging, Anterior Segment, Protective Eye Shield
1. Introduction
The use of non-invasive ocular imaging in small research animals is an increasingly important analytical tool. Many laboratories employ OCT and SLO in addition to routine conventional fundus photography to document the progression of ocular changes in research animals. A number of imaging systems are available commercially that allow investigators to assess ocular tissues in vivo in a variety of animal models, including rodents. While the instrumentation is readily obtained, high quality ocular images require that the animal procedures maintain the optical properties of the eye. In most situations, ocular images are obtained from anesthetized animals. Anesthesia abolishes the blink reflex, preventing the refreshment of the tear film required for the maintenance of corneal hydration. An eye continuously exposed to air quickly becomes dehydrated. A major challenge to the routine acquisition of high quality images involves maintaining hydration of the ocular surface. This issue is well known (Calderone et al., 1986; Hockwin and Koch, 1977; Ridder et al., 2002), but for the purpose of this methods paper, it is important to first illustrate the key features of the changes in the cornea and lens before presenting our approach to avoiding this problem.
Dehydration alters corneal topography, which begins soon after anesthesia induction and/or following topical mydriatic administration. Fig. 1 illustrates early corneal changes in a rat eye using macro photography (Fig. 1a-c), SLO (Fig. 1d) and OCT (Fig. 1e) imaging. A normal, unaffected cornea is shown by standard (Fig. 1a) and flash (Fig. 1b) macro photography. Corneal surface irregularities, revealed by flash macro photography (Fig. 1c), infrared SLO (Fig. 1d) and OCT (Fig. 1e), appear soon (<5 min) after anesthesia induction. As is evident in these illustrations, these changes include the appearance of corneal surface “pitting” (indicated by arrows in Fig. 1c-e). Once these surface changes occur, they are difficult to reverse and are typically not resolved following application of hydrating drops. Changes in the rat cornea are so pronounced that one can observe the phenomenon developing soon after anesthesia induction with the unaided eye. These irregularities alter the refractive properties of the cornea and degrade image quality by disrupting light transmission (Fig. 1f vs. Fig. 1g).
Figure 1.

Corneal changes imaged by digital macro photography (Fig. 1a-c,f-g), SLO (Fig. 1d) and OCT (Fig 1e) in a Spraque-Dawley (SD) rat anesthetized using a combination of Ketamine (150mg/kg) and Xylazine (12mg/kg). Standard (no flash) macro photography of a recently anesthetized SD rat collected under ambient room lighting with normal cornea surface morphology (Fig. 1a). The two reflections present at 12 and 2 o'clock position are reflections from the fluorescent lamp fixtures located on the laboratory ceiling. Flash macro photography of the same rat before (Fig. 1b) and after (Fig. 1c) developing corneal perturbations (black arrows) several minutes after leaving the eye exposed to air (i.e. uncovered and unprotected against dehydration). The flash photography accentuates the corneal atrophy that occurs as a result of anesthesia induction and a lack of ocular protection against corneal tear film evaporation. This same phenomenon can be observed by infrared SLO imaging (Fig.1d) which appears as “pitting” of the corneal surface (white arrows). OCT imaging (1000A-scans/B-scan) of an affected eye (Fig. 1e) shows epithelial and stromal thinning (white arrows) which contributes to a non-uniform surface for light refraction. Imaging instruments like SLO and OCT are highly dependent on corneal refraction for generating images of the posterior segment. OCT image dimensions are 1.5mm (depth) × 6mm (width). Images from the eye of a separate rat (pigmented SD Zucker) showing the influence of corneal perturbations on retinal SLO image quality (Fig 1f-g). A cornea with perturbations causes a lack of image clarity (Fig 1f). After performing a “Refresh-Reset” (see Detailed Methods section) procedure the retinal image quality dramatically improves (Fig 1g) by rehydrating the corneal stroma and epithelial cells as well as smoothing out the tear film.
The mechanisms leading to lens opacity are not well understood, although it has been shown that covering the rodent eye to prevent dehydration eliminates this problem (Ridder et al., 2002; Sparrow et al., 2013; Turner and Albassam, 2005). Lens opacities occur quickly, usually within 10 minutes in the absence of ocular surface protection (Hockwin and Koch, 1977; Nusinowitz, 2002; Ridder et al., 2002). Early changes are usually reversible and can fully absolve once the mouse has recovered from the effects of anesthesia (Bermudez et al., 2011).
We evaluated several approaches to maintain corneal hydration. Our initial attempts involved application of saline or artificial tears followed by the application of a small square of polyvinylidene chloride plastic film (a.k.a. “SARAN” wrap). While these procedures were somewhat effective in protecting the cornea, hydration drops evaporate and are absorbed over time and plastic film is difficult to remove and replace repeatedly. We also used commercially available rodent contact lenses, which have been reported by others as effectively preventing anterior segment opacities during fundus imaging (“Ocuscience”, 2013; Ridder et al., 2002; Sagdullaev et al., 2004; Seeliger et al., 2005; Sparrow et al., 2013). We experienced several problems with the routine use of these lenses: (1) Usage – The lens must be precisely applied, as well as removed, for each imaging session using forceps, which risks physical damage to the cornea. (2) Scalability – accommodatinging eyes of different sizes is not always possible since the contact lenses are rigid and nonconforming to the corneal surface. (3) Field of View - the collection of images from the peripheral retinal region can be challenging since some lenses do not cover the exposed anterior surface, which in turn requireses repeated repositioning on the corneal surface surface(Charbel Issa et al., 2012). (4) Coverage – some lenses dolenses not completely cover the anterior surface of the eye, allowing dehydration of the sclera and peripheral cornea. (5) Cost – The lenses are variable in price ($5-135) and are often expensive enough to warrant reuse. (6) Maintenance – Careful cleaning to remove debris buildup and contamination between usages is required.
Because of these issues we developed a new device that would shield the entire rodent eye, and would be easier to use than plastic film or contact lenses currently available. Of primary importance in the design was the ability for an operator to manipulate the device quickly and efficiently so as not to delay an imaging session. Here we describe this new eye shield and its use in small rodents.
2. Material and Supplies
2.1 Eye Shield Design, Prototyping and General Description
Hemispherical eye shields were designed and constructed using both measured and published eye dimensions for mice and rats (Remtulla and Hallett, 1985; Wisard et al., 2010). Two-dimensional CAD drawings were supplied to the Engineering Core Services at the Cleveland Clinic Lerner Research Institute. These drawings were converted into three-dimensional solid models using Solidworks 3D CAD (Dassault Systèmes SolidWorks Corporation Waltham, MA, USA). Rapid 3D prototypes were made with an Objet Eden260V printer using Fullcure720 resin (Stratasys, Eden Prairie, MN, USA). Currently, rapid prototypes cost several USD each to produce and can be made overnight in quantities of ∼50. Per unit cost will substantially drop if the shields move from low to high volume manufacturing methods (i.e. injection molding). In theory, the device could be disposable if usage and demand is high enough as large volume production will substantially reduce the cost by 20 to 100-fold. In present form, the shields are reused over multiple imaging sessions until they are no longer functional, which typically occurs when the handling post breaks.
The dimensions that were best suited for mice and rats are presented in Fig. 2. The primary features of the eye shield include a hemispherical hollow dome, a terminal shoulder, and a grasping post. The plastic eye shield is lightweight and adheres to the eye by surface tension when used in conjunction with a single drop (15-30 μl) of ophthalmic fluid or ointments. The hollow cavity, which is designed to be larger than the eye, covers the eye and serves as a reservoir for excess hydration fluid. The fluids we have used to generally equivalent effect include Systane® or Refresh® lubricating and artificial tears drops, which are semi-viscous or “tacky” fluids; and viscous, petroleum/mineral oil based products such as Refresh® and Lacri-lube® antibiotic ointments. The post is positioned directly at the apex of the hemispherical dome and serves as an easy grasping point for manipulation with either forceps or by fingertips. Application of fluid, combined with positioning of the shield over the eye, creates a mild vacuum allowing the device to remain in position for extended periods without dislocation. We found that the hemispherical depth that worked best for mice is one-half the diameter (i.e. radius) of the opening. For rats the dome is also hemispherical but the dome height is less than one-half the diameter of the opening. The shoulder provides a smooth, flared edge that avoids damage to the cornea. In addition, a flat surface on the shoulder increases the surface area and adhesion properties. The shield is designed to avoid to avoiddirect contact with the cornea. We have used prototype shields on every rodent we have imaged for the last 2.5 years, which to date, totals over 1700 animals. The vast majority of these animals were reimaged at later time points at least once, but up to a dozen times over a one year period after initial baseline imaging was performed. We have not observed any indication of adverse effects (i.e. toxicity) to the cornea from using the shields in this substantial cohort of animals.
Figure 2.

Engineering drawings and digital color photographs of eye shields designed for mice (Fig. 4a,b) and rats (Fig. 4c,d).
2.2 Eye Shield Proof of Concept
All experimental procedures and protocols involving animals were reviewed and approved by the Cleveland Clinic Institutional Animal Care and Use Committee. An experiment was performed on C57BL/6J mice (n=4) to demonstrate the utility of the eye shield. As soon as the mouse became immobile following anesthesia induction (65mg/kg Sodium Pentobarbital), mydriasis treatment (1.5 μl drop/eye of 0.5% Mydrin®-P Tropicamide/Phenylephrine, Santen Pharmaceutical Co., Ltd, Japan) was administered to both eyes followed by the application of a single drop of Systane® Ultra (Alcon Laboratories, Ft. Worth, TX) in conjunction with prototype eye shields. Eye shields were kept in place for approximately 2 minutes while the mouse was transferred to an AIM-RAS (Animal Imaging Mount-Rodent Alignment System) mouse holder (Bioptigen, Inc., Durham, NC, USA). A Spectral-Domain Optical Coherence Tomography System (840HR SDOIS, Bioptigen, Inc., Durham, NC, USA) was used to collect image volumes from the anterior segment of the eye, which included the cornea, iris and lens. Each OCT volume was 250 A-scans/B-scan by 250 B-scans/volume with imaging dimensions of 5mm (azimuth) × 5mm (elevation) × 2.3 mm (depth).
Fig. 3 shows representative OCT B-scan images from the experiment. Adjacent to each B-scan is an in-depth intensity profile showing back-scattered/reflected signal collected from the anterior segment. The intensity profiles were obtained from each B-scan using ImageJ (Rasband). Each profile is the average of 25 adjacent A-scans through the central cornea. Qualitative imaging data was converted into intensity profiles allowing the quantitative assessment of the magnitude of scatter as a function of depth. Scattering magnitude from the anterior lens region was determined using an area under the curve algorithm in Graphpad Prism v6.0a (GraphPad Software, Inc., La Jolla, CA, USA).
Figure 3.
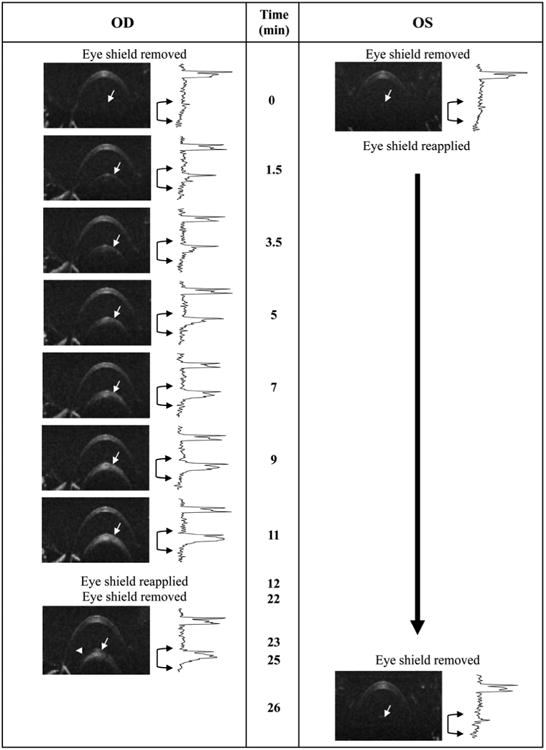
Representative demonstration of the utility of protective eye shields against opacity formation in an anesthetized wild type (C57BL/6J) mouse. In this example the right eye (OD) was exposed to room air for an extended period (∼10 minutes) without supplemental hydration, blinking or ocular protection, while the left eye (OS) remained protected by an eye shield and artificial tears (Systane Ultra). After ∼1.5 minutes of exposure, changes in the anterior lens (white arrows) can be seen in the right eye. More pronounced changes are observed after 3-5 minutes which continue to worsen as time elapses. At 12 minutes the right eye was covered using an eye shield in conjunction with Systane Ultra. Approximately 10 minutes later (22 min elapsed time), the eye shield was removed and the eye reimaged. For comparison, the left eye of the animal was covered with an eye shield throughout the entire duration of the imaging experiment with the right eye and then imaged after an elapsed time of 25 minutes. Beside each OCT image of the anterior segment is an intensity vs. depth profile obtained from the neighboring B-scan image. The profile reveals the scattering signal amplitude as a function of OCT imaging depth. In an opacity free animal, two primary peaks, one thick and the other narrow, are observed which originate from, and correspond to the cornea and lens capsule (white arrows), respectively. As the opacity begins to form an elevation in scattering signal amplitude begins to increase below the lens capsule boundary, which is apparent in the in-depth intensity profiles (black brackets with arrows). OCT B-scans (250A-scans/B-scan) are 1mm (depth) × 5mm (width). Experiment performed under lab environment conditions (75°F, 47% relative humidity) without any supplemental heating to maintain animal body temperature.
Fig. 3 illustrates the rapid development of anterior segment opacities in an unprotected versus eye shield protected eye. At baseline (t=0) the eye shield covering the left eye was removed and any residual fluid was removed from the cornea using a cotton-tipped applicator. The lids were mechanically blinked several times to restore a natural tear film on the cornea. An OCT B-scan was collected and the eye shield was immediately reapplied. This procedure was then repeated on the right eye but without reapplying the eye shield. B-scans were then collected over the next 11 minutes on the right eye without any hydration or mechanical blinking. Lens opacity onset occurred as early as 1.5 minutes (white arrows) and increased linearly over time (Fig. 3). After 11 minutes of observation and imaging, a drop of Systane Ultra was administered to the right eye and the protective eye shield reapplied. Ten minutes later, the eye shield and fluid were once again removed and another B-scan of the anterior segment was collected. A quantitative comparison between OCT images at 11 and 23 minutes reveals that the right eye opacity appears to slightly recede after being hydrated and covered. This is further supported by the quantitative data presented in Fig. 4, which illustrates stabilization and slight reduction (∼20%) of the in-depth scattering signal magnitude between 11 and 23 minutes. Also shown in Fig. 3 is data collected from the left eye that remained protected for the entire duration of the time used to acquire all the images collected from the right eye. After being in place for 25 min., the eye shield on the left eye was removed and a B-scan of the anterior segment was collected. No apparent lens opacity developed during this period and in fact, opacity levels observed at the later time were below those observed at baseline.
Figure 4.

Media (anterior lens) opacity changes plotted as a function of time for protected and unprotected eyes in anesthetized wild type mice (n=4). Qualitative imaging data (OCT B-scans converted to in-depth intensity profiles) from Figure 3 was analyzed using an area-under-the-curve (AUC) algorithm to obtain opacity scattering magnitudes from the anterior lens region. Media scattering is shown as AUC magnitude (primary axis) and as percent change (secondary axis) relative to the first imaging time point (t0) collected immediately after removing the eye shield. A steep linear increase in scattering (∼25% min-1, P<0.0001) is observed in the anterior lens of the right eye (“OD exposed”) which stabilizes, and even begins to slightly resolve (n.s.), after an eye shield and artificial tears are applied (“OD covered”). In contrast, the left eye (“OS covered”) remains free of opacity for over 25 minutes when protected by an eye shield. On average, scattering magnitudes in the protected left eye improves by ∼35%, but is a nonsignificant (n.s.) reduction in scattering magnitude relative to the initially recorded baseline levels. Data shown as Mean +/- SD. Ordinary one-way Anova with a Dunnett's multiple comparisons test.
Fig. 4 contains a display of the scattering intensity changes related to opacity progression as a function of time. The in-depth signal amplitude from the anterior lens region of the left eye was on average ∼35% lower than that observed at baseline after 25 minutes of eye shield use but this difference was not statistically significant. Figure 5 shows digital microphotograph of unprotected (with media opacity) and protected (without media opacity) mouse eyes collected after performing the experiment shown in Fig. 3.
Figure 5.

Representative digital color photographs (oblique view taken from the nasal direction) from the eyes of two mice immediately after undergoing the experiment shown in Fig. 3. Right eyes show evidence (blue-gray hue) of media opacities. In contrast, left eyes are completely free (dark with no evidence of the color hue) of opacity.
This example demonstrates that protective eye shields, when used in conjunction with hydrating drops, can reduce a rodent's susceptibility to media opacity formation, as well as also potentially stabilize and/or slightly reduce existing opacities if they have already occurred.
3. Detailed Methods
It is useful to divide an imaging session into three distinct phases Preimaging Preparation, Imaging and Post-imaging Care. Each phase incorporates key procedures that are important for optimal maintenance of the eye, quality of the image and recovery of animal for additional imaging at a later time. The eye shields serve an integral part within each one of these phases of care.
3.1 Preimaging Prepartion
Obtain the animal weight so that the correct anesthesia dose can be prepared and administrated. Place the mouse into a humidified, bottom-warmed, holding chamber and wait for anesthesia to take effect (∼5 minutes). Once inactive and immobilized, immediately remove animal from the chamber, apply mydriasis treatment to eyes (Note: dilation drops can also be applied prior to anesthesia induction as an alternative). Perform manual eyelid blinking to evenly distribute the dilation drops over the cornea and promote uniform absorption (Note: a few blinks are adequate). Trim vibrissae and apply one drop of semi-viscous artificial tears to each eye. Cover both eyes with protective eye shields and return animal to the chamber/warming plate and wait (∼5 minutes min) until pupils are dilated.
3.2 Imaging Session
With eye shields covering both eyes, transfer the animal to the appropriate holder for imaging. Prepare the 1st eye for imaging by grossly aligning near the front of objective lens or beam path of the imaging instrument. Remove the cup from the eye to be imaged and commence imaging. While imaging, reapply hydration drops as needed or if time period exceeds 90 seconds (Note: alternating between BSS and artificial tears seems to work well, i.e. if one type of hydrating fluid does not seem to improve the image, try the other one) and remove excess fluid using cotton-tip applicator. Once imaging is completed on the first eye, reapply viscous drops and the eye shield. Rotate animal for imaging the fellow eye and repeat the procedure on the fellow eye.
Occasionally, one may need to “refresh and reset” the eye if a shield has been left in place for an extended period of time. This can be accomplished by applying a drop of saline and then mechanically blinking the lids a few times while simultaneously wicking away the excess fluid. After this procedure, the same process can be repeated with artificial tears. After smoothing the tear film by blinking it is helpful to finish by brushing away the upper eyelashes (which are not visible to the naked eye) with an upward sweeping motion from nasal to temporal simultaneously while introducing some ventral to dorsal action as well. This technique will ensure that lashes do not interfere with the optical imaging pathway.
3.3 Post Imaging Care
After imaging, the animal must be protected against the lingering effects of general anesthesia. Remove eye shields from both eyes and apply a petroleum-based ophthalmic ointment to the eyes. Cover with protective eye shields to smooth out ointment over the ocular surface. Place animal in a bottom warmed (30-33°C), oxygenated (>21-40%) translucent chamber for recovery. As mice recover they will displace the eye shields which will indicate the time their blink response has returned and they are now ready to be returned to caging in the vivarium.
4. Potential Pitfalls and Trouble Shooting
4.1. Exposure
We cannot overemphasize the importance of limiting the exposure of the ocular surface to air throughout the imaging session. For the novice, it is easy to become caught up in the task of imaging and forget to provide supplemental hydration. To avoid this, we find it helpful to set up a timed alarm as a reminder to rehydrate the cornea. Continuous monitoring of a watch or clock is simply not practical as it is too distracting and requires looking away from the imaging job. An ideal tool for the beginner is a timer with a user selectable interval, alarm and automatic reset periods that continue to repeat until manually stopped by the user. This device enables one to set up a continuous reminder that it is time to perform a particular task, in this case, providing supplemental hydration. Employing this technique can be an invaluable training tool when trying to reposition the animal and/or instrument to obtain specific regions or views of the eye. A good option is to download an interval timer to a smart phone from an online application store.
4.2 Laboratory environmental conditions
There are a number of general laboratory conditions that can degrade the quality of imaging data. For example, the circulation and convection of air from climate control systems, electronics, instruments and movement of laboratory personnel can increase the rate of corneal dehydration. Overhead air vents are running constantly and their position in relationship to the experimental work area can have a major impact on evaporation or desiccation rate. If necessary, isolation baffles (above, below, around, etc) can be installed to protect the animal from exposure to convective air currents.
We also monitor temperature and humidity with a digital sensor located near the imaging work area. Daily and/or seasonal outdoor weather factors can influence the indoor environment of laboratories within buildings. Relative humidity in our building drops from 50% in warm months to less than 20% in the winter. Such excursions in environmental humidity drastically alter the rate of evaporation requiring more frequent corneal hydration regiment.
4.3 Anesthesia and Mydriatics
The influence of anesthesia, both in regards to agent and dose, on media opacity formation has been reported and well summarized by Ridder et al (Ridder et al., 2002). However, for fundus imaging one must also consider the potential effects of mydriatics on opacity formation as well. We found that mydriasis drug treatments should be matched to the size of the animal and reducing the dose for pupil dilation can be beneficial. Mydriatic drug concentrations and dropper bottle dispensing volumes were designed for human use and not small animals. We drastically scaled down our mydriasis dose (∼ 30 × reductions in volume and 80× drug concentration) to a size more appropriate for the animal being studied. As a result, we use only 0.5-1.5μl of Tropicamide (0.5%) and Phenylephrine (0.5%) in mice. This range is sufficient for the vast majority of imaging experiments. Non-pigmented mice like BALB/c require less (0.5-1μl) than pigmented mice (1-1.5μl). Drops should never be left as a bolus on the corneal surface.
Phenylephrine is an adrenergic receptor agonist and in addition to causing mydriasis, causes vasoconstriction, muscle relaxation, and ocular proptosis (Dugdale, 2010b). The latter can be advantageous in that it relaxes the extraocular muscles allowing the eye to protrude from the orbit beyond the superior and inferior eyelids. This phenomenon creates an ideal condition for imaging since the lids are no longer covering the pupil. An unobstructed pupil provides a clear path to the posterior pole and results in optimal images of the retina. However, the negative aspect of this effect is that more surface area of the eye is exposed to air. Thus, allowing more exposure of the anterior segment of the eye contributing to more rapid evaporation and dehydration (i.e. sclera in addition to cornea) (Rolando and Refojo, 1983). This same phenomenon occurs with Ketamine/Xylazine anesthesia as well since Xylazine is also an adrenergic receptor agonist, resulting in vasoconstriction, muscle relaxation, and ocular proptosis. To minimize these effects, we try and minimize the doses of adrenergic agents used for imaging studies.
We have noted that rodents seem to be more susceptible to opacity formation and epithelial atrophy soon after anesthesia or application of mydriasis drugs (see Fig. 1). While the cause is unknown, several possibilities exist: excess anesthesia drug concentration and distribution kinetics, intraocular pressure (IOP), lack of tear film production from Meibomian glands, aqueous biochemical alterations, and disruption of aqueous humor flow. It has been shown that intraocular pressure of rats anesthetized with Ketamine/Xylazine experience a rapid, short term IOP spike that lasts less than 5 minutes (Ding et al., 2011). Interestingly, in our experience, transient corneal atrophy (i.e. “pitting” as shown in Figure 1c-e) only occurs soon after anesthesia induction and dramatically subsides in prevalence if one waits some time before exposing the eye. Ocular protection with eye shields during this period has helped us minimize occurrence of this phenomenon specifically while performing rat imaging studies.
4.4 Temperature and Humidify
If using inhalation anesthetics and/or medical grade gases, be aware that they are devoid of moisture (Dugdale, 2010a). Dry gasses flowing over the animal will rapidly deplete the tear film. Unconscious animals in an anesthesia induction chamber are especially vulnerable if they are near the port for incoming gasses. When using an induction chamber, it is important to ensure that anesthetized animals do not become incapacitated directly in front of an inflow or outflow port. One way to avoid corneal drying when using such a device is to increase the humidity levels within the chamber. This can be accomplished using an inline humidifier or by placing a damp towel on the bottom of chamber assuming it is heated from below.
4.5 Monitoring and Awareness
We find it helpful to examine the condition of the eye frequently during each step of a procedure using a bright (100 lumens), blue-dominant LED flashlight (Inova Bolt 2L Series, Nite Ize, Inc., Boulder, CO, USA) as opposed to a flashlight with a red-dominant tungsten-halogen bulb. Shorter wavelengths (blue) will scatter more light from the opacity than longer wavelengths (red), thus providing better sensitivity for detecting and following them throughout the imaging session. Subtle opacities are difficult to visualize unless adequate illumination is available. The brightness is important to permit illumination and viewing of the animals' eye from a distance. When examining an animal for opacities it is best to apply a drop of artificial tears and then illuminate the eye at an oblique angle relative to your line of sight. This procedure will minimize corneal reflections and accentuate light-scattering from the media opacity.
4.6 Time
Finally, there is no substitute for having a well-defined and well-structured routine that prevents loss of time when an animal is under anesthesia. Being able to collect high quality images quickly is of vital importance. The longer one takes for imaging, the higher the probability that the animal will develop opacities. It is important to have every tool needed during a session at hand. An excellent training tool for new users is the Bioptigen practice mouse (Bioptigen, Inc., Durham, NC, USA). This model mouse enables one to practice aligning and imaging a rodent as often as needed to build the necessary eye-hand coordination and muscle memory required to perform retinal imaging using OCT, SLO, or visible fundus imaging. If one is new to these imaging procedures, it is very helpful to go into the lab over a period of several days and/or weeks to conduct repeated imaging sessions with the mouse model. Alternatively, if the mouse model is not available, some other target phantom will work as well to these hone skills. These exercises will increase ones proficiency and lead to improved imaging outcomes. When the procedures described here are followed, high quality fundus images of mice and/or rats can be realized.
Acknowledgments
We like to thank Ryan Klatte and Mark Howell from the Cleveland Clinic Lerner Research Institute Engineering Design Core services for their expertise and assistance in providing eye shield rapid prototypes. We also thank Mary E. Rayborn, Neal S. Peachey and Nancy Bell for constructive comments and review of the manuscript. The study was supported in part by National Institutes of Health Grant R01-EY14240, an unrestricted grant from Research to Prevent Blindness, a Foundation Fighting Blindness Research Center Grant, The Wolf Family Foundation, the Llura and Gordon Gund Foundation, and the Cleveland Clinic.
Footnotes
Publisher's Disclaimer: This is a PDF file of an unedited manuscript that has been accepted for publication. As a service to our customers we are providing this early version of the manuscript. The manuscript will undergo copyediting, typesetting, and review of the resulting proof before it is published in its final citable form. Please note that during the production process errors may be discovered which could affect the content, and all legal disclaimers that apply to the journal pertain.
References
- Ocuscience. Electrodes and Accessories: Mini Contact Lenses. Xenotec, Inc; Rolla, MO: 2013. [Google Scholar]
- Bermudez MA, Vicente AF, Romero MC, Arcos MD, Abalo JM, Gonzalez F. Time Course of Cold Cataract Development in Anesthetized Mice. Current eye research. 2011;36:278–284. doi: 10.3109/02713683.2010.542868. [DOI] [PubMed] [Google Scholar]
- Calderone L, Grimes P, Shalev M. Acute reversible cataract induced by xylazine and by ketamine-xylazine anesthesia in rats and mice. Experimental eye research. 1986;42:331–337. doi: 10.1016/0014-4835(86)90026-6. [DOI] [PubMed] [Google Scholar]
- Charbel Issa P, Singh MS, Lipinski DM, Chong NV, Delori FC, Barnard AR, MacLaren RE. Optimization of in vivo confocal autofluorescence imaging of the ocular fundus in mice and its application to models of human retinal degeneration. Invest Ophthalmol Vis Sci. 2012;53:1066–1075. doi: 10.1167/iovs.11-8767. [DOI] [PMC free article] [PubMed] [Google Scholar]
- Ding C, Wang P, Tian N. Effect of general anesthetics on IOP in elevated IOP mouse model. Experimental eye research. 2011;92:512–520. doi: 10.1016/j.exer.2011.03.016. [DOI] [PMC free article] [PubMed] [Google Scholar]
- Dugdale A. Respiratory emergencies, Veterinary anaesthesia: principles to practice. Blackwell Pub.; Chichester, West Sussex; Ames, Iowa: 2010a. pp. 347–353. [Google Scholar]
- Dugdale A. Small animal sedation and premedication, Veterinary anaesthesia: principles to practice. Blackwell Pub.; Chichester, West Sussex; Ames, Iowa: 2010b. pp. 30–44. [Google Scholar]
- Hockwin O, Koch HR. Arzneimittelnebenwirkungen am Auge. Gustav Fischer; Stuttgart: 1977. [Google Scholar]
- Nusinowitz SRI, W H, Heckenlively JR. Electrophysiology Testing of the Mouse Visual System. In: Smith RS, editor. Systematic evaluation of the mouse eye: anatomy, pathology, and biomethods. CRC Press; 2002. pp. 320–344. [Google Scholar]
- Rasband WS. ImageJ, U S National Institutes of Health, Bethesda, Maryland, USA. 1997-2012 http://imagej.nih.gov/ij/
- Remtulla S, Hallett PE. A schematic eye for the mouse, and comparisons with the rat. Vision research. 1985;25:21–31. doi: 10.1016/0042-6989(85)90076-8. [DOI] [PubMed] [Google Scholar]
- Ridder W, 3rd, Nusinowitz S, Heckenlively JR. Causes of cataract development in anesthetized mice. Experimental eye research. 2002;75:365–370. doi: 10.1006/exer.2002.2007. [DOI] [PubMed] [Google Scholar]
- Rolando M, Refojo MF. Tear evaporimeter for measuring water evaporation rate from the tear film under controlled conditions in humans. Experimental eye research. 1983;36:25–33. doi: 10.1016/0014-4835(83)90086-6. [DOI] [PubMed] [Google Scholar]
- Sagdullaev BT, DeMarco PJ, McCall MA. Improved contact lens electrode for corneal ERG recordings in mice. Doc Ophthalmol. 2004;108:181–184. doi: 10.1007/s10633-004-5734-1. [DOI] [PubMed] [Google Scholar]
- Seeliger MW, Beck SC, Pereyra-Munoz N, Dangel S, Tsai JY, Luhmann UF, van de Pavert SA, Wijnholds J, Samardzija M, Wenzel A, Zrenner E, Narfstrom K, Fahl E, Tanimoto N, Acar N, Tonagel F. In vivo confocal imaging of the retina in animal models using scanning laser ophthalmoscopy. Vision research. 2005;45:3512–3519. doi: 10.1016/j.visres.2005.08.014. [DOI] [PubMed] [Google Scholar]
- Sparrow JR, Blonska A, Flynn E, Duncker T, Greenberg JP, Secondi R, Ueda K, Delori FC. Quantitative fundus autofluorescence in mice: correlation with HPLC quantitation of RPE lipofuscin and measurement of retina outer nuclear layer thickness. Investigative ophthalmology & visual science. 2013;54:2812–2820. doi: 10.1167/iovs.12-11490. [DOI] [PMC free article] [PubMed] [Google Scholar]
- Turner PV, Albassam MA. Susceptibility of rats to corneal lesions after injectable anesthesia. Comparative medicine. 2005;55:175–182. [PubMed] [Google Scholar]
- Wisard J, Chrenek MA, Wright C, Dalal N, Pardue MT, Boatright JH, Nickerson JM. Non-contact measurement of linear external dimensions of the mouse eye. J Neurosci Methods. 2010;187:156–166. doi: 10.1016/j.jneumeth.2010.01.006. [DOI] [PMC free article] [PubMed] [Google Scholar]