

Abstract
Migration is a common strategy used by birds that breed in seasonal environments. The patterns and determinants of migration routes, however, remain poorly understood. Recent empirical analyses have demonstrated that the locations of two North America migration flyways (eastern and western) shift seasonally, reflecting the influence of looped migration strategies. For the eastern but not western flyway, seasonal variation in atmospheric circulation has been identified as an explanation. Here, we test an alternative explanation based on the phenology of ecological productivity, which may be of greater relevance in western North America, where phenology is more broadly dictated by elevation. Migrants in the western flyway selected lower-elevation spring routes that were wetter, greener and more productive, and higher-elevation autumn routes that were less green and less productive, but probably more direct. Migrants in the eastern flyway showed little season variation but maintained associations with maximum regional greenness. Our findings suggest the annual phenology of ecological productivity is associated with en route timing in both flyways, and the spring phenology of ecological productivity contributes to the use of looped strategies in the western flyway. This fine-tuned spatial synchronization may be disrupted when changing climate induces a mismatch between food availability and needs.
Keywords: eBird, ecological productivity, green-wave hypothesis, looped migration, migration flyway, seasonal bird migration
1. Introduction
Regular seasonal migration between wintering and breeding grounds is a common strategy used by birds that breed in seasonal environments [1]. For terrestrial birds breeding in North America, species' individual migration routes can be aggregated geographically into three migration flyways: eastern, central and western [2]. Species in the eastern and central flyways winter primarily in the Caribbean, South America and Central America, and migrate to breeding grounds in the eastern and northern portions of North America. Species in the western flyway, in contrast, winter primarily in Mexico and Central America, and breed in the western portion of North America. The seasonal locations of the eastern and central flyways overlap geographically, whereas the western flyway is more distinct. An interesting feature shared by the eastern and western flyways is that birds tend to migrate northward in the spring west of their southward trajectory in the autumn, generating a looped migration trajectory [3]. Looped migration strategies in the eastern and western flyways result in potentially longer migration journeys in the spring for species in both flyways [2].
The phenomenon of looped migration is not unusual and is thought to reflect the influence of seasonal differences in en route conditions encountered during migration [1]. For the eastern flyway in North America, current evidence suggests atmospheric conditions, namely the presence of a southerly low-level jet stream over the Gulf of Mexico in spring [4], promotes longer and more western spring migration routes [2]. For the western flyway in North America, there is no evidence that high-altitude winds are responsible for the seasonal shift in flyway location [2]. Which non-atmospheric factors are involved has not been determined. Results from studies of small numbers of individuals and species [5–7] travelling between Europe and Africa have similarly suggested but not yet clearly determined the extent to which non-atmospheric factors shape looped migration.
Contrasting physical and biotic environments in western and eastern North America suggest potential causes for the presence of looped migration in the western flyway. In general, the climate in western North America is more arid, elevations are higher, and the topography is much more varied and complex than in eastern North America (see the electronic supplementary material, figure S1). Relative to the deciduous-forest-dominated east, the structure and composition of biotic environments in the west are much more heterogeneous across space [8]. In addition, vegetation green-up in the west occurs later in the season and over a longer period of time, and is strongly dictated by elevation [9,10] (see the electronic supplementary material, figure S2).
These environmental differences are relevant for avian migration ecology on several fronts. First, migratory birds on their wintering grounds are thought to rely on endogenous circannual rhythms or, when available, photoperiod to cue the initiation of spring migration [11]. Once migration is started, evidence indicates that en route decisions are made based on environmental cues related to different measures of ecological productivity, including temperature [12–14] and greenness [15]. Second, there is evidence that processes operating in one season can influence the success of individuals during the following season [16]. For birds, these carry-over effects have been typically examined between the non-breeding and breeding seasons [17,18]. Similar processes operating during spring migration may also affect breeding success [13,19]. Third, spring migration differs from autumn migration in that species must acquire sufficient energy to both complete the migratory journey and, depending on the particular migration scenario, to initiate breeding activities once arriving on the breeding grounds [20–22]. Different optimality strategies may therefore apply to balance the requirements of time, energy and risk that are uniquely associated with spring and autumn migration [23]. In total, the selection of migration routes, especially spring migration routes, may be more adaptive if they coincide with abundant and reliable energy resources that improve the chances of both completing migration and breeding successfully.
These ideas fall under the context of the green-wave hypothesis, which posits that migratory herbivores follow climatic gradients along latitude or elevation in order to time their journeys and stopover visits to synchronize with the spring flush of nutrient-rich plants [24,25]. The green-wave hypothesis has received empirical support for geese [13,26,27] and ungulates [28,29]. Because of the close ecological relationship between the phenology of plants and insects [30], we propose extending the green-wave hypothesis to include insects, a group having more relevance for the insectivorous bird species that make up the majority of the terrestrial migrants within the region. More broadly, the quantity and quality of plant resources provides a mechanistic basis for determining insect population size [31], and many insect species require young or growing plant tissues early in their life cycles [32,33]. Younger plant tissues are typically more nutritious, contain fewer physical and chemical defences, and tend to be most plentiful in the spring. Therefore, insectivorous birds en route during spring migration might track the flush of insect populations whose emergence coincides with the phenological ‘window of opportunity’ of new plant growth [32,34,35].
In summary, within the western flyway in North America, we hypothesize that the location of spring migration routes is determined by patterns of insect phenology across climatic gradients of latitude and elevation; these patterns are likely to be very different from those occurring in the autumn in western North America, and also very different from those occurring in eastern North America. The first initiation of insect growth in the west starts at lower latitudes and lower elevations. Because climatic gradients are more compressed spatially along elevation, as spring progresses the flush of insect populations will progress more rapidly across space northward than upslope. The most adaptive migration strategy would then be to track this emerging productivity, even if this requires a longer migration journey, to avoid less productive higher-elevation regions. During the breeding season, the flush of insect populations will have abated in the east, but may continue to progress upslope in the west. During autumn migration, even though insect populations may continue to expand upslope in the more northerly regions of western North America, the most adaptive migration strategy for the return trip to the wintering grounds, especially when atmospheric conditions are generally poorly suited for southward migration [2], is to take the most direct geographical route, which may not traverse regions of greatest productivity. This explanation is supported by evidence that looped migration for some migrants that travel between Europe and Africa results in autumn migration routes that are more direct [7] and traverse regions with lower ecological productivity [6] relative to spring routes.
To test this hypothesis, we use weekly estimates of probability of occurrence for species in the eastern and western North American migration flyways derived from spatio-temporal exploratory models (STEM) [36], and occurrence information from the eBird citizen-science database [37] for the combined period 2004–2011. With these estimates, we calculate species' weekly associations with elevation and four common measures used to estimate ecological productivity: temperature, precipitation, greenness and net primary productivity (NPP). We contrast species' observed weekly associations with these four measures with weekly expectations derived from three alternative migration scenarios (figure 1). The first scenario estimates the breadth of ecological productivity available to a species based on its current migration strategy, whereas the second and third scenarios estimate the ecological productivity available to a species if it always followed either its spring or autumn migration route. Based on our hypothesis, we expect elevation associations in the western flyway to be lower during spring migration and higher during autumn migration. We expect species in the western flyway to track the regional peak in ecological productivity during spring migration but not during autumn migration. Finally, we would expect these patterns to be less evident in the eastern flyway.
Figure 1.
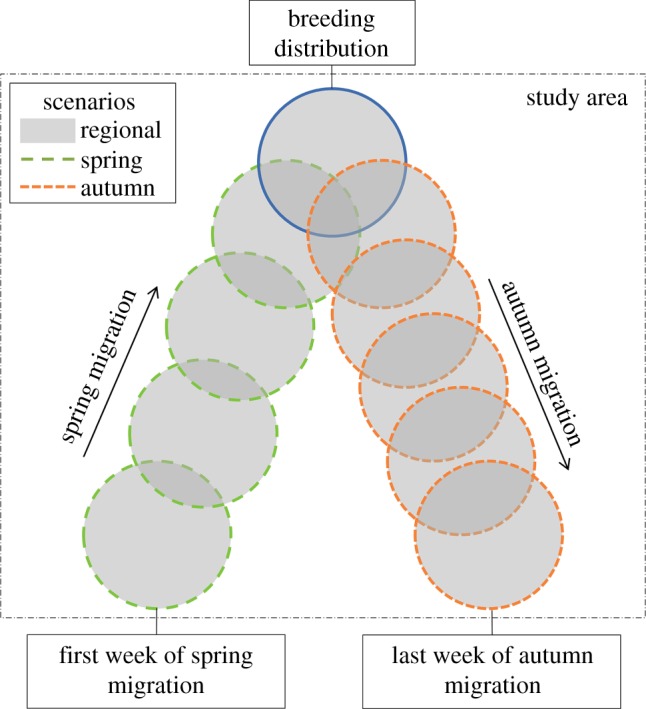
Conceptual diagram showing geographical extent-of-occurrence by week (circles) for an individual species within the study area from the beginning of spring migration (long dash), through the breeding season (solid), to the end of autumn migration (short dash), and the regions used in three alternative migration scenarios. The regional migration scenario estimates the range of possible associations available to each species, the spring migration scenario estimates associations had species used their spring migration route in the autumn and the autumn migration scenario estimates associations had species used their autumn migration route in the spring (see Material and methods for details on scenarios).
2. Material and methods
Using a macroecological perspective, we examined how the weekly distributions of multiple species identified in the eastern and western North American migration flyways [2] intersect geographically with elevation and four measures of ecological productivity. We first combine, across species in each flyway, fine-resolution information on spatial and temporal variation in biological and environmental conditions. We then determine the spatial association across the annual cycle between species' distributions and environmental conditions. Lastly, we test predictions by contrasting how observed associations for migrants in each flyway are related to expectations developed under three alternative migration scenarios (figure 1).
(a). Avian data compilation and preparation
In previous work [2], we clustered 93 species into three autumn migration flyways in North America, classified as western (n = 31), central (n = 17) and eastern (n = 45). From these species, we selected for analysis 26 from the western flyway, 6 from the central flyway and 25 from the eastern flyway (see the electronic supplementary material, table S1). We selected species that displayed breeding and migratory distributions that were largely contained within our study area, the contiguous USA, and whose distributions occurred primarily east or west of the 103rd meridian (see the electronic supplementary material, figure S3). This procedure excluded from analysis widespread species having potentially several migratory populations and species whose breeding ranges were located predominantly north of the study area. Because the central and eastern flyways overlap geographically and are distinct from the western flyway [2], we combined the eastern and central flyway species in our analysis, hereafter classified as eastern flyway species.
We compiled occurrence data for the 57 bird species from the eBird citizen-science database [37]. eBird is a global network of volunteers who submit bird observations, in checklist format, to a central data depository. Quality control includes structured protocols for data entry, automated data filters and a large network of regional editors [37]. We modelled weekly probabilities of occurrence for each species using STEM [36]. In STEM, we used eBird checklists collected under the ‘travelling count’ and ‘stationary count’ protocols from 1 January 2004 to 31 December 2011 where all species observed by sight or sound were recorded. We restricted our data to checklists having travelling distances less than 8.1 km, start times to daylight hours between 5.00 and 20.00, and total search times less than 3 h.
We used STEM to capture multi-scale structure in species distributions through time. This allowed us to analyse broad-scale patterns as they varied through time, while taking into account fine-scale, species-specific spatial patterning captured by varying associations with local land covers. STEM is a mixture model designed to adapt to non-stationary spatio-temporal processes. This is achieved by creating a randomized ensemble of overlapping local models, each based on data from a restricted geographical and temporal extent [36]. Boosted decision tree base models were used to learn the associations between observed patterns of bird occurrence (eBird data) and local land cover characteristics based on the National Land Cover Database [38]. These models are then used to make estimates of each species's distribution throughout the year based on local land cover characteristics. For each species, a separate model was fitted, and species' probabilities of occurrence, corrected for variation in detection rates, were estimated across the contiguous USA with one daily estimate calculated per week for all 52 weeks of a calendar year. From these models, species' weekly distributions were estimated at 933 688 geographically stratified random (SRD) points distributed at a density of roughly one per 3 × 3 km within the contiguous USA (see the electronic supplementary material, figure S3).
Using the same procedure described in [3], we identified the first week of spring migration and the last week of autumn migration for each species using the weekly frequency of SRD points with probabilities of occurrence more than 0. Because of the smoothing implemented under STEM, estimated distributions often contain large areas with very small, but non-zero, estimated occurrence, especially along boundaries of species' ranges. To focus our analysis on the core regions where species occurred, for each week we rounded to zero probabilities of occurrence that were below the 80% percentile of the distribution of probabilities of occurrence more than 0. The 80% percentile was selected because it was found to effectively remove SRD points with extremely low probabilities of occurrence at the edge of species' distributions in a consistent fashion across species.
(b). Environmental data compilation and preparation
We used four variables to describe spatio-temporal variation in ecological productivity in our analysis: temperature, precipitation, vegetation greenness and NPP (see the electronic supplementary material, figure S2). Our temperature data were daily mean surface temperature and our precipitation data were daily total precipitation, both sets of information coming from the PRISM climate group (Oregon State University, http://prism.oregonstate.edu) gridded at a 30 s spatial resolution. We averaged all years' daily temperature and precipitation values over the combined period 2004 to 2011. Vegetation greenness was estimated using the Enhanced Vegetation Index (EVI) [39] derived from the Moderate Resolution Imaging Spectroradiometer (MODIS) satellite [40]. EVI measures canopy greenness, a composite property of canopy structure, leaf area and canopy chlorophyll content [41]. We used EVI values calculated at 1 km spatial resolution and 16-day composite periods (MOD13A2 V.005). For our analysis, we averaged EVI values across the 16-day composite periods for the years 2004 to 2011. NPP was estimated by the MODIS-derived Net Photosynthesis (PSN) index, defined as gross primary productivity minus maintenance respiration [42,43]. We used PSN estimates produced at 1 km resolution and 8-day composite periods (MOD17A2 V.055). PSN is in units of kilograms of carbon produced per square metre. We averaged PSN values across the 8-day composite periods for the years 2004 to 2010. Lastly, we compiled elevation data for the study area at a 30 s spatial resolution [44] (see the electronic supplementary material, figure S1).
(c). Analysis
We extracted values for elevation and the four environmental measures for each of the 933 688 SRD points based on the geographical intersection of the gridded elevation and environmental data and the SRD points (see the electronic supplementary material, figures S1–S3). For data with a temporal component, the intersection was based on the day or composite period that contained the median day for each of the 52 weeks. For each of the 57 species, we calculated the weighted average of each variable with a temporal component for the weeks occurring from the beginning of spring migration to the end of autumn migration for that species. Weights for each species were based on the probability of occurrence estimated at the SRD points for that week and for that species from STEM.
We used generalized additive mixed models (GAMMs) fitted separately to data from birds in each flyway to summarize how species' associations with each variable, elevation and the four environmental measures varied across the annual cycle. Species was treated as a random effect in each model to take into account among-species variation in their associations with elevation and the four environmental measures. To minimize the potential for over-extrapolation with the four environmental variables due to small sample sizes (numbers of species) during the beginning of spring migration and the end of autumn migration, GAMMs were only fitted to data from weeks when more than four species were present. This resulted in the analysis being conducted for the time period between 9 March and 2 November.
To test our predictions on how we expect species' associations with ecological productivity to be defined by season and flyway, we contrasted observed associations with the four environmental measures with those generated based on three alternative migration scenarios. The first scenario estimated the breadth of ecological productivity available to each species based on its existing distribution and migration strategy; the second and third scenarios estimated associations with ecological productivity if the species did not follow a looped migration strategy (figure 1). The first scenario (regional) estimated species' associations with each environmental measure as if species were able to track minimum or maximum values within the geographical extent of their occurrence across the annual cycle as defined within the study area. The second scenario (spring) estimated associations with each measure if species used their spring migration routes in both the spring and autumn. The third scenario (autumn) estimated associations if species used their autumn migration routes in both the autumn and spring.
Several steps were used to implement the regional scenario for each species (figure 1). First, all of the SRD points where the species had probability of occurrences more than 0 across the annual cycle (spring migration, breeding and autumn migration) were identified. Second, for each of the 52 weeks of the year, minimum and maximum values for each measure for that week were calculated across the set of SRD points. GAMM was then applied separately to the minimum and maximum values with species as a random effect. The predicted values from the two GAMMs bounded the range of possible environmental conditions birds could encounter each week in their flyway. The location of the observed GAMM fit and its 95% confidence band relative to these boundaries was used to determine the degree to which species tracked maximum or minimum environmental conditions at different phases of the annual cycle.
The procedures for examining the second and third alternative migration scenarios identified new spring and autumn associations for each environmental measure by extracting weekly values (weighted averages) by species that, once reaching the middle of the breeding season, returned along the same spring or autumn migration route using the same SRD points and associated STEM-derived probabilities of occurrence (figure 1). The week that we treated as the middle of the breeding season was identified for each species based on the median week between that species's estimated first day of spring migration and the last day of autumn migration. The product of these two alternative migration scenarios was summarized across the annual cycle for each flyway using GAMM with species as a random effect. The location of the observed GAMM fit and its 95% confidence band relative to the GAMM fit for the spring and autumn migration scenarios was used to infer if the selection of the spring or autumn migration routes resulted in stronger or weaker associations with each measure of ecological productivity. All analysis was conducted in R v. 3.0.2 [45]. GAMM was implemented using the gamm4 library, and the default optimization procedure was used to estimate the degree of smoothing [46].
3. Results
Species in the western flyway occurred at significantly higher elevations across the annual cycle relative to species in the eastern flyway (figure 2). For species in the western flyway, elevation increased substantially on average from the beginning of spring migration, peaking roughly in mid-August, and then declined rapidly during the end of autumn migration (figure 2).
Figure 2.
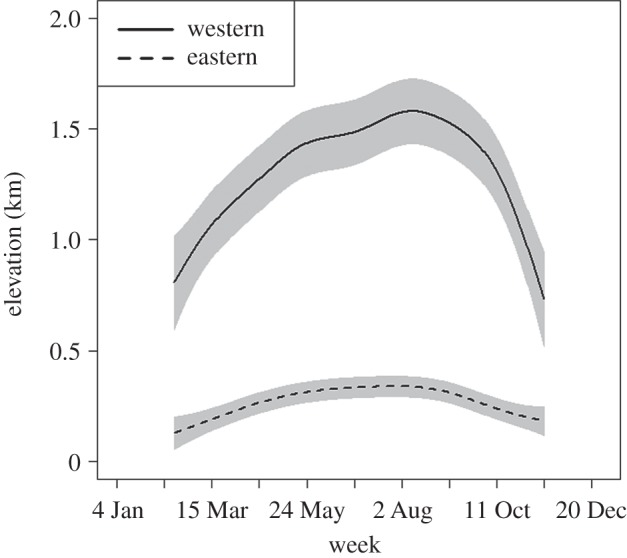
Weekly associations with elevation for species in the western (n = 26) and eastern flyways (n = 31) fitted with GAMMs with species as a random effect. Each fit includes 95% confidence bands.
Patterns observed with temperature were similar on average for species in the western (figure 3a) and eastern (figure 3b) flyways. At the beginning of spring migration, species' weekly occurrences were associated on average with regional maximum temperatures. This association diminished as spring migration progressed, with species occurring in the coolest parts of the study area during the breeding season. During autumn migration, species' distributions again were associated with maximum temperatures. There was little evidence for differences in average temperature between spring and autumn for birds in the western flyway (figure 3a), but birds in the eastern flyway did show limited evidence for associations with warmer temperatures in the autumn on average than would be expected if species used the spring routes exclusively (figure 3b).
Figure 3.

Observed associations and associations under three alternative migration scenarios (figure 1) with (a,b) temperature and (c,d) precipitation for species in the western (n = 26) and eastern (n = 31) flyways. The solid line with a 95% confidence band is the observed association fit using a GAMM with species as a random effect. The regional migration scenario estimates the range of possible associations available to each species, the spring migration scenario estimates associations had species used their spring migration route in the autumn and the autumn migration scenario estimates associations had species used their autumn migration route in the spring (see Material and methods for details on scenarios).
Species' observed weekly associations with precipitation differed markedly on average between the western (figure 3c) and eastern (figure 3d) flyways. Precipitation reached its lowest regional value in the western flyway during the summer and its highest regional value in the eastern flyway during spring and autumn (figure 3c,d). In the western flyway, bird distributions were most strongly associated on average with regions of higher precipitation during spring migration, with an association with lower precipitation on average at the end of autumn migration (figure 3c). There was marginal evidence that species' spring migration routes in the eastern flyway occurred on average in regions with greater precipitation (figure 3d).
The western flyway had lower average greenness than the eastern flyway, and the strength of species' associations with greenness differed markedly on average between the western and eastern flyways (figure 4a,b). In the western flyway, species were associated on average with intermediate regional greenness during spring and autumn migration, and bird distributions most closely matched areas of peak greenness at approximately the time of the summer peak in greenness (figure 4a). Birds moving north in spring in the western flyway were found in greener areas than if these birds had travelled north along their autumn routes (figure 4a). By contrast, had birds travelled both north and south following their spring migration routes, their autumn movements would have taken them through greener areas (figure 4a). In the eastern flyway and across the annual cycle, species were continually associated on average with areas of peak greenness, and this would not have changed had birds used their spring migration routes in autumn or autumn migration routes in spring (figure 4b).
Figure 4.

Observed associations and associations under three alternative migration scenarios (figure 1) with (a,b) greenness (enhanced vegetation index) and (c,d) NPP (net photosynthesis) for species in the western (n = 26) and eastern (n = 31) flyways. The solid line with a 95% confidence band is the observed association fit using a GAMM with species as a random effect. The regional migration scenario estimates the range of possible associations available to each species, the spring migration scenario estimates associations had species used their spring migration route in the autumn and the autumn migration scenario estimates associations had species used their autumn migration route in the spring (see Material and methods for details on scenarios).
Similar to greenness, the level of NPP was higher on average for the eastern flyway across the annual cycle (figure 4c,d). NPP differed from greenness in having two temporal peaks, which were more pronounced in the east (figure 4c,d). Observed associations with NPP also differed between the western and eastern flyway, but in a different fashion from that observed with greenness (figure 4c,d). In the western flyway, species were found in regions of peak NPP during the beginning of spring migration and the end of autumn migration (figure 4c). During the middle of the season, the association with NPP reached a peak that nearly matched the regional peak, although lagging slightly (figure 4c). By following different migration routes in the spring and autumn, northward-flying birds in the western flyway travelled through areas with the highest NPP in the spring and slightly lower NPP in the autumn (figure 4c). In the eastern flyway and across the annual cycle, species occupied areas of relatively high NPP (figure 4d), although this association was not as consistent as their tracking of greenness (figure 4b). As with birds in the western flyway, species in the eastern flyway were more closely associated with areas of high NPP at the beginning of spring migration than during autumn migration, with a lagged association with the annual peak in NPP (figure 4d). There was evidence that following their spring migration routes led to birds being associated with areas of higher NPP than if these species had followed their autumn route in both spring and autumn, and more limited evidence that autumn routes took these species to areas of lower NPP than if these species had retraced their spring route during autumn migration (figure 4d).
4. Discussion
In agreement with our expectations, our results support an ecological explanation for the observed seasonal shift in the location of the western flyway. Species in the western flyway tracked higher ecological productivity along latitude and elevation climate gradients during spring migration, and the seasonal shift in the location of the western flyway resulted in stronger associations with ecological productivity in the spring and weaker associations with ecological productivity in the autumn. Thus, the potentially longer migration journeys in the spring for species in the western flyway [2] allowed birds to occupy more productive environments on their way north to the breeding grounds, potentially supporting both migration success and breeding success. During autumn migration, a weaker association with ecological productivity was observed, suggesting that minimizing migration distance takes precedence over travelling through the most productive environments, even though birds clearly use seasonal productive environments during autumn migration such as higher elevation sites [47]. A related factor may be the generally unfavourable atmospheric conditions within the western flyway during autumn migration [2], which may place additional impetus on more direct migration journeys. Contrary to our expectations, the eastern flyway showed evidence for similar albeit weaker associations with ecological productivity during spring and autumn migration, indicating that not only atmospheric conditions [2] but also ecological productivity have played a role in creating the looped migration strategy. In total, our findings suggest looped migration strategies optimize fitness by enabling birds to arrive on the breeding grounds in good condition by following longer migration routes through more productive environments, and following more direct routes back to the wintering grounds through less productive environments.
Associations with temperature were similar in the eastern and western flyways, and our findings suggest breeding grounds for species in both flyways are located within the coolest areas of the eastern and western flyways. These patterns reflect the influence of regional climatic gradients in that breeding grounds for these migratory species are located at higher elevations and latitudes where temperatures are cooler (see figure 2; electronic supplementary material, figure S3). Our findings for spring and autumn migration also suggest that temperature is not a strong determinant of flyway location (i.e. spring and autumn migration routes do not appear to be selected for temperature).
We found no evidence that species within either flyway were tightly tracking areas of relatively high precipitation. Nevertheless, for the western flyway, birds tended to travel through areas experiencing higher levels of precipitation in the spring and, to a more limited degree, lower levels of precipitation in the autumn. The autumn association between bird distributions and precipitation appears to correspond with the North American monsoon in the southwestern USA [48,49], which occurs primarily west of the autumn concentration of migrants in the western flyway (see the electronic supplementary material, figure S3).
Similar to precipitation, the levels of association with greenness differed between the eastern and western flyways. The eastern flyway contained much higher levels of regional greenness, and species' distributions in the eastern flyway were strongly associated with the regional maximum greenness throughout the annual cycle. Unlike the west, where green vegetation is typically limited to riparian corridors or montane forests [10], the eastern deciduous forests provide broad and continuous tracks of green vegetation [9] (see the electronic supplementary material, figure S2). Our findings suggest that species maintained nearly consistent associations across the annual cycle with maximum regional greenness within these eastern forests. Thus, maximum regional greenness may be a reliable predictor of the location of eastern migratory species during migration and the breeding season. Although species in the western flyway did not maintain associations with maximum greenness, there were stronger associations in the spring and slightly weaker associations in the autumn, findings that follow our expectations in that species are selecting greener areas only during spring migration.
NPP peaked twice during the season, most obviously in the eastern flyway, a region where vegetation is not only greener but also, as our findings suggest, more productive. In the eastern flyway, the first mode corresponds with spring green-up and the second with an increase in precipitation during the late summer (figure 3d) in the southeastern USA [50,51]. In the western flyway, the first mode corresponds with spring green-up and the second much weaker mode corresponds with the North American monsoon [48,49]. For the western flyway, migrants presented similar associations with NPP and greenness, suggesting that both measures captured similar environmental associations across the annual cycle. However, unlike greenness, a closer association with maximum NPP occurred across the annual cycle, suggesting that NPP is a more reliable predictor of the location of western migratory species, especially during the breeding season. Both the eastern and western flyways showed a temporally disjointed association with the seasonal peak in NPP, an effect that was not observed with greenness. These findings for NPP suggest migrants travel though more productive regions in the spring to reach their breeding grounds. The more productive areas probably occur at lower latitudes and may be passed over due to the presence of abundant resident species [52,53].
One aspect of the life histories of many western species that may explain their selection of autumn migration routes is moult migration, wherein birds will migrate part of the way to their wintering grounds before moulting their flight feathers. Moult migration is more prevalent for species in the western flyway and is associated with latitudinal or elevational movements to regions where food resources are more abundant in the late summer [54,55]. For the western flyway, moult migration appears to be timed to coincide with the flush of productivity in the southwestern USA and northern Mexico that follows the North American monsoon [48,49] (see the electronic supplementary material, figure S2). This behaviour may explain the associations with higher elevations in the western flyway during autumn migration [47], but fails to explain the association with precipitation, greenness and NPP during this same period. These discrepancies may be due to the fact that not all species in the western flyway conduct moult migration, and some of the species that do so migrate outside of the study area before moulting.
In summary, we used a macroecological framework to test an explanation for the use of looped migration strategies by birds in two North American migration flyways. We extended the green-wave hypothesis (initially formulated to explain seasonal movements of herbivores) to include insectivores, species that may track, during spring migration, the emergence of insects that coincides with vegetation green-up. Our results agree with our expectations in that ecological productivity was associated with looped migration in the western flyway. These same associations were evident to a much lesser degree in the eastern flyway, which displayed an unexpected association with maximum regional greenness. These findings have important conservation implications for North American migratory systems [56]. In particular, our findings indicate populations of migratory birds in some regions display fine-tuned spatial synchronization with ecological productivity that results in seasonally distinct geographical patterns of movement, which could be disrupted when a changing climate induces a mismatch between food availability and needs [57]. These synchronizations occur across trophic levels among migratory birds, plants and insects, putting broader, inter-connected communities at risk [58–60].
Supplementary Material
Supplementary Material
Acknowledgements
We thank K. Webb for assistance with data acquisition, N. Bruns and A. Johnston for valuable discussions, U. Mellone and an anonymous reviewer for constructive comments, and the many eBird participants for their contributions.
Funding statement
This work was funded by the Leon Levy Foundation, Wolf Creek Foundation and the National Science Foundation (IIS-1125098 and IIS-1017793), with computing support from CNS-1059284, OCI-1053575 and DEB-110008.
References
- 1.Newton I. 2008. The migration ecology of birds. London, UK: Academic Press. [Google Scholar]
- 2.La Sorte FA, et al. 2014. The role of atmospheric conditions in the seasonal dynamics of North American migration flyways. J. Biogeogr. 41, 1685–1696. ( 10.1111/jbi.12328) [DOI] [Google Scholar]
- 3.La Sorte FA, Fink D, Hochachka WM, DeLong JP, Kelling S. 2013. Population-level scaling of avian migration speed with body size and migration distance for powered fliers. Ecology 94, 1839–1847. ( 10.1890/12-1768.1) [DOI] [PubMed] [Google Scholar]
- 4.Bonner WD. 1968. Climatology of the low level jet. Mon. Weather Rev. 96, 833–850. ( 10.1175/1520-0493(1968)096<0833:COTLLJ>2.0.CO;2) [DOI] [Google Scholar]
- 5.Mellone U, López-López P, Limiñana R, Piasevoli G, Urios V. 2013. The trans-equatorial loop migration system of Eleonora's falcon: differences in migration patterns between age classes, regions and seasons. J. Avian Biol. 44, 417–426. ( 10.1111/j.1600-048X.2013.00139.x) [DOI] [Google Scholar]
- 6.Klaassen RHG, Strandberg R, Hake M, Olofsson P, Tottrup AP, Alerstam T. 2010. Loop migration in adult marsh harriers Circus aeruginosus, as revealed by satellite telemetry. J. Avian Biol. 41, 200–207. ( 10.1111/j.1600-048X.2010.05058.x) [DOI] [Google Scholar]
- 7.Tøttrup AP, et al. 2012. The annual cycle of a trans-equatorial Eurasian–African passerine migrant: different spatio-temporal strategies for autumn and spring migration. Proc. R. Soc. B 279, 1008–1016. ( 10.1098/rspb.2011.1323) [DOI] [PMC free article] [PubMed] [Google Scholar]
- 8.NALCMS. 2005. North American land cover at 250 m spatial resolution. Sioux Falls, SD: United States Geological Survey (USGS; ). [Google Scholar]
- 9.Huete A, Didan K, Miura T, Rodriguez EP, Gao X, Ferreira LG. 2002. Overview of the radiometric and biophysical performance of the MODIS vegetation indices. Remote Sens. Environ. 83, 195–213. ( 10.1016/S0034-4257(02)00096-2) [DOI] [Google Scholar]
- 10.Dunn AH, de Beurs KM. 2011. Land surface phenology of North American mountain environments using moderate resolution imaging spectroradiometer data. Remote Sens. Environ. 115, 1220–1233. ( 10.1016/j.rse.2011.01.005) [DOI] [Google Scholar]
- 11.Hagan JM, Lloyd-Evans TL, Atwood JL. 1991. The relationship between latitude and the timing of spring migration of North American landbirds. Ornis Scand. 22, 129–136. ( 10.2307/3676543) [DOI] [Google Scholar]
- 12.Bauer S, Gienapp P, Madsen J. 2008. The relevance of environmental conditions for departure decision changes en route in migrating geese. Ecology 89, 1953–1960. ( 10.1890/07-1101.1) [DOI] [PubMed] [Google Scholar]
- 13.van Wijk RE, Kölzsch A, Kruckenberg H, Ebbinge BS, Müskens GJDM, Nolet BA. 2012. Individually tracked geese follow peaks of temperature acceleration during spring migration. Oikos 121, 655–664. ( 10.1111/j.1600-0706.2011.20083.x) [DOI] [Google Scholar]
- 14.Marra P, Francis C, Mulvihill R, Moore F. 2005. The influence of climate on the timing and rate of spring bird migration. Oecologia 142, 307–315. ( 10.1007/s00442-004-1725-x) [DOI] [PubMed] [Google Scholar]
- 15.Balbontín J, Møller AP, Hermosell IG, Marzal A, Reviriego M, De Lope F. 2009. Individual responses in spring arrival date to ecological conditions during winter and migration in a migratory bird. J. Anim. Ecol. 78, 981–989. ( 10.1111/j.1365-2656.2009.01573.x) [DOI] [PubMed] [Google Scholar]
- 16.Harrison XA, Blount JD, Inger R, Norris DR, Bearhop S. 2011. Carry-over effects as drivers of fitness differences in animals. J. Anim. Ecol. 80, 4–18. ( 10.1111/j.1365-2656.2010.01740.x) [DOI] [PubMed] [Google Scholar]
- 17.Norris DR. 2005. Carry-over effects and habitat quality in migratory populations. Oikos 109, 178–186. ( 10.1111/j.0030-1299.2005.13671.x) [DOI] [Google Scholar]
- 18.Norris DR, Marra PP. 2007. Seasonal interactions, habitat quality, and population dynamics in migratory birds. Condor 109, 535–547. ( 10.1650/8350.1) [DOI] [Google Scholar]
- 19.Gordo O, Sanz J. 2008. The relative importance of conditions in wintering and passage areas on spring arrival dates: the case of long-distance Iberian migrants. J. Ornithol. 149, 199–210. ( 10.1007/s10336-007-0260-z) [DOI] [Google Scholar]
- 20.Drent RH, Daan S. 1980. The prudent parent—energetic adjustments in avian breeding. Ardea 68, 225–252. [Google Scholar]
- 21.Jönsson KI. 1997. Capital and income breeding as alternative tactics of resource use in reproduction. Oikos 78, 57–66. ( 10.2307/3545800) [DOI] [Google Scholar]
- 22.Meijer T, Drent R. 1999. Re-examination of the capital and income dichotomy in breeding birds. Ibis 141, 399–414. ( 10.1111/j.1474-919X.1999.tb04409.x) [DOI] [Google Scholar]
- 23.Nilsson C, Klaassen RHG, Alerstam T. 2013. Differences in speed and duration of bird migration between spring and autumn. Am. Nat. 181, 837–845. ( 10.1086/670335) [DOI] [PubMed] [Google Scholar]
- 24.Drent RH, Ebbinge BS, Weijand B. 1978. Balancing the energy budgets of Arctic-breeding geese throughout the annual cycle: a progress report. Verh. Ornithologischen Ges. Bayern 23, 239–264. [Google Scholar]
- 25.Owen M. 1980. Wild geese of the world: their life history and ecology. London, UK: Batsford. [Google Scholar]
- 26.van der Graaf SAJ, Stahl J, Klimkowska A, Bakker JP, Drent RH. 2006. Surfing on a green wave: how plant growth drives spring migration in the Barnacle Goose Branta leucopsis. Ardea 94, 567–577. [Google Scholar]
- 27.Duriez O, Bauer S, Destin A, Madsen J, Nolet BA, Stillman RA, Klaassen M. 2009. What decision rules might pink-footed geese use to depart on migration? An individual-based model. Behav. Ecol. 20, 560–569. ( 10.1093/beheco/arp032) [DOI] [Google Scholar]
- 28.Bischof R, Loe LE, Meisingset EL, Zimmermann B, Moorter BV, Mysterud A. 2012. A migratory northern ungulate in the pursuit of spring: jumping or surfing the green wave? Am. Nat. 180, 407–424. ( 10.1086/667590) [DOI] [PubMed] [Google Scholar]
- 29.Sawyer H, Kauffman MJ. 2011. Stopover ecology of a migratory ungulate. J. Anim. Ecol. 80, 1078–1087. ( 10.1111/j.1365-2656.2011.01845.x) [DOI] [PubMed] [Google Scholar]
- 30.Wolda H. 1988. Insect seasonality: why? Annu. Rev. Ecol. Syst. 19, 1–18. ( 10.1146/annurev.es.19.110188.000245) [DOI] [Google Scholar]
- 31.Price PW. 1992. Plant resources as the mechanistic basis for insect herbivore population dynamics. In Effects of resource distribution on animal–plant interactions (eds Hunter MD, Ohgushi T, Price PW.), pp. 139–173. San Diego, CA: Academic Press. [Google Scholar]
- 32.Hunter AF, Lechowicz MJ. 1992. Foliage quality changes during canopy development of some northern hardwood trees. Oecologia 89, 316–323. ( 10.2307/4219889) [DOI] [PubMed] [Google Scholar]
- 33.Mattson WA, Scriber JM. 1987. Nutritional ecology of insect folivores of woody plants: nitrogen, water, fiber and mineral considerations. In Nutritional ecology of insects, mites, spiders and related invertebrates (eds Slansky F, Jr, Rodriguez JG.), pp. 105–146. New York, NY: John Wiley. [Google Scholar]
- 34.Martel J, Kause A. 2002. The phenological window of opportunity for early-season birch sawflies. Ecol. Entomol. 27, 302–307. ( 10.1046/j.1365-2311.2002.00418.x) [DOI] [Google Scholar]
- 35.Lawrence RK, Mattson WJ, Haack RA. 1997. White spruce and the spruce budworm: defining the phenological window of susceptibility. Can. Entomol. 129, 291–318. ( 10.4039/Ent129291-2) [DOI] [Google Scholar]
- 36.Fink D, et al. 2010. Spatiotemporal exploratory models for broad-scale survey data. Ecol. Appl. 20, 2131–2147. ( 10.1890/09-1340.1) [DOI] [PubMed] [Google Scholar]
- 37.Sullivan BL, et al. 2014. The eBird enterprise: an integrated approach to development and application of citizen science. Biol. Conserv. 169, 31–40. ( 10.1016/j.biocon.2013.11.003) [DOI] [Google Scholar]
- 38.Fry JA, Xian G, Jin S, Dewitz JA, Homer CG, Yang L, Barnes CA, Herold ND, Wickham JD. 2011. Completion of the 2006 national land cover database for the conterminous United States. Photogramm. Eng. Remote Sens. 77, 858–864. ( 10.1016/0034-4257(94)90018-3) [DOI] [Google Scholar]
- 39.Huete A, Justice C, Liu H. 1994. Development of vegetation and soil indexes for MODIS-EOS. Remote Sens. Environ. 49, 224–234. [Google Scholar]
- 40.Justice CO, et al. 1998. The moderate resolution imaging spectroradiometer (MODIS): land remote sensing for global change research. IEEE Trans. Geosci. Remote 36, 1228–1249. ( 10.1109/36.701075) [DOI] [Google Scholar]
- 41.Myneni RB, Hall FG, Sellers PJ, Marshak AL. 1995. The interpretation of spectral vegetation indexes. IEEE Trans. Geosci. Remote 33, 481–486. ( 10.1109/36.377948) [DOI] [Google Scholar]
- 42.Running SW, Nemani RN, Glassy JM, Thornton PE. 1999. MODIS daily photosynthesis (PSN) and annual net primary production (NPP) product. (MOD17). Algorithm theoretical basis document (ATBD) ver. 3. See http://modis.gsfc.nasa.gov. [Google Scholar]
- 43.Heinsch FA, et al. 2003. User's guide GPP and NPP (MOD17A2/A3) products NASA MODIS land algorithm, v. 2.0. See http://www.ntsg.umt.edu/project/mod17.
- 44.USGS. 1996. GTOPO30–global topographic data. Sioux Falls, SD: United States Geological Survey, EROS Data Center Distributed Active Archive Center (EDC DAAC). [Google Scholar]
- 45.R Development Core Team. 2014. R: a language and environment for statistical computing. Vienna, Austria: R Foundation for Statistical Computing; See http://www.R-project.org. [Google Scholar]
- 46.Wood SN, Scheipl F. 2014. gamm4: generalized additive mixed models using mgcv and lme4. R package v. 0.2–2. See http://CRAN.R-project.org/package=gamm4.
- 47.DeLong JP, Cox SW, Cox NS. 2005. A comparison of avian use of high- and low-elevation sites during autumn migration in central New Mexico. J. Field Ornithol. 76, 326–333. ( 10.1648/0273-8570-76.4.326) [DOI] [Google Scholar]
- 48.Carleton AM. 1987. Summer circulation climate of the American Southwest, 1945–1984. Ann. Assoc. Am. Geogr. 77, 619–634. ( 10.1111/j.1467-8306.1987.tb00184.x) [DOI] [Google Scholar]
- 49.Adams DK, Comrie AC. 1997. The North American monsoon. Br. Am. Meteorol. Soc. 78, 2197 ( 10.1175/1520-0477(1997)078<2197:TNAM>2.0.CO;2) [DOI] [Google Scholar]
- 50.Markham CG. 1970. Seasonality of precipitation in the United States. Ann. Assoc. Am. Geogr. 60, 593–597. ( 10.2307/2561678) [DOI] [Google Scholar]
- 51.Hsu C-PF, Wallace JM. 1976. The global distribution of the annual and semiannual cycles in precipitation. Mon. Weather Rev. 104, 1093–1101. ( 10.1175/1520-0493(1976)104<1093:tgdota>2.0.co;2) [DOI] [Google Scholar]
- 52.Cook RE. 1969. Variation in species density of North American birds. Syst. Zool. 18, 63–84. ( 10.2307/2412411) [DOI] [Google Scholar]
- 53.Rabenold KN. 1979. A reversed latitudinal diversity gradient in avian communities of eastern deciduous forests. Am. Nat. 114, 275–286. ( 10.2307/2460223) [DOI] [Google Scholar]
- 54.Leu M, Thompson CW. 2002. The potential importance of migratory stopover sites as flight feather molt staging areas: a review for neotropical migrants. Biol. Conserv. 106, 45–56. ( 10.1016/S0006-3207(01)00228-2) [DOI] [Google Scholar]
- 55.Rohwer S, Butler LK, Froehlich DR. 2005. Ecology and demography of east-west differences in molt scheduling of Neotropical migrant passerines. In Birds of two worlds: the ecology and evolution of migration (eds Greenberg R, Marra PP.), pp. 87–105. Baltimore, MD: Johns Hopkins University Press. [Google Scholar]
- 56.Faaborg J, et al. 2010. Conserving migratory land birds in the New World: do we know enough? Ecol. Appl. 20, 398–418. ( 10.1890/09-0397.1) [DOI] [PubMed] [Google Scholar]
- 57.Harrington R, Wolwod I, Sparks T. 1999. Climate change trophic interactions. Trends Ecol. Evol. 14, 146–150. ( 10.1016/S0169-5347(99)01604-3) [DOI] [PubMed] [Google Scholar]
- 58.Ovaskainen O, Skorokhodova S, Yakovleva M, Sukhov A, Kutenkov A, Kutenkova N, Shcherbakov A, Meyke E, Delgado MdM. 2013. Community-level phenological response to climate change. Proc. Natl Acad. Sci. USA 110, 13 434–13 439. ( 10.1073/pnas.1305533110) [DOI] [PMC free article] [PubMed] [Google Scholar]
- 59.Gordo O, Sanz J. 2005. Phenology and climate change: a long-term study in a Mediterranean locality. Oecologia 146, 484–495. ( 10.1007/s00442-005-0240-z) [DOI] [PubMed] [Google Scholar]
- 60.Thomas DW, Blondel J, Perret P, Lambrechts MM, Speakman JR. 2001. Energetic and fitness costs of mismatching resource supply and demand in seasonally breeding birds. Science 291, 2598–2600. ( 10.1126/science.1057487) [DOI] [PubMed] [Google Scholar]
Associated Data
This section collects any data citations, data availability statements, or supplementary materials included in this article.