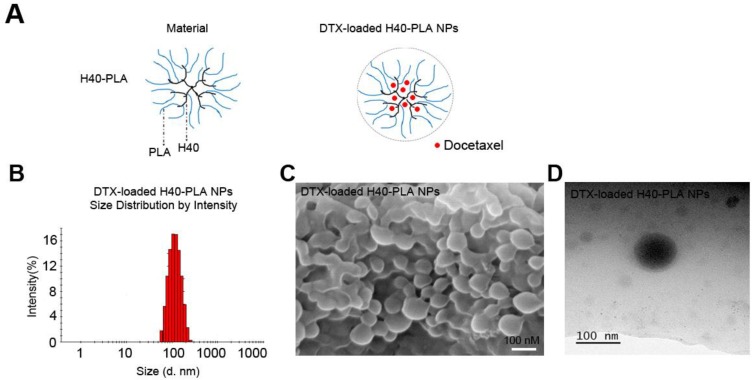
Figure 2.
Schema of preparation and characterization of the DTX-H40-PLA NPs. (A) Schematic representation of process for preparation of DTX-H40-PLA NPs. (B) DLS size distribution of DTX-H40-PLA NPs. (C) FESEM image of the DTX-H40-PLA NPs. Scale bars: 100 nm. (D) TEM image of the DTX-H40-PLA NPs. Scale bars: 100 nm.

