Summary
Background
The aim of this study was to determine 31PMRS reference spectrum and intracellular pH of calf muscles in the dominant limb of healthy, young, male volunteers before and after intense physical effort.
Material/Methods
Examinations were performed with a 1.5 T MR system. FID CSI (Free Induction Decay Chemical Shift Imaging) sequence was used with the following parameters: TR=4000 ms, FA=90°, NEX=2 and VOI (Volume Of Interest)=8×8×8 cm3 (512 cm3) involving in calf muscles. Raw data was preprocessed using SAGE (GE) software. Authors analyzed relative concentrations ratios of selected metabolites: PCr/ATP and PCr/Pi. Intracellular pH and relative concentrations ratios of each metabolite (Pi, PCr, α-ATP, β-ATP, γ-ATP, ATP) were also calculated relative to the sum of concentrations of all metabolites. Results were compared with a t-test.
Results
Based on statistical analysis of results significant differences (p<0.05) were demonstrated for some of the studied metabolites and for intracellular pH. Increase in PCr concentration in relation to the sum of concentrations of all metabolites and to ATP concentration was noted. However, β-ATP, α-ATP and ATP concentrations relative to the sum of concentrations of all metabolites become reduced. Decrease in pH after physical effort was demonstrated. There were no significant differences (p<0.05) in concentrations of remaining metabolites before and after exercise. Increase in PCr concentration relative to Pi concentration and decrease of Pi and γ-ATP concentration relative to the sum of concentrations of all metabolites were demonstrated.
Conclusions
The 31PMRS method enables assessment of concentrations of phosphorus-containing metabolites as well as intercellular pH before and after exercise. This method is still under examination, but it has already shown promise as a diagnostic tool for the future.
MeSH Keywords: Magnetic Resonance Spectroscopy, Muscle Stretching Exercises, Physical Exertion
Background
Magnetic Resonance Spectroscopy (MRS) is a noninvasive method enabling in vivo examination of cellular metabolic content and its changes undergoing under the influence of external factors or in the course of a disease. Nuclei of the same molecule (e.g. hydrogen) contained in various substances emit electromagnetic radiation of somewhat different frequencies. It is related to different arrangement of chemical bindings within those substances. The result of spectroscopic examination is presented in a form of spectral lines (so-called peaks) constituting a spectrum [1,2], in which each substance (metabolite) produces an individual peak. Location of peaks in MR (Magnetic Resonance) spectrum is determined by chemical shift expressed as parts-per-million (ppm). Therefore, spectra are specific for given tissues and organs containing different metabolic components.
Skeletal muscle magnetic resonance spectroscopy is used to investigate the following: 1) muscle energetics (31PMRS phosphorous spectroscopy), 2) glucose and glycogen metabolism (13CMRS carbon spectroscopy) and 3) lipids (1HMRS proton spectroscopy) [3,4]. Proton spectroscopy is the most popular method successfully used in clinical practice. Analogous to magnetic resonance method it utilizes hydrogen nuclei, one of the most prevalent elements in organic compounds [5]. The 31PMRS method is similar to proton spectroscopy however, it detects signal from phosphorus-containing metabolites, which play an important role in muscles’ energy metabolism [6]. This method is characterized by lesser sensitivity compared to proton spectroscopy due to smaller phosphorus content than hydrogen content in the human body.
Phosphorus spectroscopy spectrum of skeletal muscle contains the following peaks:
Inorganic phosphates (Pi, 4.97 ppm),
Phosphodiesters (PDE, 3.19 ppm),
Phosphocreatine (PCr, 0 ppm),
gamma-adenosine triphosphate (γ-ATP, −2.16 ppm and −2.76 ppm),
alpha-adenosine triphosphate (α-ATP, −7.38 ppm and −7.89 ppm),
beta-adenosine triphosphate (β-ATP, −16.29 ppm and −16.88 ppm).
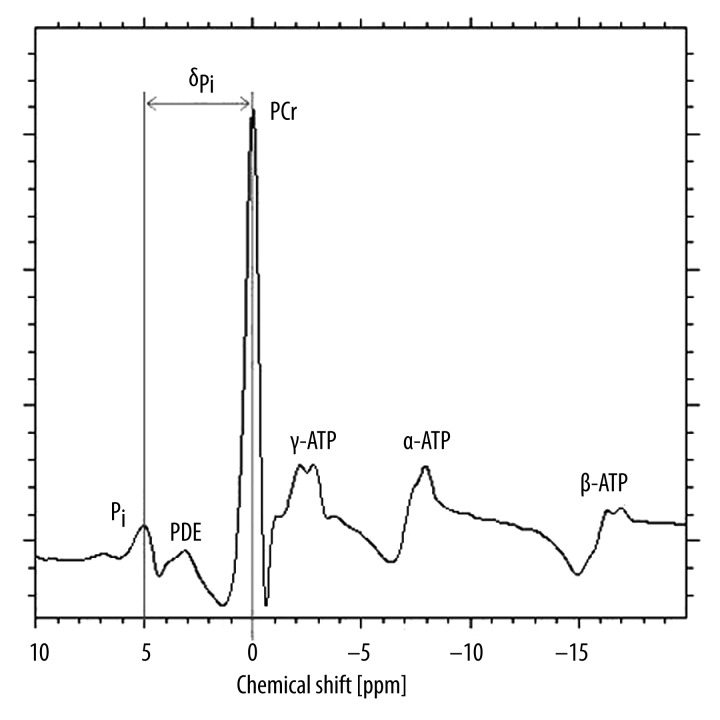
PCr constitutes a source of energy in the initial phase of exercise due to the presence of high-energy bonds. PDE’s include glycerophosphocholine (GPC) and glycerolphosphoethanolamine (GPE) responsible for destruction of cellular membrane. Pi, on the other hand, is necessary for the process of ATP synthesis. ATP contains three phosphorous groups (alpha – α, beta – β, gamma – γ), each one represented in the spectrum by two peaks. Thus, ATP forms 6 of 9 main phosphorus peaks within 31PMRS spectrum (Figure 1). Areas under individual peaks may be used to calculate concentrations. For in vivo 31PMRS PCr was assumed as a reference point, localizing the peak of its spectrum at 0 ppm. It is important because based on the location of PCr and Pi peaks we may calculate intracellular pH.
Figure 1.
31PMRS spectrum from calf muscle – own material.
Goal of the study
The aim of this study was to determine the reference 31PMRS spectrum as well as intracellular pH for calf muscles of the dominant leg in healthy, physically active volunteers before and after intense physical effort. The project gained acceptance of Jagiellonian University Collegium Medicum Bioethical Committee.
Material and Methods
Study included 30 healthy volunteers: nonsmoking men aged 18–35 years (average age was 25 years), who did not take any medication. Volunteers declared moderate everyday physical activity. Average body mass was 79 kg (between 55 kg and 98 kg). Twenty-three volunteers declared the right lower leg to be the dominant limb and 7 subjects pointed to the left leg.
Examination consisted of three parts:
MR spectroscopy examination of dominant lower limb muscles at rest (duration of this part of examination was about 10 minutes).
Physical exercise – intense training of calf muscles in a form of repeated, alternated lifting on the front part of the foot and returning to the starting position (putting weight on the entire surface of the foot). Duration of exercise was predetermined and lasted 10 minutes. After this time of exercise all volunteers reported fatigue of calf muscles.
MR spectroscopy of muscles of selected lower limb immediately after intense exercise (duration of this part of examination was about 10 minutes).
Entire procedure consisting of 3 parts lasted about 30 minutes. During spectroscopy performed after exercise the examined limb was placed within the coil in a manner analogous to the examination before exercise in order to enable determination of metabolite concentrations within the same calf volume (within the same VOI – Volume of Interest). Thanks to that it was possible to analyze acquired results with respect to metabolite changes taking place as a result of physical exercise.
Study was performed using a 1.5T magnetic resonance device (Signa HD xt 1.5T, GE). Study procedure began with performing a localizer scan using a BODY coil visualizing calf muscles. Imaging was performed in a transverse plane in T2-weighted sequences. Spectroscopic examination was planned based on the acquired images. In all examined volunteers (both before and after exercise) VOI was defined as a cubical area 8×8×8 cm (512 cm3) dimensions, encompassing shank muscles. A FID CSI (Free Induction Decay Chemical Shift Imaging) sequence with the following parameters: TR=4000 ms, FA=90°, NEX=2, was performed. Spectroscopy spectra before and after exercise were obtained.
Raw data was processed using SAGE (GE) software. Relative proportions of concentrations of selected metabolites: PCr/ATP, PCr/Pi, were analyzed. Moreover, concentration ratios of selected metabolites to the sum of all metabolites visible in the spectrum, were calculated [7,8].
Based on the differences in chemical shift of Pi peak relative to PCr peak, we determined pH according to the following formula:
| (1) |
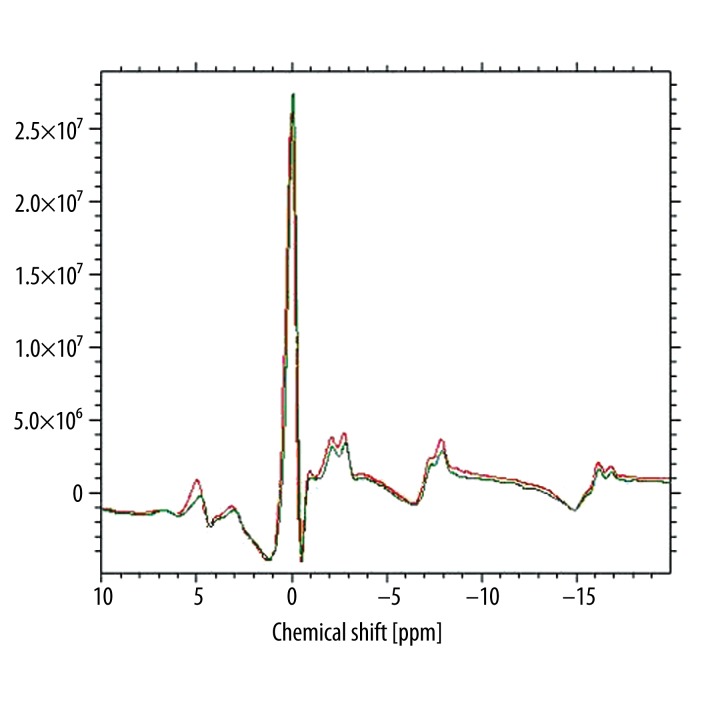
where δPi is the difference between chemical shifts of Pi and PCr [9]. We calculated pH before and after physical exercise (Figure 2).
Figure 2.
Comparison of calf muscle 31PMRS spectra before (red line) and after (green line) exercise. The Pi peak in the spectrum obtained after exercise is shifted to smaller values of chemical shift – own material.
Mean values (arithmetic means) and standard deviations for metabolite concentration ratios and pH were calculated. Changes occurring within the calf due to physical exercises were verified using Student’s t-test for dependent variables, as comparisons were performed for results acquired on the same group of subjects (volunteers) examined two times: before and after exercise.
Results
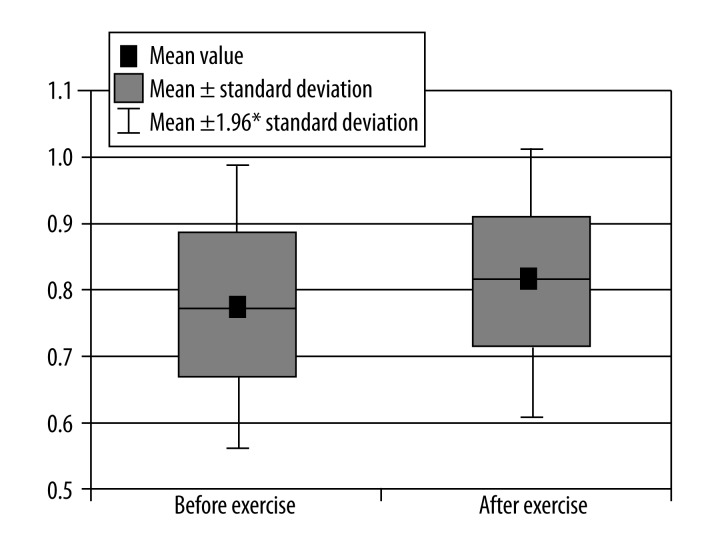
Statistical analysis for ratios of metabolite concentrations was performed. It was assumed that results might be considered statistically significant for a level of p<0.05. Acquired results together with significance levels and change trends are summarized in Tables 1 and 2. Figures 3–5 present a comparison of individual results before and after exercise. The following changes were found based on the analysis of 31PMRS examinations performed before and after physical exercise:
Table 1.
Relative concentration ratios of each metabolite calculated for the total amount of concentrations of all metabolites in the calf muscle before and after exercise and their trends (* p<0.05).
| Metabolite/sum | Mean | P | Change | |
|---|---|---|---|---|
| Before exercise | After exercise | |||
| Pi | 0.009828881 | 0.007882974 | 0.0836100 | ↓ |
| PCr | 0.768589496 | 0.818397165 | 0.0191391 | ↑* |
| γ-ATP | 0.107901342 | 0.08774257 | 0.1107195 | ↓ |
| α-ATP | 0.083452695 | 0.059432731 | 0.0263981 | ↓* |
| β-ATP | 0.030227587 | 0.02654456 | 0.0489153 | ↓* |
| ATP | 0.221581624 | 0.173719861 | 0.0262287 | ↓* |
Table 2.
Relative concentration ratios of metabolites and values of pH in calf muscle before and after exercise together with their trends (* p<0.05).
| Mean | p | Change | ||
|---|---|---|---|---|
| Before exercise | After exercise | |||
| PCr/ATP | 5.269036368 | 6.945036623 | 0.0472469 | ↑ |
| PCr/Pi | 114.5338048 | 138.8973652 | 0.1839834 | ↑ |
| pH | 7.14157684 | 7.108548177 | 0.0069633 | ↓* |
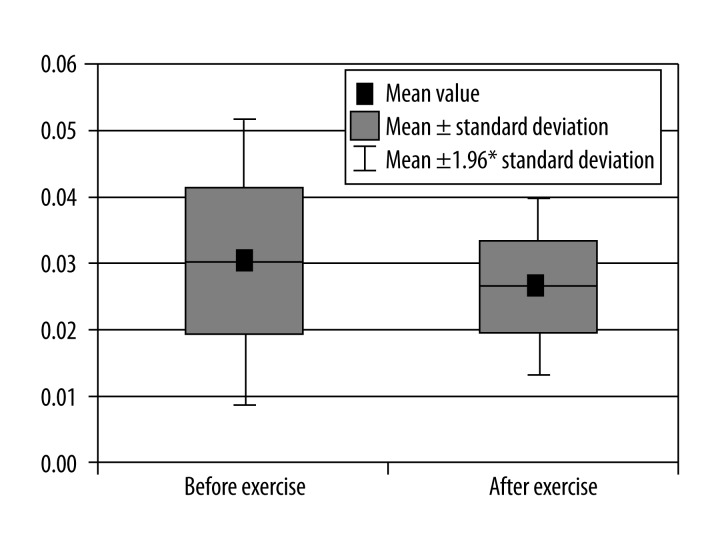
Figure 3.
Comparison of β-ATP concentrations relative to the sum of concentrations of all metabolites in calf muscle before and after exercise.
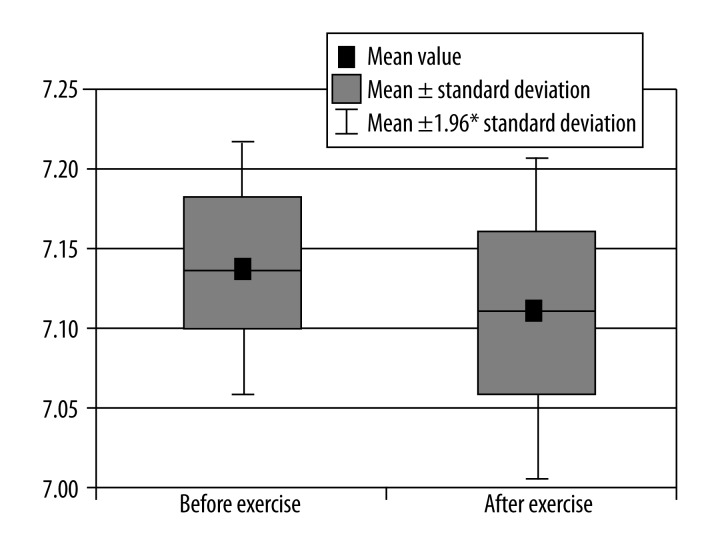
Figure 5.
Comparison of pH in calf muscle before and after exercise.
-
Increase in concentration after exercise for the following metabolites:
PCr – calculated relative to the sum of concentrations of all metabolites (p<0.05) (Figure 3),
PCr – calculated relative to ATP concentration ATP (p<0.05),
PCr – calculated relative to Pi concentration,
-
Reduction in concentration after exercise for the following metabolites:
β-ATP – calculated relative to the sum of concentrations of all metabolites (p<0.05) (Figure 4),
α-ATP, ATP – calculated relative to the sum of concentrations of all metabolites (p<0.05),
Pi, γ-ATP – calculated relative to the sum of concentrations of all metabolites,
Decrease in pH (Figure 5).
Figure 4.
Comparison of PCr concentrations relative to the sum of concentrations of all metabolites in calf muscle before and after exercise.
Due to the fact that it was not possible to identify a PDE peak and determine concentration for each metabolite, it was also impossible to conduct reliable statistical analysis in that regard. In 13 volunteers only this peak was visible within the spectrum both before and after exercise. It was therefore concluded that the number of measurements is not sufficient to perform analysis and extrapolate reliable statistical conclusions.
Discussion
As a result of physical exercise calf muscle pH decreases due to acidification of working muscles [10]. It is related to the reaction involving consumption of ATP and water, leading to formation of ADP, Pi and hydrogen ions (H+) [11,12], as well as production of lactic acid. Produced protons are buffered by phosphate residues in the process of ATP resynthesis. However, due to the fact that they are not only utilized for ATP resynthesis, but also in the mitochondrial respiratory chain, there is a shortage of phosphates relative to hydrogen ions. As a result, unbuffered H+ ions cause a fall in pH.
| (2) |
Muscle acidification inhibits utilization of energy substrates, which is why volunteers experienced fatigue and pain after intense calf muscle exercise. Obtained results regarding exertional pH reduction corroborate the results of studies by E. Lund et al. [7].
During exercise reserves of adenosine triphosphate (ATP) become depleted in the course of above-mentioned reaction (1). Due to the fact that ATP is an immediate source of energy necessary for skeletal muscle contraction, it needs to be continuously re-synthesized [13]. Based on mean results obtained in individual volunteers we demonstrated a slight reduction in ATP concentration relative to the sum of concentrations of all metabolites, as shown by the E. Lund team [7]. However, B.R. Newcomer and M.D. Boska [14] demonstrated that muscle ATP level remains unchanged during exercise. Therefore, changes in ATP concentrations among individual volunteers should be analyzed. In our study reduction in ATP concentration was identified in 16 studied volunteers. Quistorff [11] demonstrated that the rate of muscle recovery (rate of ATP synthesis) depends on the degree of muscle fitness. Our group of volunteers was not selected in that regard. As a consequence, we observed a disparity of results.
At maximal exertion ATP resynthesis involves PCr in the course of creatinine kinase reaction (CPK) [15]:
| (3) |
Therefore, PCr concentration in the muscle decreases during exercise and rate of its restoration is a measure of oxidative metabolism taking place in muscle mitochondria. It is first visible as a decrease and subsequently an increase in PCr peak signal [11]. In accordance with the results of Newcomer B.R. team [14] PCr reaches minimal level immediately after the exercise, while during the following 130 seconds it rises to levels exceeding initial values. In this study 31PMRS measurement was preceded by a localizer scan. Thus, it was performed no earlier than after 120 seconds after the end of exercise, which is why we observed a rise in PCr concentrations. Initial decrease in PCr concentration is also related to increase in Pi concentration [11].
| (4) |
After reaching maximal values at the end of physical exercise phosphate (Pi) level decreases, as together with ADP it is directly involved in a glycolytic pathway, leading to ATP resynthesis.
Conclusions
The 31PMRS technique allows for determining concentrations of phosphorus-containing metabolites as well as intracellular pH within a defined muscle volume. Analysis of obtained results revealed significant changes in concentrations of the following metabolites: PCr, α-ATP, β-ATP, ATP relative to the sum of concentrations of all metabolites, as well as exercise-induced PCr/ATP ratio relative to pre-exercise values. Statistically significant reduction in pH was also demonstrated.
References
- 1.Salibi N, Brown M. Clinical MR spectroscopy First principles. Wiley-Liss; Canada: 1998. [Google Scholar]
- 2.Torriani M. Measuring muscle lipids with 1H-MR spectroscopy. Skeletal Radiol. 2007;36:607–8. doi: 10.1007/s00256-006-0252-8. [DOI] [PubMed] [Google Scholar]
- 3.Green SM, Bülow J. Phosphorus 31 nuclear magnetic resonance spectroscopy suuggests a mitochondrial defect in claudicating skeletal muscle. J Vasc Surgery. 2000;31:944–52. doi: 10.1067/mva.2000.106421. [DOI] [PubMed] [Google Scholar]
- 4.Bosch C. Musculoskeletal Spectroscopy. J Magn Reson Im. 2007;25:321–38. doi: 10.1002/jmri.20806. [DOI] [PubMed] [Google Scholar]
- 5.Sobiecka B, Urbanik A. The role of choline (Cho) in the diagnostics and the differentation of brain tumours with HMRS technique. Pol J Radiol. 2009;74(4):7–21. [Google Scholar]
- 6.de Graaf RA. In vivo NMR spectroscopy Principles and techniques. John Wiley; Chichester: 2008. [Google Scholar]
- 7.Lund E, Kendall SA, Janerot-Sjoberg B, et al. Muscle metabolism in fibromyalgia studied by P-31 magnetic resonance spectroscopy duting aerobic and anaerobic exercise. Scand J Rheumatol. 2003;32:138–45. doi: 10.1080/03009740310002461. [DOI] [PubMed] [Google Scholar]
- 8.Sprott H, Rzanny R, Reichenbach JR, et al. 31P resonance spectroscopy fibromyalgic muscle. Rheumatology. 2000;39:1121–25. doi: 10.1093/rheumatology/39.10.1121. [DOI] [PubMed] [Google Scholar]
- 9.Lodi R, Taylor DJ, Tabrizi SJ, et al. Normal in vivo skeletal muscle oxidative metabolism in sporadic inclusion body myositis assessed by 31P MRS. Brain. 1998;121:2119–26. doi: 10.1093/brain/121.11.2119. [DOI] [PubMed] [Google Scholar]
- 10.Layec G, Bringard A, Le Fur Y, et al. Reproducibility Assessment of Metabolic Variables Characterizing Muscle Energetics In Vivo: A 31P-MRS Study. Magn Reson Med. 2009;62:840–54. doi: 10.1002/mrm.22085. [DOI] [PubMed] [Google Scholar]
- 11.Quistorff B. Some quantitative aspects of 31P magnetic resonance spectroscopy in vivo in an exercise physiology context. 2nd WSEAS International Conference on Biomedical Electronics and Biomedical Informatics; Moskwa. 2009. [Google Scholar]
- 12.Tonson A, Ratel S, Le Fur Y, et al. Muscle energetics changes throughout maturation: a quantitative 31P-MRS analysis, Journal of applied physiology. J Appl Physiol. 2010;109:1769–78. doi: 10.1152/japplphysiol.01423.2009. [DOI] [PMC free article] [PubMed] [Google Scholar]
- 13.Karcz P, Urbanik A. Spektroskopia protonowa mięśni podudzia przed i po wysiłku fizycznym. Przegląd Lekarski. 2013;70(5):286–92. [in Polish] [PubMed] [Google Scholar]
- 14.Newcomer BR, Boska MD. T1 measurements of 31P metabolitem in resting and exercising human gastrocnemius/soleus muscle at 1.5 Tesla. Magn Reson Med. 1999;41:486–94. doi: 10.1002/(sici)1522-2594(199903)41:3<486::aid-mrm10>3.0.co;2-#. [DOI] [PubMed] [Google Scholar]
- 15.Wu JS, Buettner C, Smithline H, et al. Evaluation of skeletal muscle during calf exercise by 31-phosphorus magnetic resonance spectroscopy in patients on statin medications. Muscle Nerve. 2011;43:76–81. doi: 10.1002/mus.21847. [DOI] [PMC free article] [PubMed] [Google Scholar]


