

Abstract
Study Objectives:
Upper airway anatomy plays a major role in obstructive sleep apnea (OSA) pathogenesis. An inferiorly displaced hyoid as measured by the mandibular plane to hyoid distance (MPH) has been consistently associated with OSA. The hyoid is also a common landmark for pharyngeal length, upper airway volume, and tongue base. Tongue dimensions, pharyngeal length, and obesity are associated with OSA severity, although the link between these anatomical variables and pharyngeal collapsibility is less well known. We hypothesized that obesity as measured by body mass index (BMI), neck and waist circumferences, and variables associated with hyoid position (pharyngeal length, upper airway volume, and tongue dimensions) would be associated with passive pharyngeal critical closing pressure (Pcrit).
Design:
Cross-sectional.
Setting:
Academic hospital.
Patients:
34 Japanese-Brazilian males age 21 to 70 y.
Interventions:
N/A.
Measurements and Results:
We performed computed tomography scans of the upper airway, overnight polysomnography, and Pcrit measurements in all subjects. On average, subjects were overweight (BMI = 28 ± 4 kg/m2) and OSA was moderately severe (apnea-hypopnea index = 29 [13–51], range 1–90 events/h). Factor analysis identified two factors among the studied variables: obesity (extracted from BMI, neck and waist circumferences) and hyoid position (MPH, pharyngeal length, tongue length, tongue volume, and upper airway volume). Both obesity and hyoid position correlated with Pcrit (r = 0.470 and 0.630, respectively) (P < 0.01). In addition, tongue volume, tongue length, pharyngeal length, and MPH correlated with waist and neck circumferences (P < 0.05).
Conclusions:
Pharyngeal critical closing pressure is associated with obesity and hyoid position. Tongue dimensions, pharyngeal length, and the mandibular plane to hyoid distance are associated with obesity variables. These findings provide novel insight into the potential factors mediating upper airway collapse in obstructive sleep apnea.
Citation:
Genta PR, Schorr F, Eckert DJ, Gebrim E, Kayamori F, Moriya HT, Malhotra A, Lorenzi-Filho G. Upper airway collapsibility is associated with obesity and hyoid position. SLEEP 2014;37(10):1673-1678.
Keywords: computed tomography, lung, obstructive sleep apnea, pathophysiology, pharynx
INTRODUCTION
Obstructive sleep apnea (OSA) is a common disorder characterized by recurrent obstruction of the pharynx during sleep.1,2 Upper airway anatomy plays a central role in OSA pathogenesis. An inferiorly displaced hyoid as measured by the mandibular plane to hyoid distance (MPH) is one of the most consistent anatomical features reported to be associated with OSA.3–5 The tongue is the largest structure of the anterior pharyngeal wall and rests over the hyoid. Although anterior activation of the tongue can play a major role in maintaining upper airway patency,6 increased tongue dimensions are associated with increased risk of OSA and severity as expressed by the apneahypopnea index (AHI).7 Pharyngeal length (PL) is defined as the distance from the posterior nasal spine to the epiglottis base, which is attached to the hyoid.8 PL has also been consistently associated with pharyngeal collapsibility and the AHI.9–11
Pharyngeal airway dimensions are the result of the interaction between bony and soft tissues. Obesity, a major risk factor for OSA, may lead to enlargement of upper airway soft tissues and particularly the tongue.12,13 The tongue may enlarge anteroposteriorly and decrease upper airway diameter because of the fixed bony structure. However, the tongue can also expand caudally and may lead to an increase in pharyngeal length and MPH through displacement of the hyoid.4,14,15
OSA severity as assessed by the AHI may be influenced by factors other than anatomy, such as respiratory control instability, variations in arousal threshold, and poor upper airway dilator muscle responsiveness during sleep.16 To determine the overall functional anatomical contribution to OSA, upper airway collapsibility can be measured using the passive critical closing pressure (Pcrit) technique.1,17–19
In the current study we hypothesized that obesity as measured by body mass index (BMI), neck and waist circumferences, and variables associated with hyoid position (pharyngeal length, upper airway volume, and tongue dimensions) would be associated with Pcrit. To test this hypothesis, we performed computed tomography (CT) scans of the upper airway to provide three-dimensional reconstructions of the tongue and upper airway and measured Pcrit in male subjects with a wide range of upper airway collapsibility.
METHODS
Subjects
All subjects were male Japanese-Brazilians recruited from an ongoing study examining the mechanisms of OSA among Asians and Caucasians. Patients with OSA and controls were recruited from the sleep outpatient clinic and from the community to include subjects with a wide range of upper airway collapsibility. The current study was limited to Japanese-Brazilian adult males age 21–70 y to control for the possible confounding influences of race and sex on upper airway anatomy and soft-tissue structures. All subjects gave informed written consent before study entry, which was approved by the Hospital das Clínicas Ethics Committee. Initially, a detailed clinical evaluation that included height, weight, and waist and neck circumference was performed in each study participant.
Polysomnography
All participants underwent baseline standard overnight polysomnography (PSG) (Alice 5, Philips Respironics, Murrysville, PA) at the start of the study to determine sleep characteristics and quantify apnea severity. Monitoring included electroencephalography, electrooculography, electromyography (EMG), oximetry, measurements of airflow (oronasal thermistor and pressure cannula), and measurements of ribcage and abdominal movements during breathing, as previously described.17 Apnea was defined as complete cessation of airflow (thermistor) for at least 10 sec. Hypopnea was defined as a > 50% reduction in airflow (nasal pressure) for at least 10 sec associated with oxygen desaturation of 3% or cortical arousal. The AHI was calculated as the total number of respiratory events (apneas plus hypopneas) per hour of sleep. OSA was defined as an AHI > 15 events/h.
Upper Airway Collapsibility Determination
Sleep Induction
Sleep induction for Pcrit determination was performed in the sleep laboratory, starting at 08:00 following the diagnostic PSG, as previously described.17 A peripheral vein was cannulated and maintained with a continuous infusion of saline solution. Midazolam (diluted in a saline solution with a concentration of 1 mg/10 mL) was infused slowly when necessary, as follows: sleep induction started with the infusion of 5 mL of the solution over 5 min, which was repeated as needed, until a sleeplike state was detected through online PSG monitoring. Midazolam infusion was restarted for sleep maintenance only if the patient awoke and was not able to fall asleep again for 10 min.
Passive Critical Closing Pressure Technique
During Pcrit determinations, all polysomnographic channels used in the diagnostic PSG were recorded except for nasal pressure and thermistor. Pcrit measurements were performed with patients in the supine position. Subjects were fitted with a nasal mask, attached to a heated pneumotachograph (3700A, Hans Rudolf, Kansas City, MO) and a differential pressure transducer (MP45-14-871, Validyne, Northbridge, CA) for measurement of airflow. Mask pressure was measured by another pressure transducer (MP45-30-871, Validyne). Respiratory signals (airflow and mask pressure) were recorded on a personal computer using an analog-to-digital converter (PCI-6014, National Instruments, Austin, TX) and custom-designed data acquisition software (LabVIEW, National Instruments). A modified continuous positive airway pressure (CPAP) device (Philips Respironics, Murrysville, PA) that could deliver both positive and negative airway pressure was connected to the mask. After sleep onset, airway pressure was increased to abolish airflow limitation. This level was used as the holding pressure for each patient. After stable stage 2 (N2) or 3 (N3) sleep was observed at the holding pressure, CPAP was abruptly reduced by 1–2 cm H2O during expiration and was held at this level for five breaths. The pressure was then returned to the holding pressure for 1 min before being reduced an additional 1–2 cm H2O for another five breaths. This process of progressively reducing CPAP continued until obstructive apnea occurred. If arousal occurred during any pressure decrease, the CPAP was returned to the holding level until stable sleep resumed. The entire procedure of progressively reducing CPAP until obstruction was repeated three to five times in each subject. Data were analyzed using custom-designed software (Matlab, The MathWorks, Inc., Natick, MA) to determine the peak inspiratory flow (ViMax) for breaths three to five during the pressure drop. Each of these breaths was assessed for the presence or absence of inspiratory flow limitation.17 Breaths associated with arousal were excluded from the analysis. Nasal pressure for flow-limited breaths was plotted against Vimax. Pcrit was determined as the zero-flow intercept from the linear regression of Vimax versus nasal pressure as previously described.17,20
Computed Tomography
All patients underwent a CT scan of the upper airway (Discovery CT 750 HD, GE HealthCare, Milwaukee, WI). Image acquisition was performed during quiet tidal breathing with subjects awake and supine, with the head in the neutral position. The scans were acquired at 2.5 mm collimation/interval and reconstructed at 0.625/0.625 mm thickness/interval, with 120 kV, 100mA, and a rotation time of 0.8 sec. Axial and sagittal image reconstructions were performed to allow linear measurements using an Advantage Workstation, version 4.5 (GE Healthcare).
We identified the following landmarks at the midline sagittal reconstruction: posterior nasal spine, hyoid, mandibular plane, and epiglottis base. Mandibular plane to hyoid distance (MPH) was then determined. Tongue length was measured from the incisors to the hyoid. Tongue height was defined as the maximum height perpendicular to tongue length. Pharyngeal length was defined by measuring the distance of horizontal lines passing at the level of the hard palate and the base of the epiglottis. Three-dimensional reconstructions were made for tongue and upper airway volume measurements. Tongue volume determination was performed by a single investigator by tracing the contours on axial plane using the paintbrush method. Airway volume was determined by segmentation technique based on a fixed threshold characteristic of air (Figure 1).
Figure 1.

(A) CT scan from a representative subject with minimal sleep disordered breathing (AHI = 12 events/h, Pcrit = -3.1 cm H2O, BMI = 27 kg/m2). (B) CT scan from a subject with severe OSA (AHI = 32 events/h, Pcrit = 0.2 cm H2O, BMI = 29 kg/m2). In B, there is a marked difference in the position of the hyoid bone and displacement of the base of the tongue below the mandibular plane in the severe OSA subject. Also note the associated differences in tongue volume, pharyngeal length, tongue length, and Pcrit. AHI, apnea-hypopnea index; Ep, epiglottis base; H, hyoid; MP, mandibular plane (dashed line); MPH, mandibular plane to hyoid distance; OSA, obstructive sleep apnea; Pcrit, pharyngeal critical closing pressure; PL, pharyngeal length; PNS, posterior nasal spine; TH, tongue height; TL, tongue length; TV, tongue volume.
Statistical Analysis
Continuous variables are reported as mean ± standard deviation or median [interquartile range]. Normal distribution was tested using the Shapiro-Wilk test. Continuous variables were compared according to the median value of Pcrit using non-paired Student t-test or Mann-Whitney U test.
Correlation analysis (Pearson or Spearman as indicated) was used to test for associations between variables. Because some of the variables in the current study might share common characteristics, exploratory factor analysis was used to group variables into distinct domains. BMI, neck circumference, waist circumference, MPH, airway length, airway volume, tongue length, tongue volume, tongue height, age, AHI, and Pcrit were entered in the analysis. Loadings from the factor pattern matrix were used to allocate items to factors. For instance, MPH, tongue length, and pharyngeal length may reflect hyoid position; BMI and neck and waist circumference may reflect obesity. Oblique rotation technique was used. Items were then categorized according to factor loadings into separate factors. The number of factors retained was based on the analysis of the scree plot. Factor scores were calculated for each subject, representing the subject's placement on that factor.
RESULTS
We studied 34 Japanese-Brazilian males, age 48 ± 14 y with BMI of 28 ± 4 kg/m2. The AHI ranged from 1 to 90 events/h, and 11 patients did not have OSA. Among those with OSA, 16 had an AHI ≥ 30 events/h (Table 1). A small dose of midazolam (median = 2.8 mg) was necessary to induce sleep as measured via electroencephalography. The distribution of Pcrit was (median [interquartile range]): -1.52 [-3.12 to 0.23] cm H2O, ranging from -14.8 to 4.5 cm H2O. Patients with higher Pcrit had more severe OSA, increased pharyngeal length, tongue length, and MPH.
Table 1.
Anthropometric and upper airway characteristics according to the median of pharyngeal critical closing pressure.
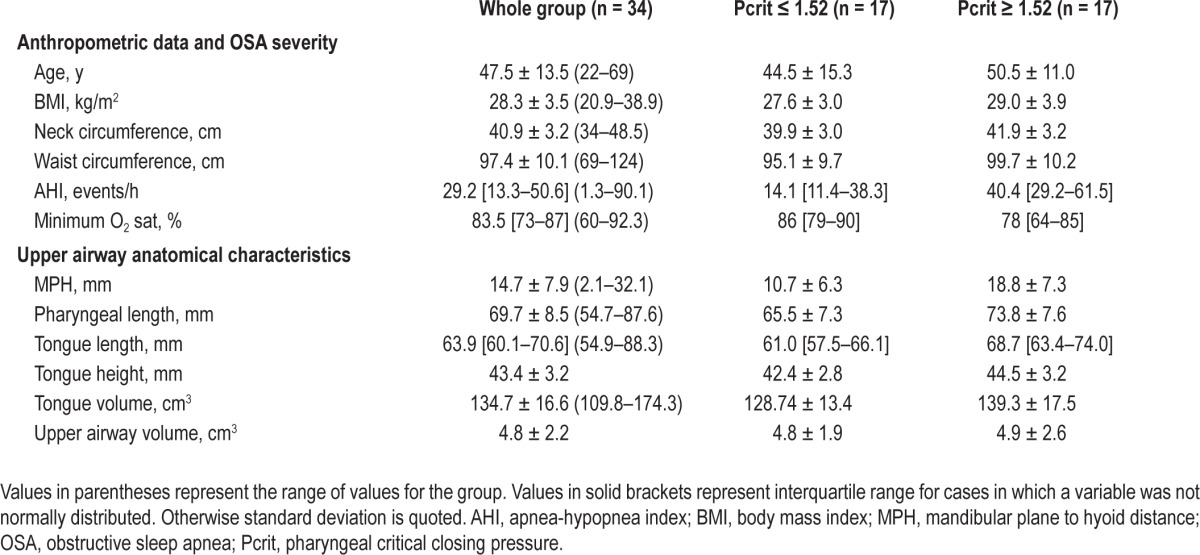
Table 2 shows the correlations between Pcrit and anthropometric and upper airway anatomical variables. Two different factors could be identified using factor analysis, which accounted for 56% of the total variance. Based on the correlations of each variable with a given factor, we could identify that the first factor aggregated variables were related to obesity (BMI, neck and waist circumferences; r values ranging from 0.840 to 0.972). The second factor aggregated variables were related to hyoid position (MPH, tongue length, tongue volume, pharyngeal length, and upper airway volume; r values ranging from 0.625 to 0.868). We therefore named the two factors as two distinct constructs: obesity and hyoid position. Factor scores for each patient allowed us to calculate correlations between Pcrit and the two distinct factors: obesity (r = 0.470; P = 0.007) and hyoid position (r = 0.630; P < 0.001) (Table 2). According to the obesity factor, Pcrit was associated with BMI, and waist and neck circumferences (Figure 2A). Regarding variables associated with the hyoid position factor, Pcrit correlated with pharyngeal length (Figure 2B), tongue length (r = 0.508; P = 0.002), tongue volume (0.381; P = 0.029) and MPH (r = 0.527; P = 0.001) but not with upper airway volume (Table 2). One participant had a negative Pcrit of approximately -15 cm H2O (Figures 2A and 2B). Removal of the data from this participant did not significantly alter the observed correlations (e.g., Pcrit versus neck circumference 0.476 versus 0.427 and Pcrit versus pharyngeal length 0.553 versus 0.537).
Table 2.
Associations between pharyngeal critical closing pressure, pharyngeal and tongue dimensions, and anthropometric variables grouped according to exploratory factor analysis.
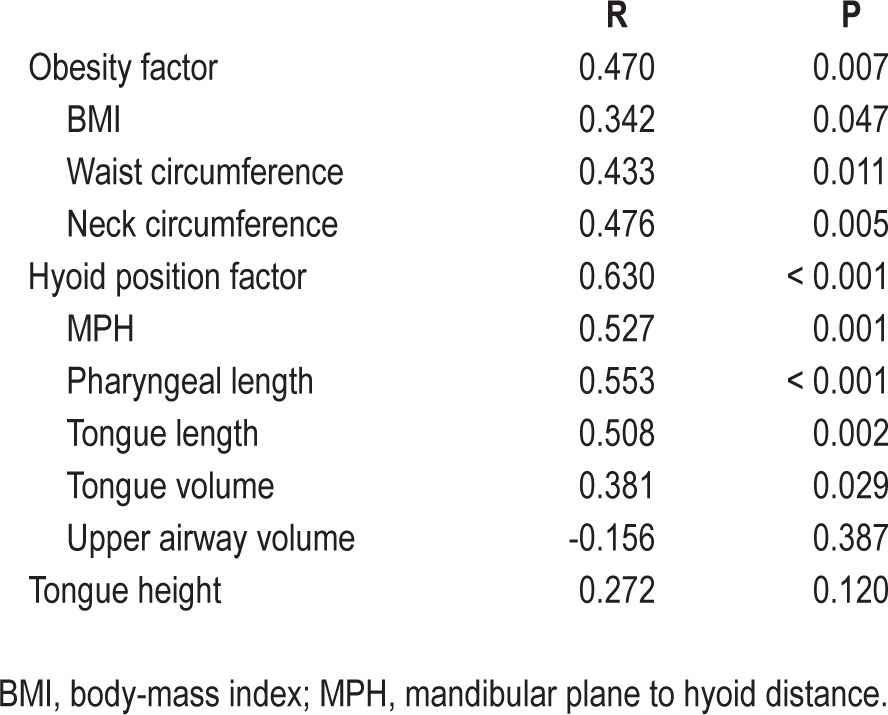
Figure 2.
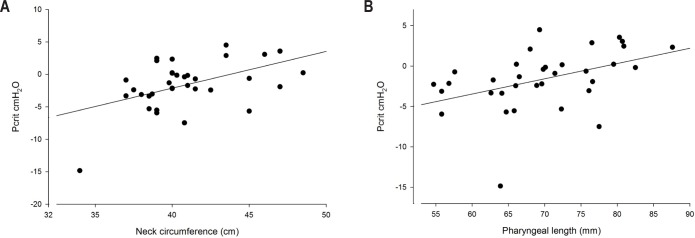
(A) Association between neck circumference and pharyngeal critical closing pressure (Pcrit). r = 0.476, P = 0.005. (B) Association between pharyngeal length and pharyngeal critical closing pressure (Pcrit). r = 0.553, P < 0.001.
Pharyngeal length correlated with waist (r = 0.451; P < 0.01) and neck (r = 0.388; P < 0.05) circumferences but not with BMI. Tongue volume and tongue length, respectively, were associated with obesity-related variables: BMI (r = 0.563 and 0.576, P < 0.001), waist (r = 0.526 and 0.612; P < 0.01) and neck (r = 0.669 and 0.612; P < 0.001) circumferences. MPH was also correlated with BMI (r = 0.365, P = 0.034), waist (r = 0.462, P = 0.006) and neck (r = 0.564, P < 0.001) circumferences. Tongue volume (r = 0.449; P < 0.01) and tongue length (r = 0.613; P < 0.001) showed strong associations with pharyngeal length.
CT scans of two representative subjects (with low and high Pcrit) are shown in Figure 1, highlighting differences in tongue volume, pharyngeal length, MPH, BMI, and Pcrit.
DISCUSSION
The findings of this study indicate that upper airway collapsibility (Pcrit) is associated with obesity (BMI, neck and abdominal circumferences) and hyoid position (and most of its related variables: MPH, tongue length, tongue volume, and pharyngeal length). Moreover, tongue dimensions, pharyngeal length, and MPH are associated with obesity variables. These findings provide novel insight into the potential factors mediating upper airway collapse in OSA.
One of the first descriptions indicating that pharyngeal length may increase upper airway collapsibility used a finite element airway model to estimate airway collapsibility.8 This study suggested that increased pharyngeal length as measured experimentally in men in comparison with women may contribute to differences between sexes in upper airway mechanics. Subsequent studies confirmed sex differences in airway length and the association of airway length to OSA severity.9,10 The findings of the current study extend these observations by performing direct Pcrit measurements and controlling the confounding influences of ethnicity and sex to provide additional mechanistic insight into the potential role of pharyngeal length and upper airway collapsibility. Therefore, the results of the current study support previous observations and suggest that pharyngeal length is indeed associated with increased pharyngeal collapsibility on a largely anatomical basis.
In the current study we show that MPH, tongue length, tongue volume, pharyngeal length, and upper airway volume aggregated into a single construct (hyoid position) using factor analysis. Previous reports have shown that increased tongue dimensions may displace the hyoid inferiorly and increase mandibular plane to hyoid distance (MPH).15,21 Our findings not only support this concept but also suggest that pharyngeal length may also be affected by tongue dimensions. We therefore propose that as the hyoid is attached to the epiglottis, a caudal displacement of the hyoid by an increase in tongue dimensions (tongue length and volume) would lead to an increase in pharyngeal length, MPH, and upper airway volume because the hyoid is the lower landmark of all these variables.
We report that Pcrit is associated with BMI. This finding is in accordance with prior data.22,23 We further addressed the association of Pcrit and obesity by showing that neck and abdominal circumferences are also associated with Pcrit. In addition, obesity was associated with tongue dimensions and pharyngeal length. Consistent with these findings, an increased tongue volume has previously been reported to be a predictor of OSA.7 Previous studies in animals24,25 and humans12,13 have also shown an association between tongue volume and obesity. Weight gain increases lingual fat content, myofiber diameter and tongue volume.12,25 The increased upper airway collapsibility associated with tongue volume and pharyngeal length may be mediated by obesity. These observations are further supported by a recent study showing that the decrease in pharyngeal length induced by weight loss was the most important upper airway characteristic influencing a reduction in the AHI.4 Decreased tracheal tug is another potential mechanism linking obesity to increased pharyngeal collapsibility.18,26 A reduction in end-expiratory lung volume caused by obesity could reduce the pharyngeal longitudinal tension exerted by the lungs and trachea via mediastinal structures. In contrast, experimentally lengthening the pharynx through tracheal traction increases pharyngeal longitudinal tension and decreases Pcrit (i.e., more negative, less collapsible).26,27 Although this mechanism may play a role in mediating upper airway collapsibility throughout the respiratory cycle, its effect in lengthening the pharyngeal airway is likely to be greatest during inspiration when the pressure gradient along the trachea to the thorax is largest.26 However, these forces are not well defined in humans. Nonetheless, it is likely that pharyngeal lengthening caused by an increase in tongue volume is a separate mechanism linking sleep apnea and obesity that may be independent of pharyngeal longitudinal tension.
The lack of association between upper airway volume and Pcrit was somewhat unexpected. Because patients with OSA have enlarged pharyngeal soft tissues, a reduced upper airway volume during sleep would be expected. However, the following reasons may explain the lack of association between Pcrit and upper airway volume measured during wakefulness in the present study. First, upper airway EMG activity is increased during wakefulness, reducing the tendency for upper airway narrowing.28 Second, a reduction in upper airway dimensions29 and EMG activity30 occurs from wakefulness to sleep, suggesting that static upper airway imaging during wakefulness does not fully capture the reduction in upper airway dimension that is characteristic of OSA. Consistent with this observation, other studies performed during wakefulness have also failed to demonstrate differences in upper airway volume among OSA patients versus controls.7,31 Of note, pharyngeal volume is a function of a number of variables including its intrinsic size, the degree of external compression, and the extent of longitudinal traction which may all interact in a complex manner regarding the correlation between pharyngeal volume during wakefulness and Pcrit. Third, we showed that pharyngeal length is associated with tongue dimensions and obesity. An increase in pharyngeal length would attenuate the tendency for a reduction in upper airway volume that is expected to occur in patients with OSA because pharyngeal length and mean pharyngeal radius define upper airway volume.7 Although technically challenging, upper airway volume should be determined during sleep to better characterize its association with pharyngeal collapsibility.
Our study has several limitations. We were not able to measure the longitudinal tension of the pharyngeal airway. For example, the mechanical behavior of an intrinsically long airway is likely to be very different from that of an intrinsically short airway, which is stretched longitudinally.27,32 In addition, we included only Japanese-Brazilian males, limiting the findings to the studied population. However, this design allows us to control for several important, potentially confounding influences. The sample size of this study was relatively small but reasonable for a physiological study. Nevertheless, we were able to study subjects with a wide range of Pcrit and AHI values that included normal subjects. In addition, we calculated that a sample size of of 26 or more provided more than 80% power to detect a significant correlation coefficient of 0.5 with an alpha level of 0.05. Moreover, the relatively high correlation coefficients we found suggest strong associations between the variables tested. Appropriately designed studies involving larger sample sizes are required to determine the magnitude of the effect for changes in Pcrit for the associated parameters observed in this study (e.g., obesity and hyoid position). Our Pcrit measurements were performed after sleep induction with midazolam rather than during natural sleep. However, we have previously shown that Pcrit measured using small doses of midazolam as used in the current study are comparable to upper airway collapsibility values obtained during natural sleep.17 Nonetheless, studying a larger sample that included other races and women is necessary to expand the generalizability and applicability of our findings. Finally, because of the cross-sectional design of this study, we cannot make definitive conclusions regarding the role of obesity on tongue and pharyngeal dimensions and upper airway collapsibility.
In conclusion, this study has shown that pharyngeal collapsibility is associated with obesity and hyoid position. Given the many factors underlying OSA and their complex interactions, further work investigating the relationship between obesity, upper airway structures, and function is required.
DISCLOSURE STATEMENT
This was not an industry supported study. This work was conducted with support from Harvard Catalyst | The Harvard Clinical and Translational Science Center (National Center for Research Resources and the National Center for Advancing Translational Sciences, National Institutes of Health Award 8UL1TR000170-05 and financial contributions from Harvard University and its affiliated academic health care centers. The study was supported by FAPESP, FundaÇão de Amparo à Pesquisa do Estado de São Paulo, NIH, AHA. Drs. Genta and Eckert received a modified continuous positive airway pressure device on loan from Philips Respironics to make physiological measurements for research purposes. The other authors have indicated no financial conflicts of interest.
ACKNOWLEDGMENTS
The authors thank Philips Respironics for providing the modified CPAP device.
Footnotes
A commentary on this article appears in this issue on page 1585.
REFERENCES
- 1.Eckert D, Malhotra A, Jordan A. Mechanisms of apnea. Prog Cardiovasc Dis. 2009;51:313–23. doi: 10.1016/j.pcad.2008.02.003. [DOI] [PMC free article] [PubMed] [Google Scholar]
- 2.Young T, Palta M, Dempsey J, Skatrud J, Weber S, Badr S. The occurrence of sleep-disordered breathing among middle-aged adults. N Engl J Med. 1993;328:1230–5. doi: 10.1056/NEJM199304293281704. [DOI] [PubMed] [Google Scholar]
- 3.Barkdull GC, Kohl CA, Patel M, Davidson TM. Computed tomography imaging of patients with obstructive sleep apnea. Laryngoscope. 2008;118:1486–92. doi: 10.1097/MLG.0b013e3181782706. [DOI] [PubMed] [Google Scholar]
- 4.Sutherland K, Lee RW, Phillips CL, et al. Effect of weight loss on upper airway size and facial fat in men with obstructive sleep apnoea. Thorax. 2011;66:797–803. doi: 10.1136/thx.2010.151613. [DOI] [PubMed] [Google Scholar]
- 5.Cistulli PA. Craniofacial abnormalities in obstructive sleep apnoea: implications for treatment. Respirology. 1996;1:167–74. doi: 10.1111/j.1440-1843.1996.tb00028.x. [DOI] [PubMed] [Google Scholar]
- 6.Brown EC, Cheng S, McKenzie DK, Butler JE, Gandevia SC, Bilston LE. Respiratory movement of upper airway tissue in obstructive sleep apnea. Sleep. 2013;36:1069–76. doi: 10.5665/sleep.2812. [DOI] [PMC free article] [PubMed] [Google Scholar]
- 7.Schwab R, Pasirstein M, Pierson R, et al. Identification of upper airway anatomic risk factors for obstructive sleep apnea with volumetric magnetic resonance imaging. Am J Respir Crit Care Med. 2003;168:522–30. doi: 10.1164/rccm.200208-866OC. [DOI] [PubMed] [Google Scholar]
- 8.Malhotra A, Huang YQ, Fogel RB, et al. The male predisposition to pharyngeal collapse. Importance of airway length. Am J Respir Crit Care Med. 2002;166:1388–95. doi: 10.1164/rccm.2112072. [DOI] [PubMed] [Google Scholar]
- 9.Ronen O, Malhotra A, Pillar G. Influence of gender and age on upper-airway length during development. Pediatrics. 2007;120:e1028–34. doi: 10.1542/peds.2006-3433. [DOI] [PMC free article] [PubMed] [Google Scholar]
- 10.Segal Y, Malhotra A, Pillar G. Upper airway length may be associated with the severity of obstructive sleep apnea syndrome. Sleep Breath. 2008;12:311–6. doi: 10.1007/s11325-008-0191-9. [DOI] [PubMed] [Google Scholar]
- 11.Yamashiro Y, Kryger M. Is laryngeal descent associated with increased risk for obstructive sleep apnea? Chest. 2012;141:1407–13. doi: 10.1378/chest.10-3238. [DOI] [PubMed] [Google Scholar]
- 12.Nashi N, Kang S, Barkdull GC, Lucas J, Davidson TM. Lingual fat at autopsy. Laryngoscope. 2007;117:1467–73. doi: 10.1097/MLG.0b013e318068b566. [DOI] [PubMed] [Google Scholar]
- 13.Shigeta Y, Ogawa T, Ando E, Clark GT, Enciso R. Influence of tongue/ mandible volume ratio on oropharyngeal airway in Japanese male patients with obstructive sleep apnea. Oral Surg Oral Med Oral Pathol Oral Radiol Endod. 2011;111:239–43. doi: 10.1016/j.tripleo.2010.10.013. [DOI] [PMC free article] [PubMed] [Google Scholar]
- 14.Tsuiki S, Isono S, Ishikawa T, Yamashiro Y, Tatsumi K, Nishino T. Anatomical balance of the upper airway and obstructive sleep apnea. Anesthesiology. 2008;108:1009–15. doi: 10.1097/ALN.0b013e318173f103. [DOI] [PubMed] [Google Scholar]
- 15.Chi L, Comyn FL, Mitra N, et al. Identification of craniofacial risk factors for obstructive sleep apnoea using three-dimensional MRI. Eur Respir J. 2011;38:348–58. doi: 10.1183/09031936.00119210. [DOI] [PMC free article] [PubMed] [Google Scholar]
- 16.Eckert DJ, White DP, Jordan AS, Malhotra A, Wellman A. Defining phenotypic causes of obstructive sleep apnea: identification of novel therapeutic targets. Am J Respir Crit Care Med. 2013;188:996–1004. doi: 10.1164/rccm.201303-0448OC. [DOI] [PMC free article] [PubMed] [Google Scholar]
- 17.Genta PR, Eckert DJ, Gregorio MG, et al. Critical closing pressure during midazolam-induced sleep. J Appl Physiol. 2011;111:1315–22. doi: 10.1152/japplphysiol.00508.2011. [DOI] [PMC free article] [PubMed] [Google Scholar]
- 18.Owens RL, Malhotra A, Eckert DJ, White DP, Jordan AS. The influence of end-expiratory lung volume on measurements of pharyngeal collapsibility. J Appl Physiol. 2010;108:445–51. doi: 10.1152/japplphysiol.00755.2009. [DOI] [PMC free article] [PubMed] [Google Scholar]
- 19.Patil S, Schneider H, Marx J, Gladmon E, Schwartz A, Smith P. Neuromechanical control of upper airway patency during sleep. J Appl Physiol. 2007;102:547–56. doi: 10.1152/japplphysiol.00282.2006. [DOI] [PubMed] [Google Scholar]
- 20.Kirkness JP, Peterson LA, Squier SB, et al. Performance characteristics of upper airway critical collapsing pressure measurements during sleep. Sleep. 2011;34:459–67. doi: 10.1093/sleep/34.4.459. [DOI] [PMC free article] [PubMed] [Google Scholar]
- 21.Nelson S, Hans M. Contribution of craniofacial risk factors in increasing apneic activity among obese and nonobese habitual snorers. Chest. 1997;111:154–62. doi: 10.1378/chest.111.1.154. [DOI] [PubMed] [Google Scholar]
- 22.Kirkness J, Schwartz A, Schneider H, et al. Contribution of male sex, age, and obesity to mechanical instability of the upper airway during sleep. J Appl Physiol. 2008;104:1618–24. doi: 10.1152/japplphysiol.00045.2008. [DOI] [PMC free article] [PubMed] [Google Scholar]
- 23.Schwartz AR, Gold AR, Schubert N, et al. Effect of weight-loss on upper airway collapsibility in obstructive sleep-apnea. Am Rev Respir Dis. 1991;144:494–8. doi: 10.1164/ajrccm/144.3_Pt_1.494. [DOI] [PubMed] [Google Scholar]
- 24.Brennick M, Pack A, Ko K, et al. Altered upper airway and soft tissue structures in the New Zealand Obese mouse. Am J Respir Crit Care Med. 2009;179:158–69. doi: 10.1164/rccm.200809-1435OC. [DOI] [PMC free article] [PubMed] [Google Scholar]
- 25.Saito T, Yamane A, Kaneko S, et al. Changes in the lingual muscles of obese rats induced by high-fat diet feeding. Arch Oral Biol. 2010;55:803–8. doi: 10.1016/j.archoralbio.2010.07.004. [DOI] [PubMed] [Google Scholar]
- 26.Van de Graaff WB. Thoracic traction on the trachea: mechanisms and magnitude. J Appl Physiol. 1991;70:1328–36. doi: 10.1152/jappl.1991.70.3.1328. [DOI] [PubMed] [Google Scholar]
- 27.Thut DC, Schwartz AR, Roach D, Wise RA, Permutt S, Smith PL. Tracheal and neck position influence upper airway airflow dynamics by altering airway length. J Appl Physiol. 1993;75:2084–90. doi: 10.1152/jappl.1993.75.5.2084. [DOI] [PubMed] [Google Scholar]
- 28.Mezzanotte W, Tangel D, White D. Waking genioglossal electromyogram in sleep-apnea patients versus normal controls (a neuromuscular compensatory mechanism) J Clin Invest. 1992;89:1571–9. doi: 10.1172/JCI115751. [DOI] [PMC free article] [PubMed] [Google Scholar]
- 29.Trudo FJ, Gefter WB, Welch KC, Gupta KB, Maislin G, Schwab RJ. State-related changes in upper airway caliber and surrounding soft-tissue structures in normal subjects. Am J Respir Crit Care Med. 1998;158:1259–70. doi: 10.1164/ajrccm.158.4.9712063. [DOI] [PubMed] [Google Scholar]
- 30.Mezzanotte WS, Tangel DJ, White DP. Influence of sleep onset on upper-airway muscle activity in apnea patients versus normal controls. Am J Respir Crit Care Med. 1996;153:1880–7. doi: 10.1164/ajrccm.153.6.8665050. [DOI] [PubMed] [Google Scholar]
- 31.Chen NH, Li KK, Li SY, et al. Airway assessment by volumetric computed tomography in snorers and subjects with obstructive sleep apnea in a Far-East Asian population (Chinese) Laryngoscope. 2002;112:721–6. doi: 10.1097/00005537-200204000-00023. [DOI] [PubMed] [Google Scholar]
- 32.Malhotra A, Butler JP, Wellman A. The pharyngeal airway: is bigger really better? Chest. 2012;141:1372–5. doi: 10.1378/chest.11-2989. [DOI] [PubMed] [Google Scholar]