

Abstract
Objectives:
Accumulating evidence has shown that there is a genetic contribution to obstructive sleep apnea (OSA).The objectives were to use magnetic resonance imaging (MRI) cephalometry to (1) confirm heritability of craniofacial risk factors for OSA previously shown by cephalometrics; and (2) examine the heritability of new craniofacial structures that are measurable with MRI.
Design:
A sib pair “quad” design examining apneics, apneic siblings, controls, and control siblings. The study design used exact matching on ethnicity and sex, frequency matching on age, and statistical control for differences in age, sex, ethnicity, height, and weight.
Setting:
Academic medical center.
Patients:
We examined 55 apneic probands (apnea-hypopnea index [AHI]: 46.8 ± 33.5 events/h), 55 proband siblings (AHI: 11.1 ± 15.9 events/h), 55 controls (AHI: 2.2 ± 1.7 events/h), and 55 control siblings (AHI: 4.1 ± 4.0 events/h).
Interventions:
N/A.
Measurements and Results:
Five independent domains reflecting different aspects of the craniofacial structure were examined. We confirmed heritability of sella–nasion–subspinale (38%, P = 0.002), saddle angle (55%, P < 0.0001), mandibular length (24%, P = 0.02) and lower facial height (33%, P = 0.006) previously measured by cephalometry. In addition, the current study added new insights by demonstrating significant heritability of mandibular width (30%, P = 0.005), maxillary width (47%, P < 0.0001), distance from the hyoid bone to the retropogonion (36%, P = 0.0018) and size of the oropharyngeal space (31%, P = 0.004). Finally, our data indicate that heritability of the craniofacial structures is similar in normal patients and those with apnea.
Conclusions:
The data support our a priori hypothesis that the craniofacial structures that have been associated with obstructive sleep apnea (OSA) are heritable. We have demonstrated heritability for several intermediate craniofacial phenotypes for OSA. Thus, we believe that future studies should be able to identify genes associated with these intermediate craniofacial phenotypes.
Citation:
Chi L, Comyn FL, Keenan BT, Cater J, Maislin G, Pack AI, Schwab RJ. Heritability of craniofacial structures in normal subjects and patients with sleep apnea. SLEEP 2014;37(10):1689-1698.
Keywords: Heritability, craniofacial structures, sleep apnea, craniofacial
INTRODUCTION
Obstructive sleep apnea (OSA) has been shown to affect at least 4% of middle-aged men and 2% of middle-aged women in its symptomatic form.1 A more recent study revealed a higher prevalence (40.6% in men and 26.1% in women) in a Brazilian adult population.2 Because of the high prevalence of OSA, identifying genetic factors that increase the risk for OSA has major public health significance.
Studies have shown that genetic factors are important in the pathogenesis of OSA.3–9 Various craniofacial abnormalities that are genetic in origin, such as syndromic craniosynostosis (Apert, Crouzon, and Pfeiffer syndrome),10 Treacher Collins syndrome, Pierre Robin syndrome,11 Down's syndrome,12 and achondroplasia,13 have been shown to associate with a high prevalence of OSA. However, to better understand the genetics of sleep apnea, we need to examine intermediate traits for OSA such as upper airway anatomy, which includes both upper airway soft-tissue and craniofacial morphology.
Moreover, familial aggregation of craniofacial morphology in patients with sleep apnea has been shown in several studies.5,14 These studies used cephalometric radiographs to examine craniofacial structure. Studies using cephalometrics have demonstrated that the heritability of craniofacial structures is high in twins and families (normal subjects).15–17 Recently, a genome-wide association study (GWAS) identified five loci influencing facial morphology in Europeans.18 Thus, there appear to be genes that mediate craniofacial morphology.
Independent of craniofacial heritability, we have previously demonstrated that the volume of upper airway soft tissue structures (tongue, lateral walls, and total soft tissue) demonstrated heritability on the order of 35% to 40%.19 We have also shown that the volume of the upper airway soft-tissue structures are enlarged in individuals with OSA in a case-control study.20 Subsequently, we examined craniofacial risk factors for OSA in the same case-control study. The results indicate that a small and shallow mandible is an independent risk factor for OSA in men; inferior-posterior positioning of hyoid bone was associated with sleep apnea in men and women, and the enlargement of tongue volume was likely the pathogenic factor for this hyoid displacement.21 Previous studies using cephalometry have shown that individuals with apnea have small retroposed mandibles, narrow posterior airway spaces, enlargement of the tongue and soft palate, an inferiorly positioned hyoid bone, and retroposition of maxilla compared with nonapneic individuals.22–25
We performed three-dimensional (3-D) magnetic resonance imaging (MRI) cephalometry of the craniofacial structure in probands with OSA, proband siblings, control subjects, and control siblings, all matched according to age, sex, and ethnicity. The 3-D MRI allows us to make measurements not available on standard cephalometric radiographs, such as mandibular and maxillary width and divergence. The objectives of the current study were to use MRI cephalometry to (1) confirm the heritability of craniofacial risk factors for OSA previously shown by cephalometrics; and (2) examine the heritability of new craniofacial structure that is measurable with MRI. We hypothesized that aspects of craniofacial structures relevant to OSA would demonstrate significant family aggregation.
METHODS
Subjects
We conducted a sib pair “quad” design with four subject groups (see Figure 1): (1) probands (apneics); (2) same-sex siblings of proband within 10 y of the age of the proband; (3) normal subjects (controls), matched to the proband for age within 5 y, sex, and ethnicity, and living in the same school district of the matched proband; and (4) same-sex siblings of control subjects within 10 y of the age of the control subject. Age was also included as a covariate in all analyses. Probands had to have an apnea-hypopnea index (AHI) > 15 events/h and have a same-sex sibling within 10 y of age. Control subjects, matched for sex, age, ethnicity, and school district, had to have an AHI < 5 events/h, confirmed with an overnight sleep study. We studied 220 subjects (55 probands and their siblings and 55 control subjects and their siblings). Fifty-five probands and 55 control subjects were the basis for our recently reported case-control study.19–21 See supplemental material for additional information about subjects.
Figure 1.
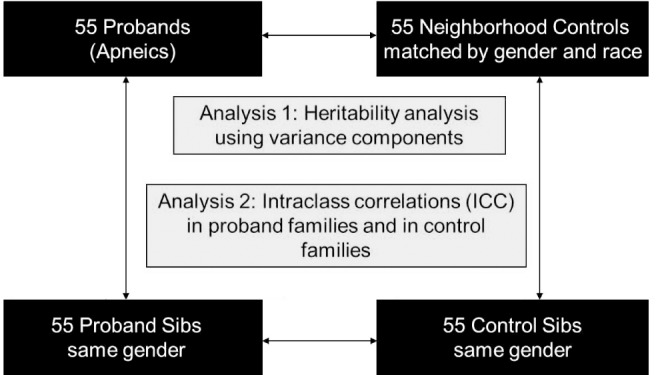
A schematic of the sib pair “quad” design with four subject groups: (1) probands (patients with obstructive sleep apnea); (2) same-sex siblings of proband within 10 y of the age of the proband; (3) control subjects (normal subjects), matched to the proband for age within 5 y, sex, and ethnicity and living in the neighborhood (same school district) of the matched proband; (4) same-sex siblings of control subject within 10 y of the age of the control subject. Family aggregation of the craniofacial risk factors were assessed with an analogous mixed-model analysis of variance but focused on the variance components to quantify the degree of familial aggregation (heritability) for each measurement.
Polysomnography
Standard polysomnography techniques were used.26 See supplemental material and Table 1 for additional information about sleep study methodology and definitions of events.
Table 1.
Demographic and sleep characteristics of quads patient groupings.
Magnetic Resonance Imaging
The 3-D MRI was performed using the same methodology in all subjects, using a 1.5-Tesla magnetic resonance scanner to obtain spin-echo axial and sagittal images. The imaging protocols were described in detail in our previous studies.19–21 The technicians who performed the magnetic resonance analysis were blinded to the results of the sleep study, so they did not know if the subject was apneic, an apneic sibling, control, or control sibling.
Anatomic Definitions, Measurements, and Analysis
The anatomic definitions, measurements, and analysis strategies were identical to those used in our previous MRI studies, and our analysis techniques have demonstrated excellent intra-reader and interreader reliability.21 We have also included additional measures of craniofacial height and area and hyoid distances (Figures 2 through 4). The anatomic measures analyzed were separated into five independent domains reflecting different aspects of the craniofacial structure: (1) craniofacial angles (6 measures) (Figure 2): sella–nasion–subspinale (SNA), sella–nasion–supramentale (SNB), the difference between the SNA and SNB angles, nasion–sella–basion (“saddle angle,” Na–S–Ba), anterior cranial base (ACB) to horizontal plane, and the palatal plane (anterior nasal spine [ANS]–posterior nasal spine [PNS]) to the anterior cranial base (ACB); (2) mandibular measurements (7 measures): depth, divergence, length corpus, length ramus, width second premolar, width first molar, and width inner gonion; (3) maxillary measurements (4 measures): depth, divergence, width second premolar, and width first molar; (4) hyoid distances (4 measures) (Figure 3): hyoid to retropogonion, hyoid to the third cervical vertebrae (C3), hyoid to sella (S), and retropogonion to the C3; and (5) craniofacial heights and areas (8 measures) (Figures 2 and 4): upper facial height (UFH), lower facial height (LFH), anterior facial height (equal to UFH + LFH, abbreviated AFH), the ratio of UFH to anterior facial height (AFH), the distance from the posterior nasal spine (PNS) to the anterior arch atlas, the area within the region defined by the nasion (Na), the anterior nasal spine (ANS) and the basion (Ba) (nasopharyngeal area, see Figure 4), the area within the region defined by the anterior nasal spine (ANS), menton (Me), third cervical vertebrae (C3) and the basion (Ba) (oropharyngeal area, see Figure 4), and the sum of the nasopharyngeal and oropharyngeal areas (naso-oropharyngealarea).
Figure 2.

Craniofacial heights and angles. A, subspinale; ANS, anterior nasal spine; B, supramentale; Ba, basion; HP, horizontal plane; LFH, lower facial height; Me, menton; Na, nasion; PNS, posterior nasal spine; S, sella; UFH, upper facial height. Left panel: UFH: the distance between Na to ANS. LFH: the distance between ANS to Me. Right panel: SNA angle (S–Na–A) evaluates the relative anteroposterior position of the maxilla to the cranial base. SNB angle (S–Na–B) evaluates the relative antero-posterior position of the mandible to the cranial base and the ANB angle (A–Na–B) the difference between SNA and SNB angle, assessed the anteroposterior relationship between the maxilla and the mandible. Saddle angle (Na–S–Ba): angulation of the cranial base plus indirect determination of the position of the glenoid fossa (depression in the temporal bone where the condyle of the mandible articulates to form the temporomandibular joint). Palatal plane to anterior cranial base angle: angulation of the palatal plane (ANS–PNS) in reference to the anterior cranial base (S–Na). Anterior cranial base to horizontal plane: angulation of the anterior cranial base (S–Na) and the true horizontal plane.
Figure 4.
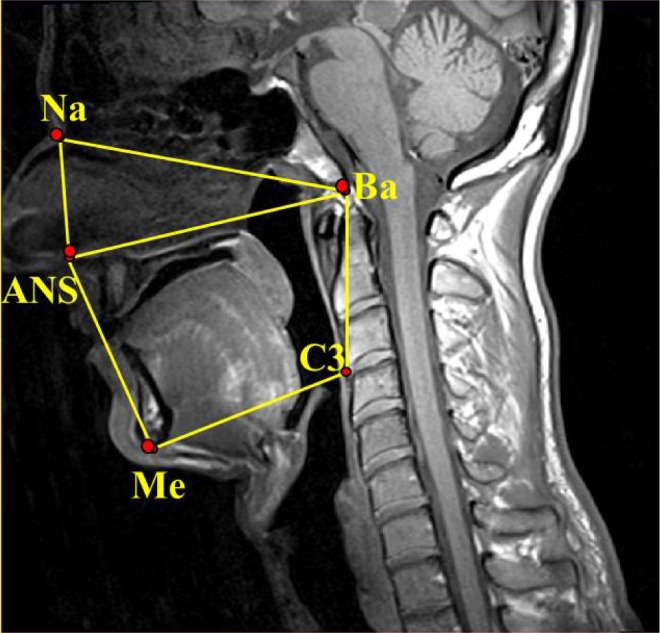
Nasopharyngeal area: Area within the region defined by the nasion (Na), the anterior nasal spine (ANS), and the basion (Ba). Oropharyngeal area: area within the region defined by the anterior nasal spine (ANS), menton (Me), third cervical vertebrae (C3), and the basion (Ba); Naso-oropharyngeal area: the sum of the nasopharyngeal and oropharyngeal areas (Na–ANS–Me–C3–Ba–Na).
Figure 3.
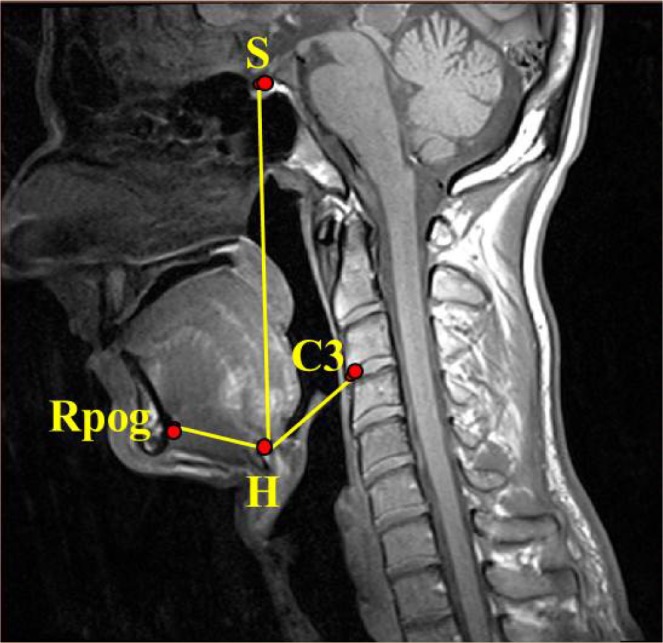
Hyoid measures. Hyoid bone (H): the most superior and anterior point on the body of the hyoid bone. Retropogonion (Rpog): the most posterior point of the inner surface of the mandibular symphysis. Third cervical vertebrae (C3): most anterior and inferior point of the third cervical vertebrae. S, sella.
Statistical Analysis
To compare demographic and MRI craniofacial structures among patient groups (apneics, apneic sibs, controls, control sibs), we used a mixed-model analysis of variance (ANOVA) that included random effects for quad and family within quad. If significant differences were found, we examined pair-wise contrasts of interest.
To quantify the degree of family aggregation (heritability) of craniofacial structures, we conducted a mixed-model ANOVA for each measurement, focusing on the variance components. The variance components (between-quad matches [σ2QUAD], families within quads [σ2FAMILY(QUAD)], and residual error [σ2ERROR]) were used to estimate (broad-sense) heritability as:
Thus, h2 can be interpreted as the percentage of total variance around the mean of the phenotype measure explained by systematic variance between families, taking into account the matching of families by quads. Variables including sex, age, ethnicity, height, weight, and body mass index (BMI) were then added to the model (as fixed effects) in order to determine adjusted h2 values. Height was included, based on previous findings that cephalometric measurements and stature are closely correlated in different populations21,27,28 and is heritable.25–32 Human height is a highly heritable human trait; twin studies have demonstrated heritability of height was approximately 80%,29 and several linked loci have been discovered.30 GWAS have identified many loci associated with height.31–36 Cephalo-facial anthropometry has been used to estimate stature using regression analysis and showed high reliability and correlation with stature.27,28,37 We believe, therefore, that height is an important contributor to craniofacial characteristics and is heritable. Therefore, we controlled for it in the analysis.
Unadjusted and adjusted intraclass correlation coefficients (ICCs) for the size of the craniofacial structures were also generated, independently between the probands/proband siblings and control subjects/control siblings. This analysis was conducted in order to determine if the family aggregation of these structures is different in normal subjects than in patients with sleep apnea. To assess whether observed differences in the ICC estimates within proband and control pairs were significant, we used a permutation test, comparing the observed difference in ICC estimates to the distribution of differences derived from 1,000 randomly permuted samples. A two-sided P value was calculated as two times the proportion of estimates that were more extreme than the observed ICC difference.
Based on previous literature,9,15–17,38 our primary a priori hypotheses for this investigation were that within each of the aforementioned craniofacial domains (craniofacial angles, mandibular measurements, maxillary measurements, hyoid distances, and craniofacial heights and areas), specific measurements would demonstrate heritability. To correct for the multiple measures within each domain, we compared the nominal P -values for individual heritability estimates to Bonferroni adjusted alpha levels (α = 0.05 divided by the number of variables tested for each domain) in order to determine statistical significance for novel associations. Based on this method, domain specific Bonferroni corrected levels of significance were: (1) craniofacial angles: P < 0.05/6 (= 0.0083), (2) mandibular measurements: P < 0.05/7 (= 0.0071), (3) maxillary measurements: P < 0.05/4 (= 0.0125); (4) hyoid distances: P < 0.05/4 (= 0.0125); and (5) craniofacial heights and areas: P < 0.05/8 [= 0.0063]). For any craniofacial structure shown to be heritable in previous literature, P < 0.05 was considered significant evidence of replication.
RESULTS
Demographics of Quad Patient Groups
The quad study dataset consisted of 55 sets of four patients, each containing a proband (apneic), a sibling of this proband, a matched control subject, and a sibling of this control subject (Figure 1). Quads were 49.1% male and 45.5% white, 49.1% African American, 3.6% Asian, and 1.8% Hispanic. There were significant differences in age across the groups (P < 0.0001), but because the quad sets were matched by age, group differences in ages were relatively small (Table 1). There was no difference in the age of probands and proband-sibs (P = 0.226), but both were significantly older than controls (P = 0.004 and 0.034, respectively) and control-sibs (P < 0.0001 and P < 0.001, respectively). Controls were also significantly older than control-sibs (P = 0.007). To control for the influence of these residual age differences, we included age as a covariate in all models. There was also a significant difference in BMI across groups (P < 0.0001, Table 1), although many subjects in all groups were overweight. Probands were significantly heavier than proband-sibs (P < 0.0001), controls (P < 0.0001), and control-sibs (P < 0.0001). Proband-sibs had a larger BMI than controls (P = 0.002) and control-sibs (P = 0.002); thus, they had obesity levels that fell between those of probands and control pairs. Because there is no a priori reason to believe weight affects craniofacial structures, our primary adjusted model included age, sex, ethnicity, and height. However, we also assessed additional models adjusted for these four covariates plus weight and adjusted for age, sex, ethnicity, and BMI.
Sleep Characteristics of Quad Patient Groups
Comparisons of sleep characteristics among the four quad patient groups are shown in Table 1. There were significant differences in AHI (P < 0.0001) across the groups, which was expected given the study design. Probands were required to have an AHI of 15 or greater (mean ± standard deviation [SD] AHI: 46.8 ± 33.5 events/h) and control subjects an AHI of less than 5 (AHI: 2.2 ± 1.7 events/h). Proband siblings had an AHI of 11.1 ± 15.9 events/h and the control siblings of 4.1 ± 4.0 events/h. The differences in AHI were statistically significant (P < 0.05) for all pairwise comparisons except between controls and control-sibs (P = 0.558). Thus, proband siblings had an intermediate AHI between the probands and control subjects. There were also significant differences across groups for arousal index (P < 0.0001), amount of rapid eye movement (REM) sleep (P = 0.034), and amount of non-REM sleep (P = 0.011). Probands had the highest arousal index, the least amount of REM and delta sleep compared with the other subject groups.
Comparison of Craniofacial Structures Among Quad Patient Groups
Comparison of mean values and standard deviations between the four subject groups for the measurements of craniofacial structure in each domain are shown in Table S1 (supplemental material). Differences between probands and controls for most of these measures are discussed in a previous study.21 When comparing the four subject groups, we observed significant differences in upper facial height (P = 0.034), mandibular length ramus (P = 0.019), mandibular width inner gonion (P = 0.021), the distance from the retropogonion to the third vertebrae (P = 0.009), the anterior cranial base to horizontal plane angle (P < 0.001) and the distances from the hyoid bone to the retropogonion (P < 0.0001), the third vertebrae (P < 0.001) and the sella (P < 0.001), after adjustment for age, sex, race, and height. When we considered additional models adjusted for BMI in place of height and adjusted for height and weight, most of these differences were no longer statistically significant (Table S1), whereas a few others that were borderline nonsignificant (including the ratio of upper to anterior facial height, mandibular width first molar, and mandibular depth) became nominally significant (P < 0.05).
When examining the pairwise contrasts of measures significant after age, sex, race, and height adjustment, six of the eight measures that showed significant across-subject group differences had between-group differences that were consistent with being OSA risk factors (see Figure S1, supplemental material). For the four distance measures (hyoid distances, retropogonion to C3) and the anterior cranial base to horizontal plane angle, probands had larger values than controls (all P < 0.008), control-sibs (all P ≤ 0.011), and proband-sibs (P ≤ 0.051). Moreover, the differences between probands and proband-sibs were typically smaller than those between probands and controls or control-sibs; this relationship is consistent with a risk factor that is heritable. A similar, but opposite, effect was observed for mandible length ramus, with probands and proband-sibs showing significantly smaller lengths than control-sibs (P = 0.003 and 0.009, respectively) and smaller, but nonsignificant, lengths compared to controls (P = 0.118 and 0.219, respectively). The across-group differences observed for upper facial height were driven by the proband-sibs, who had larger heights compared to probands (P = 0.005), controls (P = 0.044) and control-sibs (P = 0.054), and differences in mandibular width gonion were driven by controls, who had smaller widths compared to probands (P = 0.004), proband-sibs (P = 0.009), and control-sibs (P = 0.050).
Heritability Estimates
Craniofacial Angles
We observed significant heritability estimates for five of the six craniofacial angles examined (Figure 5 and Table S2, supplemental material). Both before and after covariate adjustment, we replicated previously observed heritability11 for the sella–nasion–subspinal (SNA) angle, the sella–nasion–supramentale (SNB) angle, the difference between SNA and SNB, the saddle angle (nasion–sella–basion), and the angle between the anterior cranial base (ACB) and the horizontal plane. The heritability estimates for the SNA (h2 = 38%, P = 0.0022), saddle (h2 = 55%, P < 0.0001), and ACB to horizontal plane (h2 = 42%, P = 0.0009) angles remained significant at our Bonferonni corrected P value, even after adjusting for age, sex, race, and height (Model 1 in Table S2). Additional adjustment using BMI in place of height (Model 2 in Table S2) or weight and height (Model 3 in Table S2) did not significantly change the heritability estimates.
Figure 5.

Heritability estimates for structures in the five craniofacial domains: The heritability estimates from unadjusted models and models adjusted for age, sex, race, and height are shown for structures and are shown in each of the five domains. Asterisk: nominally significant (P < 0.05); Double asterisks: significant after Bonferonni correction for multiple comparisons within each domain. SNA, sella–nasion–subspinale angle; SNB, sella–nasion–supramentale angle; Saddle, nasion–sella–basion angle; ACB, anterior cranial base; C3, the third cervical vertebrae; UFH, upper facial height; AFH, anterior facial height (UFH + LFH); PNS, posterior nasal spine; nasopharyngeal area, area within the region defined by the nasion, the anterior nasal spine, and the basion (Figure 4); oropharyngeal area, area within the region defined by the anterior nasal spine, menton, third cervical vertebrae, and the basion (Figure 4); naso-oropharyngeal area, the sum of the nasopharyngeal and oropharyngeal areas.
Mandibular Measurements
There was significant heritability for mandibular width and length measures both in unadjusted and adjusted models (Figure 5 and Table S3, supplemental material).
In unadjusted models, we replicated previously established heritability11–13 of ramus length (h2 = 28%, P = 0.0276), but not corpus length (h2 = 16%, P = 0.1017). However, after covariate adjustment, the heritability estimate of corpus length became significant (h2 = 24%, P = 0.0170), whereas ramus length was no longer heritable (h2 = 15%, P = 0.1387). In addition to these previous observed variables, we observed significant heritability for our novel measures of mandibular width. After adjustment for age, sex, race, and height (Model 1 in Table S3), the mandibular width between first molars (h2 = 30%, P = 0.0050) and width inner gonion (h2 = 38%, P = 0.0006) both met our multiple comparisons corrected level of significance (P < 0.0063). The heritability of mandibular width between second premolars (h2 = 30%, P = 0.0065) was borderline significant after Bonferroni correction. No significant heritability was seen for mandibular depth or divergence. In additional models adjusted for BMI in place of height (Model 2 in Table S3) and weight and height (Model 3 in Table S3), the heritability estimate for mandibular length corpus was no longer statistically significant. All other heritability estimates were not significantly changed.
Maxillary Measurements
Significant heritability was seen for all maxillary measures in either unadjusted or adjusted models (Figure 5 and Table S4, supplemental material).
In unadjusted models, we replicated previously found heritability11–13 for maxillary unit depth (h2 = 19%, P = 0.041) and divergence (h2 = 23%, P = 0.0184) Maxillary divergence (h2 = 23%, P = 0.0207) remained significant after adjustment, whereas the estimate for unit depth (h2 = 25%, P = 0.0540) increased, but was not statistically significant. We observed significant heritability for both novel measures of maxillary width, both before and after adjustment for age, sex, race, and height (Model 1 in Table S4). Both measures showed heritability close to 50% (maxillary width between second premolar [h2 = 48%, P = 0.001] and maxillary width between first molar [h2 = 47%, P < 0.0001]) and maintained significance after Bonferroni correction. Additional adjustment using BMI in place of height (Model 2 in Table S4) or weight and height (Model 3 in Table S4) did not significantly change the heritability estimates.
Hyoid Distances
Heritability estimates for measurements of hyoid distances are presented in Figure 5 and Table S5 (supplemental material). We demonstrated heritability of the distance from the hyoid bone to the retropogonion in both unadjusted (h2 = 38%, P = 0.0011) and adjusted (h2 = 36%, P = 0.0018) analyses (Model 1 in Table S5). Heritability of hyoid measures has not been shown before. Moreover, we note that both of these estimates met our strict Bonferroni threshold for significance. No significant heritability was observed for other hyoid distance measures. Additional adjustment using BMI in place of height (Model 2 in Table S5) or weight and height (Model 3 in Table S5) had minimal effect on the size and interpretation of heritability estimates; the distance from the hyoid bone to the third cervical vertebrae became nominally significant (P = 0.048) in Model 3.
Craniofacial Heights and Areas
Results assessing the heritability of craniofacial areas and heights are presented in Figure 5 and Table S6 (supplemental material). For measures of craniofacial height, which have previously been examined in cephalometrics,11–13 we observed significant heritability for only lower facial height (LFH). The estimate of heritability for LFH met our Bonferroni corrected level of significance in both unadjusted (h2 = 41%, P = 0.0042) and age, sex, race, and height adjusted (h2 = 33%, P = 0.0058) analyses. For our novel craniofacial area measures, we observed significant heritability at our Bonferroni threshold for the oropharyngeal area both before (h2 = 45%, P = 0.0001) and after (h2 = 36%, P = 0.0018) covariate adjustment. The heritability of the naso-oropharyngeal area was nominally significant in unadjusted models (h2 = 25%, P = 0.017), but not significant after covariate adjustment for age, sex, race, and height (Model 1 in Table S6). The borderline significant heritability of naso-oropharyngeal area is presumably driven by the oropharyngeal area, because it is calculated as the sum of the nasopharyngeal and oropharyngeal areas. In additional models adjusted for BMI in place of height (Model 2 in Table S6) or weight and height (Model 3 in Table S6), the heritability of the oropharyngeal area was nominally significant, but no longer met our Bonferroni corrected level of significance; lower facial height remained significantly heritable.
Intraclass Correlations Comparing Probands and Proband Siblings and Control Subjects and Control Siblings
Table 2 and Table S7 (supplemental material) show the intra-class correlations comparing probands and probands siblings and controls and control siblings independently for craniofacial structures. After adjustment for age, sex, race and height (Model 1 in Table 2), we observed nominally significant differences in family aggregation between probands and controls for lower facial height (P = 0.038), anterior facial height (P = 0.020), and the nasopharyngeal area (P = 0.028). Additional adjustment using BMI in place of height (Model 2 in Table S7) or weight and height (Model 3 in Table S7) did not significantly affect the heritability estimates or interpretation of results. None of these differences remained significant after correction for multiple comparisons. Therefore, our results indicate that family aggregation of these craniofacial structures is similar in normal subjects and in patients with sleep apnea in both unadjusted and adjusted models.
Table 2.
Intraclass correlation coefficients among proband and control pairs separately.

DISCUSSION
This study addressed heritability of craniofacial structures relevant in determining increased risk for OSA. We found that the family aggregation of the craniofacial structures is similar in normal subjects and patients with apnea. We assessed dimensions of craniofacial structures using 3-D MRI. This goes beyond what is possible with cephalometrics, which has been used previously for assessment of heritability of craniofacial structures relevant to OSA5,14 and in families and twins of normal subjects.15–17 We confirmed heritability of the findings from these cephalometric investigations, in particular SNA angles, SNB angles, saddle angles, lower facial height, and mandibular length.11–13 Our study reveals that other relevant measures that could not be detected by cephalometrics are also heritable, specifically the width of the mandible and maxilla. Moreover, we have shown heritability for measures of craniofacial area and distance from the hyoid bone to the retropogonion. Although the craniofacial area and hyoid distance could be measured with cephalometrics, previous studies have not shown that these structures are heritable.
In the current investigation, we have confirmed heritability of craniofacial angles (SNA, SNB, and saddle angle), mandibular body length, lower facial height, and hyoid bone position that have been previously shown in other studies using cephalometrics.5,14–17 However, cephalometry, the lateral radiograph of the skull, is unable to measure the width of maxillary and mandible. Studies have shown that smaller maxillary width and length are risk factors for OSA when compared to controls.39 The current study added new insight into craniofacial heritability in patients with sleep apnea by demonstrating heritability of mandibular and maxillary width. It is not surprising that mandibular width and maxillary width were found to be heritable, because alterations in lateral structures bounding the upper airway (i.e., lateral pharyngeal walls) have been shown to be heritable.19 Moreover, for the first time, we demonstrated that the oropharyngeal area is heritable.
Okubo et al.40 found that a wider mandibular divergence, a shorter mandibular length, and smaller mandibular base plane enclosed area are risk factors for sleep apnea in Japanese men. This finding that the oropharyngeal box showed heritability may be particularly important in the pathogenesis of OSA, because it suggests that the overall space that is available to accommodate upper airway soft tissues is heritable. In fact, it is likely that a combination of upper airway soft- tissue volumes and craniofacial morphology may be heritable and increase the risk for OSA. It has been shown that the area enclosed by mandibular rami at the transverse level immediately inferior to the hard palate and through the soft palate (r = -0.48, P < 0.001) and the distance from the teeth to the posterior mandible line (r = -0.39, P < 0.01) were significantly correlated with the severity of OSA, indicating the balance between the amount of soft tissue and bony enclosure size surrounding the upper airway is important in the pathogenesis of OSA.41 Moreover, a MRI study showed that tongue volume to oral cavity ratio was greater in 20 Japanese men with OSA than in normal controls.42 Using cephalometry, Tsuiki et al.43 demonstrated larger tongue size in patients with OSA compared to controls after matching for maxillomandibular dimensions. Therefore, increased upper airway soft-tissue volumes, in conjunction with a small mandibular enclosure is likely to play a key role in the pathogenesis of OSA.41–44 Genetic and environmental factors may also contribute to the anatomical imbalance. Our goal in this study was not to examine the heritability of the interaction of soft tissue and craniofacial structures, but this is an important endeavor for future studies. The results of the current study also warrant further investigation to identify genes associated with these craniofacial intermediate traits for sleep apnea.
Genes for Craniofacial Structures
In fact, recent studies18,45 have identified genes for craniofacial structure. Larkin and colleagues45 evaluated the role of polymorphisms in 52 candidate genes selected based on potential roles in intermediate pathways for sleep apnea, including craniofacial morphology, ventilatory control, obesity, and inflammation. They hypothesized that these candidate genes were important in the pathogenesis of sleep apnea and could explain the familial aggregation of OSA in European American and African American populations. This candidate gene study identified polymorphisms associated with OSA and the AHI within two genes in European Americans (glial cell-derived neurotrophic factor [GDNF] and C-reactive protein [CRP]) and one gene in African Americans (serotonin receptor 2a [HTR2A]), which suggested a potential pathogenic pathway for OSA.45 However, these genes are unlikely to be related to craniofacial structure and the craniofacial genes that were selected in this study did not show significant associations.41 In a recent GWAS, Liu and colleagues18 identified five independent genetic loci associated with different facial phenotypes in Europeans. Five candidate genes at these loci were positive regulatory domain containing 16 (PRDM16), paired box 3 (PAX3), tumor protein p63 (TP63), chromosome 5 open reading frame 50 (C5orf50), and collagen type XVII, alpha 1 (COL17A1). Data suggest that the PAX3, PRDM16, and transcription factor Tp63 genes are involved in the determination of the morphology of the human face.18 The data examining these candidate genes (PAX3, PRDM16, and transcription factor Tp63) provide compelling evidence that gene variants are involved in mediating craniofacial morphology.46–55
Potential Limitations
There are some potential limitations in the current study. We had more Caucasian males than African American male with apnea. Conversely, there were fewer Caucasian females than African American females with apnea. However, to account for this, cases, controls and their siblings were exactly matched by sex and ethnicity. Therefore, the overall differences between groups were unbiased with respect to ethnicity and sex. Measurement error could also have been a potential problem in this study. However, we followed identical protocols and used the same MRI unit and analysis software to make our upper airway craniofacial measurements for all groups. We had also assessed the reliability of our measurements and, as previously described, we found that the intra-reader correlation was very high (0.98–0.99) and interreader measurement variance between readers was extremely low (0.02–0.53%).21 The high precision of our MRI measurements of craniofacial structures were also demonstrated in our previous study.21 Finally, to correct for multiple testing, we used a stringent and conservative multiple testing correction (Bonferroni correction) within the different craniofacial domains.
In conclusion, our study, using MRI to examine craniofacial structure in patients with sleep apnea, their siblings, and in matched controls and their siblings, has advanced our knowledge of heritability of craniofacial risk factors for sleep apnea. We confirmed previous findings from two-dimensional cephalometric studies, but also showed that the mandibular and maxillary width and the size of the oropharyngeal space were heritable. Thus, the overall space that is available to accommodate upper airway soft tissues is heritable. This is likely to be a very important finding for understanding the craniofacial genetic contribution to sleep apnea.
DISCLOSURE STATEMENT
This was not an industry supported study. This study was supported by grants from the National Institutes of Health (R01HL089447, P01HL094307, HL042236). The authors have indicated no financial conflicts of interest.
ACKNOWLEDGMENTS
The authors are grateful to Bethany Staley for conducting the sleep studies, Frances M. Pack for subject recruitment, and Dana Concio, Elizabeth B. Kneeland, Daniel C. Barrett, and Annette Fedson for assistance in manuscript preparation.
SUPPLEMENTAL MATERIAL
METHODS
Subjects
Patients (probands) with newly diagnosed obstructive sleep apnea (OSA) were recruited from the Penn Sleep Center out-patient practice.1 Because continuous positive airway pressure (CPAP) has the potential to alter upper airway tissue properties, patients already using CPAP therapy were excluded from the study. Local advertisements were used to recruit control subjects living in the same school district of the matched pro-bands. Controls and probands were matched by ethnicity and sex and within 5 y of age. Controls found to have symptoms of sleep apnea and an apnea hypopnea index greater than 15 events/h were recategorized as probands. Controls with apnea hypopnea indices between 5 and 15 events/h were excluded from the study. Subjects were compensated $100.00 for the polysomnography and $100.00 for the magnetic resonance imaging (MRI). To prevent intentional weight loss after knowing the diagnosis of OSA, the MRI was performed within 1 w of the sleep study. We were unable to determine the duration of the newly diagnosed apnea in the probands. The study was as approved by the University of Pennsylvania Institutional Review Board, and written informed consent was obtained from all subjects. Exclusionary criteria included: (1) age younger than 18 y; (2) subjects chronically taking medications that affected upper airway caliber (i.e., sedatives or benzodiazepines); and (3) MRI exclusions: specifically: (a) body weight > 136 kg (table limit of the magnetic resonance scanner); (b) presence of metallic implants (pacemaker), ferromagnetic clips, etc.; or (c) severe claustrophobia.
Polysomnography
As previously described from our laboratory,2,3 standard polysomnography operating procedures and scoring were performed in the Penn Center for Sleep Disorders using a computerized polysomnography system (Sandman, Mellville Diagnostics, Ottawa, Ontario, Canada). Controls, siblings of controls, and siblings of probands underwent a full-night polysomnography. Probands with an apnea-hypopnea index (AHI) > 15 events/h initially had a clinical sleep study. If the clinical sleep study was a split night study (diagnostic study in the first half of the night and CPAP in the second half of the night), the probands then underwent a repeat full-night diagnostic sleep study before starting CPAP to determine the AHI in a comparable way to the sleep studies of the rest of the subjects. Polysomnograms were scored by a registered polysomnographic technologist and interpreted by a certified sleep physicians using the standard criteria of Rechtschaffen and Kales4 and the more recently proposed criteria of the American Academy of Sleep Medicine.5 Obstructive apneas were defined as airflow cessation for more than 10 sec; hypopneas were defined as a 50% reduction in airflow for more than 10 sec and associated with > than 3% decrement in oxyhemoglobin saturation and/or an arousal. Nasal pressure monitors were used in all subjects to measure airflow.
In addition to AHI, sleep efficiency, total sleep minutes, arousal index, min in nonrapid eye movement (NREM) (stages 1–4) and rapid eye movement (REM) sleep and latency to REM sleep were assessed. Snoring was noted but not quantified.
Magnetic Resonance Analysis
The technicians who performed the magnetic resonance analysis were not blinded to the name of the subject but they were blinded to the results of the sleep study.
Statistical Analysis
Comparisons of demographic variables among groups were assessed using a mixed-model analysis of variance (ANOVA), controlling for correlation within quads. Family aggregation of the craniofacial structures was assessed with two analysis strategies (see Figure 1). The first analytic approach used an analogous mixed-model ANOVA but focused on the variance components in order to quantify the degree of heritability for each measurement. In the second analytical approach, we estimated intraclass correlations for the craniofacial measurements independently for probands/proband siblings and controls/control siblings der to determine if the heritability of the craniofacial structures is different in normals than in individuals with apnea.
RESULTS
Polysomnography
Sleep efficiency and the amount of time spent in stage 1, stage 2 were not significantly different (see Table 1) between the subject groups. However, the amount of REM sleep and the total amount of NREM sleep were significantly different across the groups with the least amount of REM sleep occurring in patients with OSA. The arousal frequency was also significantly different across groups. Patients with OSA manifested the greatest number of arousals. The proband siblings had the second largest number of arousals.
Mean comparison of craniofacial structures among quad patient groups.
Heritability estimates for craniofacial angles.
Within-quad group adjusted mean and 95% confidence interval for craniofacial measures with significant among group differences. The least square means and associated 95% confidence interval after adjustment for age, sex, race, and height are shown for each craniofacial measure that showed a significant difference (P < 0.05) among groups in our mixed model analysis of variance. Estimates are given for each quad group separately (proband, proband sib, control, and control sib). Six of the eight measures (length ramus, ACB to horizontal plane angle, and hyoid distances) had between group differences that were consistent with being OSA risk factors. ACB, anterior cranial base; ANOVA, analysis of variance; C3, third cervical vertebrae.
Heritability estimates for mandibular measurements.
Heritability estimates for maxillary measurements.
Heritability estimates for hyoid distances.
Heritability estimates for craniofacial heights and areas.
Intraclass correlation coefficients among proband and control pairs separately.
REFERENCES
- 1.Schwab RJ, Pack AI, Gupta KB, et al. Upper airway and soft tissue structural changes induced by CPAP in normal subjects. Am J Respir Crit Care Med. 1996;154:1106–16. doi: 10.1164/ajrccm.154.4.8887615. [DOI] [PubMed] [Google Scholar]
- 2.Schwab RJ, Gupta KB, Gefter WB, Metzger LJ, Hoffman EA, Pack AI. Upper airway and soft tissue anatomy in normal subjects and patients with sleep-disordered breathing. Significance of the lateral pharyngeal walls. Am J Respir Crit Care Med. 1995;152:1673–89. doi: 10.1164/ajrccm.152.5.7582313. [DOI] [PubMed] [Google Scholar]
- 3.Welch KC, Foster GD, Ritter CT, et al. A novel volumetric magnetic resonance imaging paradigm to study upper airway anatomy. Sleep. 2002;25:532–42. [PubMed] [Google Scholar]
- 4.Rechtschaffen A, Kales A, editors. Los Angeles: Brain Information Service/Brain Research Institute, University of California; 1968. A manual of standardized terminology: techniques and scoring system for sleep stages of human subjects. [Google Scholar]
- 5.Sleep-related breathing disorders in adults: recommendations for syndrome definition and measurement techniques in clinical research. The Report of an American Academy of Sleep Medicine Task Force. Sleep. 1999;22:667–89. [PubMed] [Google Scholar]
REFERENCES
- 1.Young T, Palta M, Dempsey J, Skatrud J, Weber S, Badr S. The occurrence of sleep-disordered breathing among middle-aged adults. N Engl J Med. 1993;328:1230–5. doi: 10.1056/NEJM199304293281704. [DOI] [PubMed] [Google Scholar]
- 2.Tufik S, Santos-Silva R, Taddei JA, Bittencourt LR. Obstructive sleep apnea syndrome in the Sao Paulo Epidemiologic Sleep Study. Sleep Med. 2010;11:441–6. doi: 10.1016/j.sleep.2009.10.005. [DOI] [PubMed] [Google Scholar]
- 3.Carmelli D, Colrain IM, Swan GE, Bliwise DL. Genetic and environmental influences in sleep-disordered breathing in older male twins. Sleep. 2004;27:917–22. doi: 10.1093/sleep/27.5.917. [DOI] [PubMed] [Google Scholar]
- 4.Gislason T, Johannsson JH, Haraldsson A, et al. Familial predisposition and cosegregation analysis of adult obstructive sleep apnea and the sudden infant death syndrome. Am J Respir Crit Care Med. 2002;166:833–8. doi: 10.1164/rccm.2107121. [DOI] [PubMed] [Google Scholar]
- 5.Mathur R, Douglas NJ. Family studies in patients with the sleep apneahypopnea syndrome. Ann Intern Med. 1995;122:174–8. doi: 10.7326/0003-4819-122-3-199502010-00003. [DOI] [PubMed] [Google Scholar]
- 6.Palmer LJ, Buxbaum SG, Larkin E, et al. A whole-genome scan for obstructive sleep apnea and obesity. Am J Hum Genet. 2003;72:340–50. doi: 10.1086/346064. [DOI] [PMC free article] [PubMed] [Google Scholar]
- 7.Palmer LJ, Buxbaum SG, Larkin EK, et al. Whole genome scan for obstructive sleep apnea and obesity in African-American families. Am J Respir Crit Care Med. 2004;169:1314–21. doi: 10.1164/rccm.200304-493OC. [DOI] [PubMed] [Google Scholar]
- 8.Pillar G, Lavie P. Assessment of the role of inheritance in sleep apnea syndrome. Am J Respir Crit Care Med. 1995;151:688–91. doi: 10.1164/ajrccm/151.3_Pt_1.688. [DOI] [PubMed] [Google Scholar]
- 9.Redline S, Tishler PV, Tosteson TD, et al. The familial aggregation of obstructive sleep apnea. Am J Respir Crit Care Med. 1995;151:682–7. doi: 10.1164/ajrccm/151.3_Pt_1.682. [DOI] [PubMed] [Google Scholar]
- 10.Driessen C, Joosten KF, Bannink N, et al. How does obstructive sleep apnoea evolve in syndromic craniosynostosis? A prospective cohort study. Arch Dis Child. 2013;98:538–43. doi: 10.1136/archdischild-2012-302745. [DOI] [PubMed] [Google Scholar]
- 11.Rachmiel A, Emodi O, Aizenbud D. Management of obstructive sleep apnea in pediatric craniofacial anomalies. Ann Maxillofac Surg. 2012;2:111–5. doi: 10.4103/2231-0746.101329. [DOI] [PMC free article] [PubMed] [Google Scholar]
- 12.Marcus CL, Keens TG, Bautista DB, von Pechmann WS, Ward SL. Obstructive sleep apnea in children with Down syndrome. Pediatrics. 1991;88:132–9. [PubMed] [Google Scholar]
- 13.Onodera K, Niikuni N, Chigono T, Nakajima I, Sakata H, Motizuki H. Sleep disordered breathing in children with achondroplasia. Part 2. Relationship with craniofacial and airway morphology. Int J Pediatr Otorhinolaryngol. 2006;70:453–61. doi: 10.1016/j.ijporl.2005.07.016. [DOI] [PubMed] [Google Scholar]
- 14.Guilleminault C, Partinen M, Hollman K, Powell N, Stoohs R. Familial aggregates in obstructive sleep apnea syndrome. Chest. 1995;107:1545–51. doi: 10.1378/chest.107.6.1545. [DOI] [PubMed] [Google Scholar]
- 15.Johannsdottir B, Thorarinsson F, Thordarson A, Magnusson TE. Heritability of craniofacial characteristics between parents and offspring estimated from lateral cephalograms. Am J Orthod Dentofacial Orthop. 2005;127:200–7. doi: 10.1016/j.ajodo.2004.07.033. quiz 60–1. [DOI] [PubMed] [Google Scholar]
- 16.King L, Harris EF, Tolley EA. Heritability of cephalometric and occlusal variables as assessed from siblings with overt malocclusions. Am J Orthod Dentofacial Orthop. 1993;104:121–31. doi: 10.1016/S0889-5406(05)81001-7. [DOI] [PubMed] [Google Scholar]
- 17.Savoye I, Loos R, Carels C, Derom C, Vlietinck R. A genetic study of anteroposterior and vertical facial proportions using model-fitting. Angle Orthod. 1998;68:467–70. doi: 10.1043/0003-3219(1998)068<0467:AGSOAA>2.3.CO;2. [DOI] [PubMed] [Google Scholar]
- 18.Liu F, van der Lijn F, Schurmann C, et al. A genome-wide association study identifies five loci influencing facial morphology in Europeans. PLoS Genet. 2012;8:e1002932. doi: 10.1371/journal.pgen.1002932. [DOI] [PMC free article] [PubMed] [Google Scholar]
- 19.Schwab RJ, Pasirstein M, Kaplan L, et al. Family aggregation of upper airway soft tissue structures in normal subjects and patients with sleep apnea. Am J Respir Crit Care Med. 2006;173:453–63. doi: 10.1164/rccm.200412-1736OC. [DOI] [PMC free article] [PubMed] [Google Scholar]
- 20.Schwab RJ, Pasirstein M, Pierson R, et al. Identification of upper airway anatomic risk factors for obstructive sleep apnea with volumetric MRI. Am J Respir Crit Care Med. 2003;168:522–30. doi: 10.1164/rccm.200208-866OC. [DOI] [PubMed] [Google Scholar]
- 21.Chi L, Comyn FL, Mitra N, et al. Identification of craniofacial risk factors for obstructive sleep apnoea using three-dimensional MRI. Eur Respir J. 2011;38:348–58. doi: 10.1183/09031936.00119210. [DOI] [PMC free article] [PubMed] [Google Scholar]
- 22.Guilleminault C, Riley R, Powell N. Obstructive sleep apnea and abnormal cephalometric measurements. Implications for treatment. Chest. 1984;86:793–4. doi: 10.1378/chest.86.5.793. [DOI] [PubMed] [Google Scholar]
- 23.Lowe AA, Santamaria JD, Fleetham JA, Price C. Facial morphology and obstructive sleep apnea. Am J Orthod Dentofacial Orthop. 1986;90:484–91. doi: 10.1016/0889-5406(86)90108-3. [DOI] [PubMed] [Google Scholar]
- 24.Lyberg T, Krogstad O, Djupesland G. Cephalometric analysis in patients with obstructive sleep apnoea syndrome. I. Skeletal morphology. J Laryngol Otol. 1989;103:287–92. doi: 10.1017/s0022215100108734. [DOI] [PubMed] [Google Scholar]
- 25.Miles PG, Vig PS, Weyant RJ, Forrest TD, Rockette HE. Craniofacial structure and obstructive sleep apnea syndrome—a qualitative analysis and meta-analysis of the literature. Am J Orthod Dentofacial Orthop. 1996:163–72. doi: 10.1016/s0889-5406(96)70177-4. [DOI] [PubMed] [Google Scholar]
- 26.Rechtschaffen A, Kales A, editors. Los Angeles: Brain Information Service/Brain Research Institute, University of California; 1968. A manual of standardized terminology: techniques and scoring system for sleep stages of human subjects. [Google Scholar]
- 27.Krishan K. Estimation of stature from cephalo-facial anthropometry in north Indian population. Forensic Sci Int. 2008;181:52, e1–6. doi: 10.1016/j.forsciint.2008.08.001. [DOI] [PubMed] [Google Scholar]
- 28.Patil KR, Mody RN. Determination of sex by discriminant function analysis and stature by regression analysis: a lateral cephalometric study. Forensic Sci Int. 2005;147:175–80. doi: 10.1016/j.forsciint.2004.09.071. [DOI] [PubMed] [Google Scholar]
- 29.Silventoinen K, Sammalisto S, Perola M, et al. Heritability of adult body height: a comparative study of twin cohorts in eight countries. Twin Res. 2003;6:399–408. doi: 10.1375/136905203770326402. [DOI] [PubMed] [Google Scholar]
- 30.Perola M, Sammalisto S, Hiekkalinna T, et al. Combined genome scans for body stature in 6,602 European twins: evidence for common Caucasian loci. PLoS Genet. 2007;3:e97. doi: 10.1371/journal.pgen.0030097. [DOI] [PMC free article] [PubMed] [Google Scholar]
- 31.Soranzo N, Rivadeneira F, Chinappen-Horsley U, et al. Meta-analysis of genome-wide scans for human adult stature identifies novel Loci and associations with measures of skeletal frame size. PLoS Genet. 2009;5:e1000445. doi: 10.1371/journal.pgen.1000445. [DOI] [PMC free article] [PubMed] [Google Scholar]
- 32.Weedon MN, Lettre G, Freathy RM, et al. A common variant of HMGA2 is associated with adult and childhood height in the general population. Nat Genet. 2007;39:1245–50. doi: 10.1038/ng2121. [DOI] [PMC free article] [PubMed] [Google Scholar]
- 33.Sanna S, Jackson AU, Nagaraja R, et al. Common variants in the GDF5-UQCC region are associated with variation in human height. Nat Genet. 2008;40:198–203. doi: 10.1038/ng.74. [DOI] [PMC free article] [PubMed] [Google Scholar]
- 34.Weedon MN, Lango H, Lindgren CM, et al. Genome-wide association analysis identifies 20 loci that influence adult height. Nat Genet. 2008;40:575–83. doi: 10.1038/ng.121. [DOI] [PMC free article] [PubMed] [Google Scholar]
- 35.Gudbjartsson DF, Walters GB, Thorleifsson G, et al. Many sequence variants affecting diversity of adult human height. Nat Genet. 2008;40:609–15. doi: 10.1038/ng.122. [DOI] [PubMed] [Google Scholar]
- 36.Lettre G, Jackson AU, Gieger C, et al. Identification of ten loci associated with height highlights new biological pathways in human growth. Nat Genet. 2008;40:584–91. doi: 10.1038/ng.125. [DOI] [PMC free article] [PubMed] [Google Scholar]
- 37.Chiba M, Terazawa K. Estimation of stature from somatometry of skull. Forensic Sci Int. 1998;97:87–92. doi: 10.1016/s0379-0738(98)00145-5. [DOI] [PubMed] [Google Scholar]
- 38.Guilleminault C, Stoohs R, Kim YD, Chervin R, Black J, Clerk A. Upper airway sleep-disordered breathing in women. Ann Intern Med. 1995;122:493–501. doi: 10.7326/0003-4819-122-7-199504010-00003. [DOI] [PubMed] [Google Scholar]
- 39.Seto BH, Gotsopoulos H, Sims MR, Cistulli PA. Maxillary morphology in obstructive sleep apnoea syndrome. Eur J Orthod. 2001;23:703–14. doi: 10.1093/ejo/23.6.703. [DOI] [PubMed] [Google Scholar]
- 40.Okubo M, Suzuki M, Horiuchi A, et al. Morphologic analyses of mandible and upper airway soft tissue by MRI of patients with obstructive sleep apnea hypopnea syndrome. Sleep. 2006;29:909–15. doi: 10.1093/sleep/29.7.909. [DOI] [PubMed] [Google Scholar]
- 41.Shelton KE, Gay SB, Hollowell DE, Woodson H, Suratt PM. Mandible enclosure of upper airway and weight in obstructive sleep apnea. Am Rev Respir Dis. 1993;148:195–200. doi: 10.1164/ajrccm/148.1.195. [DOI] [PubMed] [Google Scholar]
- 42.Iida-Kondo C, Yoshino N, Kurabayashi T, Mataki S, Hasegawa M, Kurosaki N. Comparison of tongue volume/oral cavity volume ratio between obstructive sleep apnea syndrome patients and normal adults using magnetic resonance imaging. J Med Dent Sci. 2006;53:119–26. [PubMed] [Google Scholar]
- 43.Tsuiki S, Isono S, Ishikawa T, Yamashiro Y, Tatsumi K, Nishino T. Anatomical balance of the upper airway and obstructive sleep apnea. Anesthesiology. 2008;108:1009–15. doi: 10.1097/ALN.0b013e318173f103. [DOI] [PubMed] [Google Scholar]
- 44.Sutherland K, Lee RW, Cistulli PA. Obesity and craniofacial structure as risk factors for obstructive sleep apnoea: impact of ethnicity. Respirology. 2012;17:213–22. doi: 10.1111/j.1440-1843.2011.02082.x. [DOI] [PubMed] [Google Scholar]
- 45.Larkin EK, Patel SR, Goodloe RJ, et al. A candidate gene study of obstructive sleep apnea in European Americans and African Americans. Am J Respir Crit Care Med. 2010;182:947–53. doi: 10.1164/rccm.201002-0192OC. [DOI] [PMC free article] [PubMed] [Google Scholar]
- 46.Wu M, Li J, Engleka KA, et al. Persistent expression of Pax3 in the neural crest causes cleft palate and defective osteogenesis in mice. J Clin Invest. 2008;118:2076–87. doi: 10.1172/JCI33715. [DOI] [PMC free article] [PubMed] [Google Scholar]
- 47.Pingault V, Ente D, Dastot-Le Moal F, Goossens M, Marlin S, Bondurand N. Review and update of mutations causing Waardenburg syndrome. Hum Mutat. 2010;31:391–406. doi: 10.1002/humu.21211. [DOI] [PubMed] [Google Scholar]
- 48.Paternoster L, Zhurov AI, Toma AM, et al. Genome-wide association study of three-dimensional facial morphology identifies a variant in PAX3 associated with nasion position. Am J Hum Genet. 2012;90:478–85. doi: 10.1016/j.ajhg.2011.12.021. [DOI] [PMC free article] [PubMed] [Google Scholar]
- 49.Bjork BC, Turbe-Doan A, Prysak M, Herron BJ, Beier DR. Prdm16 is required for normal palatogenesis in mice. Hum Mol Genet. 2010;19:774–89. doi: 10.1093/hmg/ddp543. [DOI] [PMC free article] [PubMed] [Google Scholar]
- 50.Horn KH, Warner DR, Pisano M, Greene RM. PRDM16 expression in the developing mouse embryo. Acta Histochem. 2011;113:150–5. doi: 10.1016/j.acthis.2009.09.006. [DOI] [PMC free article] [PubMed] [Google Scholar]
- 51.Warner DR, Horn KH, Mudd L, Webb CL, Greene RM, Pisano MM. PRDM16/MEL1: a novel Smad binding protein expressed in murine embryonic orofacial tissue. Biochim Biophys Acta. 2007;1773:814–20. doi: 10.1016/j.bbamcr.2007.03.016. [DOI] [PubMed] [Google Scholar]
- 52.Rinne T, Brunner HG, van Bokhoven H. p63-associated disorders. Cell Cycle. 2007;6:262–8. doi: 10.4161/cc.6.3.3796. [DOI] [PubMed] [Google Scholar]
- 53.Leoyklang P, Siriwan P, Shotelersuk V. A mutation of the p63 gene in nonsyndromic cleft lip. J Med Genet. 2006;43:e28. doi: 10.1136/jmg.2005.036442. [DOI] [PMC free article] [PubMed] [Google Scholar]
- 54.Thomason HA, Dixon MJ, Dixon J. Facial clefting in Tp63 deficient mice results from altered Bmp4, Fgf8 and Shh signaling. Dev Biol. 2008;321:273–82. doi: 10.1016/j.ydbio.2008.06.030. [DOI] [PubMed] [Google Scholar]
- 55.Robison JG, Otteson TD. Increased prevalence of obstructive sleep apnea in patients with cleft palate. Arch Otolaryngol Head Neck Surg. 2011;137:269–74. doi: 10.1001/archoto.2011.8. [DOI] [PubMed] [Google Scholar]
Associated Data
This section collects any data citations, data availability statements, or supplementary materials included in this article.
Supplementary Materials
Mean comparison of craniofacial structures among quad patient groups.
Heritability estimates for craniofacial angles.
Within-quad group adjusted mean and 95% confidence interval for craniofacial measures with significant among group differences. The least square means and associated 95% confidence interval after adjustment for age, sex, race, and height are shown for each craniofacial measure that showed a significant difference (P < 0.05) among groups in our mixed model analysis of variance. Estimates are given for each quad group separately (proband, proband sib, control, and control sib). Six of the eight measures (length ramus, ACB to horizontal plane angle, and hyoid distances) had between group differences that were consistent with being OSA risk factors. ACB, anterior cranial base; ANOVA, analysis of variance; C3, third cervical vertebrae.
Heritability estimates for mandibular measurements.
Heritability estimates for maxillary measurements.
Heritability estimates for hyoid distances.
Heritability estimates for craniofacial heights and areas.
Intraclass correlation coefficients among proband and control pairs separately.