Abstract
BACKGROUND:
Disease monitoring of viruses using real-time polymerase chain reaction (PCR) requires knowledge of the precision of the test to determine what constitutes a significant change. Calculation of quantitative PCR confidence limits requires bivariate statistical methods.
OBJECTIVE:
To develop a simple-to-use graphical user interface to determine the uncertainty of measurement (UOM) of BK virus, cytomegalovirus (CMV) and Epstein-Barr virus (EBV) real-time PCR assays.
METHODS:
Thirty positive clinical samples for each of the three viral assays were repeated once. A graphical user interface was developed using a spreadsheet (Excel, Microsoft Corporation, USA) to enable data entry and calculation of the UOM (according to Fieller’s theorem) and PCR efficiency.
RESULTS:
The confidence limits for the BK virus, CMV and EBV tests were ∼0.5 log, 0.5 log to 1.0 log, and 0.5 log to 1.0 log, respectively. The efficiencies of these assays, in the same order were 105%, 119% and 90%. The confidence limits remained stable over the linear range of all three tests.
DISCUSSION:
A >5 fold (0.7 log) and a >3-fold (0.5 log) change in viral load were significant for CMV and EBV when the results were ≤1000 copies/mL and >1000 copies/mL, respectively. A >3-fold (0.5 log) change in viral load was significant for BK virus over its entire linear range. PCR efficiency was ideal for BK virus and EBV but not CMV. Standardized international reference materials and shared reporting of UOM among laboratories are required for the development of treatment guidelines for BK virus, CMV and EBV in the context of changes in viral load.
Keywords: BK virus, CMV, EBV, Graphical user interface, Quantitative real-time PCR, Uncertainty of measurement
Abstract
HISTORIQUE :
Pour surveiller les virus au moyen de la réaction en chaîne de la polymérase (PCR) en temps réel, il faut connaître la précision du test pour déterminer ce qui constitue un changement important. Il faut des méthodes statistiques bivariées pour calculer les limites de confiance de la PCR quantitative.
OBJECTIF :
Élaborer une interface utilisateur graphique facile à utiliser pour déterminer l’incertitude des mesures (IDM) du virus BK, du cytomégalovirus (CMV) et du virus d’Epstein-Barr (VEB) par PCR en temps réel.
MÉTHODOLOGIE :
Trente échantillons cliniques positifs de cha-cune des analyses virales ont été répétés une fois. Une interface utilisateur graphique a été élaborée au moyen d’un chiffrier (Excel, Microsoft Corporation, États-Unis) pour saisir les données et calculer l’IDM (selon le théorème de Fieller) et l’efficacité de la PCR.
RÉSULTATS :
Les limites de confiance des tests du virus BK, du CMV et du VEB étaient de ∼0,5 log, 0,5 log à 1,0 log, et 0,5 log à 1,0 log, respectivement. L’efficacité de ces analyses était de 105 %, de 119 % et de 90 %, respectivement. Les limites de confiance sont demeurées stables pendant la trajectoire linéaire de ces trois tests.
EXPOSÉ :
Un changement de la charge virale plus de cinq fois plus élevé (0,7 log) et plus de trois fois plus élevé (0,5 log) était important pour le CMV et le VEB lorsque les résultats étaient d’un maximum de 1 000 copies/mL et de plus de 1 000 copies/mL, respectivement. Un changement de la charge virale plus de trois fois élevé (0,5 log) était important pour toute la trajectoire linéaire du virus BK. La PCR avait une efficacité idéale pour le virus BK et le VEB, mais pas pour le CMV. Il faudra élaborer des normes de référence internationales standardisées et partager les signalements d’IDM entre laboratoires pour préparer des directives thérapeutiques relatives au virus BK, au CMV et au VEB dans le contexte des changements de la charge virale
Real-time polymerase chain reaction (PCR) is widely used in clinical laboratories for the detection and quantification of various micro-biological analytes. The technology uses fluorescent probes to detect products as they accumulate during progressive thermocycling. When a defined level of fluorescence is achieved, the cycle number is termed the threshold cycle (Ct) which, in turn, is proportional to the starting concentration of the target. Standardized curves are prepared by amplifying known concentrations of the target and plotting these against their Ct values. Finally, inverse regression is used to determine the unknown DNA/RNA concentration. Because the technique uses two quantitative components (the target concentration and the Ct value), bivariate statistical methods are needed to estimate the CI. Fieller’s theorem represents one such appropriate method (1).
The slope of the standardized curve of target concentration versus Ct value can be used to determine PCR efficiency according to the following equation:
in which Ex= PCR efficiency (%) and m = slope of standardized curve (amplicon concentration versus Ct value).
Ideal efficiency is defined as a doubling of the amplicon concentration with each PCR cycle (100%). Poor amplification efficiency may reflect several potential causes including the presence of inhibitors, amplicon size and suboptimal primer design. Efficiencies >100% can also occur; potential causes include primer-dimer formation, suboptimal serial dilutions or operator error.
Physicians follow viral load data to guide their treatment decisions in infectious diseases such as HIV, hepatitis C, BK virus, cytomegalovirus (CMV) and Epstein-Barr virus (EBV). Knowledge of what constitutes a significant change in viral load is not possible without some insight into the confidence boundaries of the test. Uncertainty of measurement (UOM) is an essential element of a laboratory’s quality system and has become a requirement of various licensing bodies including Ontario Laboratory Accreditation and ISO 15189 (2). ISO 15189, 5.6.2 requires that “The laboratory shall determine the uncertainty of results, where relevant and possible” (2). This is easily accomplished when a normal value for the measurand and standardized reference materials exist (such as for serum sodium in a biochemistry laboratory). However, it becomes problematic in the virology laboratory when a ‘normal’ value cannot be established because viral concentrations occur over a range of values that usually correspond to illness severity. Also, standardized reference materials from third-party suppliers are either nonexistent or prohibitively expensive.
Replicate analysis is a conventional method for determining uncertainty bounds in bacterial plate counts (3). When it is applied to real-time PCR, positive patient samples are re-run in various configurations. Within- and between-run replicates are used to determine intra- and inter-run variability, respectively. Test repeatability (precision) can be used to compare equipment platforms, kit manufacturers and operators.
Most microbiologists in clinical laboratories would concede that they are not well versed in advanced statistics. This is probably also true for laboratory technologists who are often responsible for the day-to-day implementation of quality assurance initiatives. The complexity of bivariate analysis precludes manual calculations for all but the simplest data sets. An algorithm that is simple to use and interpret is required for the determination of UOM. Because most real-time PCR platforms do not automatically calculate UOM, it is convenient to have a user-friendly graphical user interface (GUI) that permits data entry and the calculation of UOM. The objective of the present study was to create and implement a GUI for the determination of UOM for CMV, EBV and BK virus real-time PCR assays using replicate analysis and Fieller’s theorem.
METHODS
All real-time PCR in the present study was performed on the Roche LightCycler (Roche Diagnostics, USA). The Artus CMV LC PCR kit (Qiagen, Germany), Roche LightCycler EBV Quantification kit and Altona Real Star BK PCR kit 1.2 (Altona Diagnostics, Germany) were used for the real-time PCR of CMV, EBV and BK virus samples, respectively. For these three viruses, multiple kits with varying lot numbers were used. Each of these assays was Food and Drug Administration, Health Canada or CE approved and was performed according to the manufacturers’ instructions.
Thirty positive clinical samples for each of CMV, EBV and BK virus that were sent for routine testing were re-extracted and re-assayed once, in subsequent runs.
Samples were primarily obtained from pediatric and adult solid organ and hematopoetic stem-cell transplant patients. Repeat samples from the same patient were excluded from the study. All samples for all assays were plasma (centrifuged from whole blood EDTA tubes within 4 h of collection and stored frozen at −80°C before extraction).
A GUI (Figure 1) was developed using a spreadsheet (Excel, Microsoft Corporation, USA) to permit manual data entry of each sample’s accession number, and its corresponding first and second replicate Ct and concentration values. The GUI performed uncertainty calculations at the 95% confidence limit according to Fieller’s method as previously described by Verderio et al (1). The GUI automatically adjusted the t statistic used in the calculation as the sample size changed. In addition, PCR efficiency was calculated using methods described by Verderio et al (1).
Figure 1).
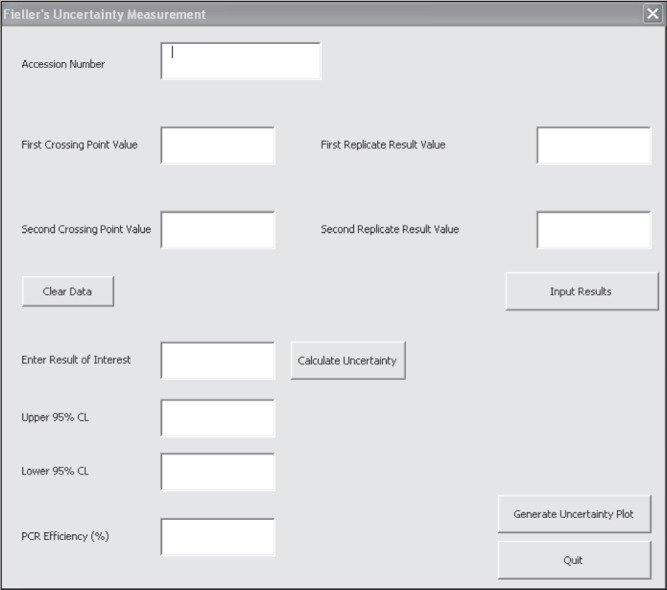
Graphical user interface used for data entry and calculation of uncertainty of measurement and polymerase chain reaction (PCR) efficiency
Log-log plots of error versus result and semi-log plots of Ct versus result were updated automatically by the GUI for each of the three viral assays. PCR efficiency and the upper and lower 95% confidence bounds for a result of 1000 copies/mL were computed for all three assays using the GUI.
RESULTS
Log-log plots of error versus result and semi-log plots of Ct versus result for BK virus, CMV and EBV are shown in Figures 2 to 7. On inspection, all three assays’ confidence limits displayed relatively linear (parallel) characteristics over the entire range of input virus concentrations.
Figure 2).
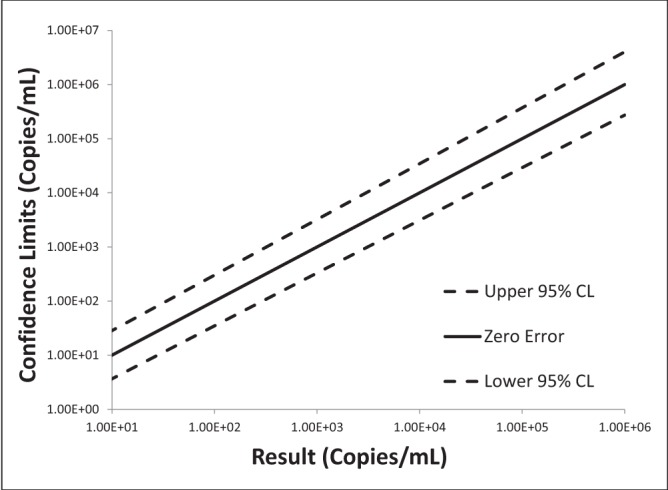
Log-log plot of error versus result for BK virus real-time polymerase chain reaction replicate uncertainty of measurement analysis for 30 unique (one sample per patient) transplant patient samples
Figure 7).
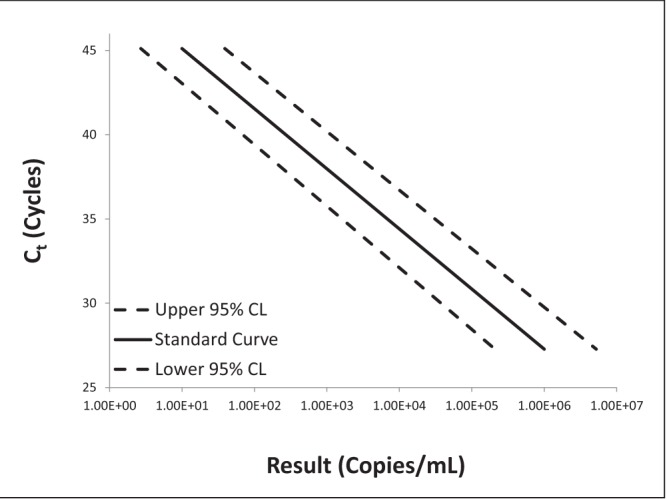
Semi-log plot of threshold cycle (Ct) versus result for Epstein-Barr virus real-time polymerase chain reaction replicate uncertainty of measurement analysis for 30 unique (one sample per patient) transplant patient samples
The 95% upper and lower confidence bounds corresponding to an input concentration of 1000 copies/mL and PCR efficiencies are presented in Table 1. The BK virus test exhibited the best performance characteristics for both confidence limits – approximately threefold (0.5 log) difference from the mean and efficiency (105%). Efficiencies for CMV and EBV were 119% and 90%, respectively. Both of these assays had confidence bounds that were between threefold (0.5 log) and 10-fold (1.0 log).
TABLE 1.
95% confidence limits (CL) according to Fieller’s theorem and polymerase chain reaction (PCR) efficiency for three viral real-time PCR assays for a result of 1000 copies/mL
| Viral assay | Upper 95% CL* | Lower 95% CL* | Efficiency |
|---|---|---|---|
| BK virus | 3.2-fold (0.51 log) | 3.0-fold (0.48 log) | 105% |
| CMV | 6.4-fold (0.81 log) | 5.6-fold (0.75 log) | 119% |
| EBV | 4.3-fold (0.64 log) | 4.1-fold (0.61 log) | 90% |
Confidence limits are reported as multipliers/divisors of the mean and in absolute log differences. CMV Cytomegalovirus; EBV Epstein-Barr virus
DISCUSSION
Viral load monitoring using quantitative PCR has become an essential element of patient care. Guidelines for HIV and hepatitis C monitoring are well established in which a 0.5 log or a 1 log change is considered to be significant, depending on the clinical situation (4,5). Standardized international reference materials are available for both of these assays. A WHO reference standard became available for CMV in 2010 and interlaboratory comparison is possible by reporting in international units per mL (IU/mL) (6); none currently exist for BK virus and EBV. However, commercial products (Acrometrix, Zeptometrix, Advanced Biotechnologies Inc, USA) and the ATCC’s Namalwa Burkitt lymphoma cell line (containing two integrated EBV genomes per cell) may be helpful in standardizing EBV assays (7).
Although standardized reference material is desirable for PCR optimization and interlaboratory comparison, it may not be reflective of the entire diagnostic cycle and, thus, may overstate test repeatability. Reference standards require a matrix that ensures the stability of the target over time. Variability in sample type, collection and storage would all be expected to contribute to the precision of an assay. The use of actual clinical samples in the present study likely provides a better estimate of UOM, somewhat analogous to an intent-to-treat analysis.
There are no recognized criteria for BK, CMV and EBV for the determination of what constitutes a significant change in the viral load. Kraft et al (6) suggested that a >5 fold (0.7 log) and a >3-fold (0.5 log) difference are significant for CMV viral loads that are ≤1000 copies/mL and >1000 copies/mL, respectively. These criteria would probably work well for the CMV and EBV tests performed in the present study, especially if the efficiency of our PCRs can be optimized (Table 1). Given the tighter confidence limits of the BK virus test, a >3-fold (0.5 log) change is significant over its entire linear range.
Collecting a sufficient number of samples for our study was challenging. The selection of a 30-sample threshold per assay was based on the central limit theorem, which states that a normal distribution is generally achieved when sample sizes meet or exceed 30 (8). The t statistic at the 95% confidence level for 30 samples is only marginally different than that for infinite samples (2.042 versus 1.960) (9). A simple way to view the t statistic is as a multiplier of the SD to produce 95% uncertainty bounds. It is unlikely that the confidence limits presented in the present study would have changed significantly with greater sample size allocations.
The algorithm in the present study was designed for simplicity. By having only two replicates per sample, statistical calculation and data entry were streamlined. Equation 1 demonstrates the generally accepted statistical formula for standard error in replicate analysis. It is easy to demonstrate algebraically that equation 1 simplifies to equation 2 when only two replicates per samples are used. The simpler formula in equation 2 enabled us to evaluate the integrity of our GUI algorithm through manual calculation checks. Equation 2 was one of multiple formulae used in our calculations. Fieller’s method, which is based on a Taylor series expansion, is well described by Verderio et al (1) and elsewhere.
| Equation 1 |
| Equation 2 |
In which sN = standard error, N= the number of samples (1 to the jth sample), n = the number of replicates per sample (1 to the ith replicate), xij= the ith replicate of the jth sample, x̄j=the mean of the jth sample, x1j= the first replicate of the jth sample, x2j= the second replicate of the jth sample
While justifications for the sample size and replicate allocations have already been presented for the current study, it should be noted that the overall brevity of samples constitutes a limitation. Future studies (with larger sample sizes) should endeavour to develop GUIs that have the inherent plasticity to accept multiple replicate allocations.
The GUI proved to be intuitive and robust. The graphical representations, in conjunction with numerical confidence limits, facilitated communication with clinicians regarding the significance of a result (Figures 2 to 7).
Ideal PCR efficiency of 100±10% was achieved for the BK and EBV tests in the present study. Less than perfect efficiency in the CMV assay may reflect lot-to-lot changes in the kit standards rather than a true problem with the test itself.
It is important to note that UOM must be recalculated every time a new testing platform or kit manufacturer is introduced and, periodically, as part of routine quality control thereafter. The GUI in the present study was programmed to accept ongoing data entry.
The samples used in the present investigation were from immuno-compromised transplant patients undergoing routine monitoring post- transplant. The majority of these patients were clinically stable and correlates to disease severity were unavailable. The present analysis was an experiential study, with a main objective to describe the development and implementation of a GUI for real-time PCR UOM calculations. A weakness of the present study was the lack of documenting patient demographics including age, sex and disease condition. These data would be important to collect in future investigations to determine whether these factors independently affect repeatability. It is unlikely that the sample sizes used in the present study would have been able to detect the influence of demographic variables on the UOM of the three assays.
To date, few authors have addressed what appropriate methodologies should be used in the calculation of UOM for quantitative real-time PCR assays. There is also a paucity of literature detailing intra- and interlaboratory real-time PCR test characteristics. One such study did have confidence limits that were close to those found for EBV in the present study (10). In addition to reference materials, standardization of UOM calculation methods is required for interlaboratory comparisons. Ultimately, it is desirable if these calculations could be performed by testing platform software.]
SUMMARY
Quantitative viral monitoring using real-time PCR is routine in many institutions. Insight into the precision of each test is needed to deter- mine what constitutes a significant change in viral load. UOM is mandated by most laboratory licensing bodies and is a requirement for ISO 15189 certification. The aim of the present study was to develop a GUI for the calculation of UOM by repeated measures for real-time PCR of BK virus, CMV and EBV assays.
Figure 3).
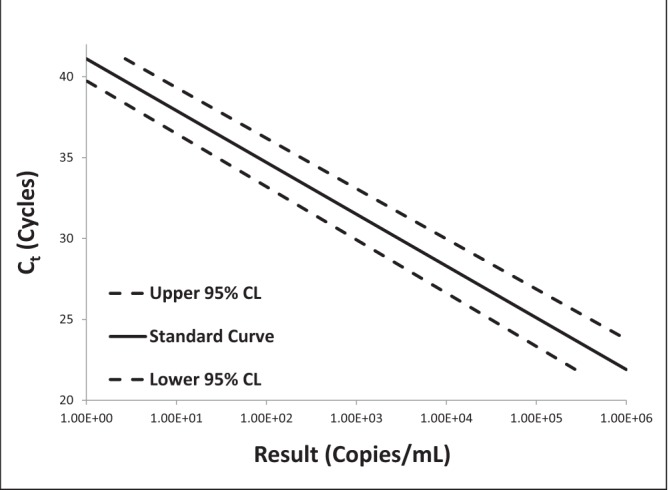
Semi-log plot of threshold cycle (Ct) versus result for BK virus real-time polymerase chain reaction replicate uncertainty of measurement analysis for 30 unique (one sample per patient) transplant patient samples
Figure 4).
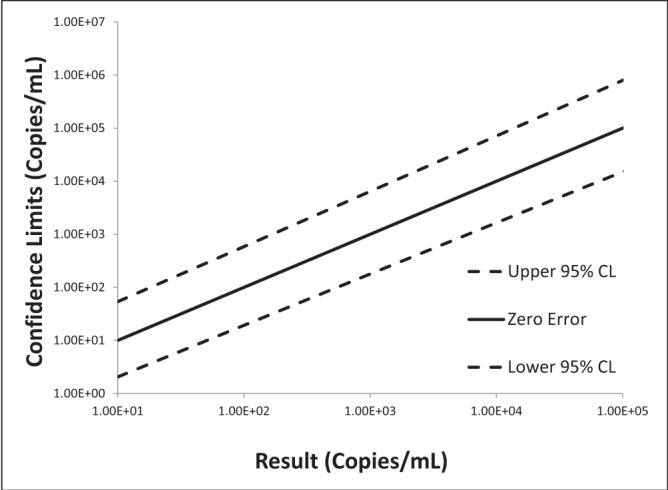
Log-log plot of error versus result for cytomegalovirus real-time polymerase chain reaction replicate uncertainty of measurement analysis for 30 unique (one sample per patient) transplant patient samples
Figure 5).
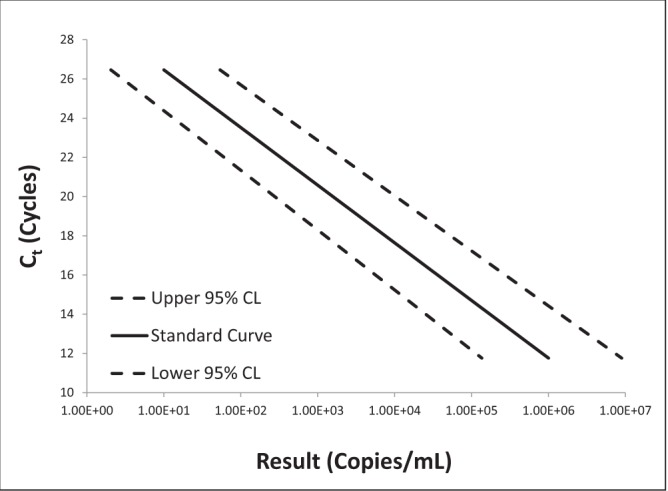
Semi-log plot of threshold cycle (Ct) versus result for cytomegalovirus real-time polymerase chain reaction replicate uncertainty of measurement analysis for 30 unique (one sample per patient) transplant patient samples
Figure 6).
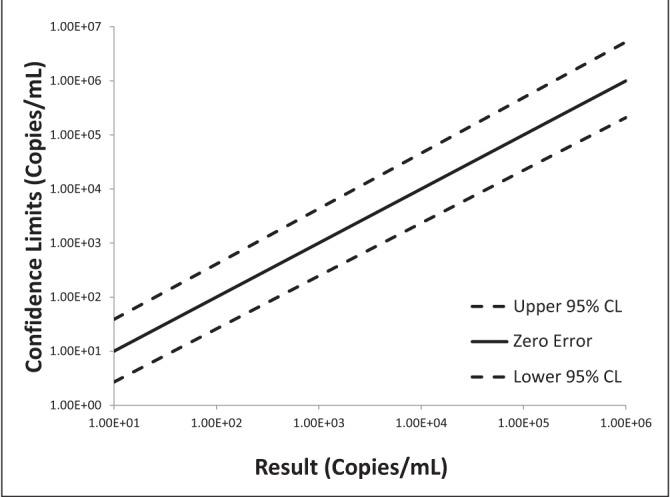
Log-log plot of error versus result for Epstein-Barr virus real-time polymerase chain reaction replicate uncertainty of measurement analysis for 30 unique (one sample per patient) transplant patient samples
Footnotes
DISCLOSURES: The authors have no financial disclosures or conflicts of interest to declare.
REFERENCES
- 1.Verderio P, Orlando C, Casini Raggi C, Marubini E. Confidence interval estimation for DNA and mRNA concentration by real-time PCR: A new environment for an old theorem. Int J Biol Markers. 2004;19:76–9. doi: 10.1177/172460080401900111. [DOI] [PubMed] [Google Scholar]
- 2.White GH, Farrance I. Uncertainty of measurement in quantitative medical testing: A laboratory implementation guide. Clin Biochem Rev. 2004;25:s1–24. [PMC free article] [PubMed] [Google Scholar]
- 3.Mettler D, Tholen D, American Association for Laboratory Accreditation G108- Guidelines for Estimating Uncertainty for Microbiological Counting Methods. < www.a2la.org/guidance/MU_for_Micro_Labs.pdf> (Accessed August 2, 2013)
- 4.Thompson MA, Aberg JA, Cahn P, et al. Antiretroviral treatment of adult HIV infection: 2010 recommendations of the International AIDS Society-USA panel. JAMA. 2010;21:304, 321–33. doi: 10.1001/jama.2010.1004. [DOI] [PubMed] [Google Scholar]
- 5.McGovern BH, Birch CE, Bowen MJ, et al. Improving the diagnosis of acute hepatitis C virus infection with expanded viral load criteria. Clin Infect Dis. 2009;49:1051–60. doi: 10.1086/605561. [DOI] [PMC free article] [PubMed] [Google Scholar]
- 6.Kraft CS, Armstrong WS, Caliendo AM. Interpreting quantitative cytomegalovirus DNA testing: Understanding the laboratory perspective. Clin Infect Dis. 2012;54:1793–7. doi: 10.1093/cid/cis212. [DOI] [PMC free article] [PubMed] [Google Scholar]
- 7.Gulley ML, Tang W. Using Epstein-Barr viral load assays to diagnose, monitor, and prevent posttransplant lymphoproliferative disorder. Clin Microbiol Rev. 2010;23:350–66. doi: 10.1128/CMR.00006-09. [DOI] [PMC free article] [PubMed] [Google Scholar]
- 8.Gibson HR, Dillard BL. Elementary Statistics. Dubuque: Kendall Hunt Publishing Company; 2013. pp. 154–5. [Google Scholar]
- 9.Sokal RR, Rohlf FJ. Introduction to Biostatistics. 2nd edn. New York: WH Freeman and Company; 1987. p. 323. [Google Scholar]
- 10.Preiksaitis JK, Pang XL, Fox JD, Fenton JM, Caliendo AM, Miller GG. Interlaboratory comparison of Epstein-Barr virus viral load assays. Am J Transplant. 2009;9:269–79. doi: 10.1111/j.1600-6143.2008.02514.x. [DOI] [PubMed] [Google Scholar]


