Abstract
Lysophospholipids (LysoGPs) serve as lipid mediators and precursors for synthesis of diacyl phospholipids (GPs). LysoGPs detected in cells have various acyl chains attached at either the sn-1 or sn-2 position of the glycerol backbone. In general, acyl chains at the sn-2 position of 2-acyl-1-LysoGPs readily move to the sn-1 position, generating 1-acyl-2-lyso isomers by a nonenzymatic reaction called intra-molecular acyl migration, which has hampered the detection of 2-acyl-1-LysoGPs in biological samples. In this study, we developed a simple and versatile method to separate and quantify 2-acyl-1- and 1-acyl-2-LysoGPs. The main point of the method was to extract LysoGPs at pH 4 and 4°C, conditions that were found to completely eliminate the intra-molecular acyl migration. Under the present conditions, the relative amounts of 2-acyl-1-LysoGPs and 1-acyl-2-LysoGPs did not change at least for 1 week. Further, in LysoGPs extracted from cells and tissues under the present conditions, most of the saturated fatty acids (16:0 and 18:0) were found in the sn-1 position of LysoGPs, while most of the PUFAs (18:2, 20:4, 22:6) were found in the sn-2 position. Thus the method can be used to elucidate the in vivo role of 2-acyl-1-LysoGPs.
Keywords: acyl migration reaction, asymmetric distribution of fatty acid, biological membrane
Studies in the last decade have revealed that lysophospholipids (LysoGPs) are bioactive lipids with a number of biological activities, most of which are mediated by specific receptors belonging to the class A G protein-coupled receptor (GPCR) family (1). To date, 16 such GPCRs have been identified, including 6 lysophosphatidic acid (LPA) receptors, 5 sphingosine 1-phosphate receptors, 4 lysophosphatidylserine (LysoPS) receptors, and 1 lysophosphatidylinositol (LPI) receptor (1–4). Recent studies of gene-targeting mice have clearly shown that these receptors function individually in various pathological and physiological conditions (5).
Glycero-LysoGPs have one acyl chain that is linked to either the sn-1 or sn-2 position of glycerol. Phospholipase A (PLA)1 and PLA2 cleave diacyl-phospholipids (GPs) and produce 2-acyl-1-lysophospholipids (2-acyl-1-LysoGPs) and 1-acyl-2-LysoGPs, respectively. Recent studies have suggested that some LysoGP receptors discriminate 1-acyl-2-LysoGPs from 2-acyl-1-LysoGPs. For example, LPA3/Edg7 (6, 7) and LPA6/P2Y5 (8) prefer 2-acyl-1-LPA to 1-acyl-2-LPA. In addition, they prefer LPA with unsaturated fatty acids, which are usually attached at the sn-2 position of GPs. LPS1/GPR34 also shows preference for 2-acyl-1-LysoPS (9). These findings indicate that 2-acyl-1-LysoGPs exert their activities through specific receptors. Because of their different activities, 2-acyl-1-LysoGPs and 1-acyl-2-LysoGPs should be quantified separately.
However, it has been difficult to detect and quantify 2-acyl-1-LysoGPs in biological samples because 2-acyl-1-LysoGPs are unstable and are quickly converted to the corresponding 1-acyl-2-LysoGPs by a spontaneously occurring intra-molecular acyl migration reaction (10), yielding a mixture of 1-acyl-2-LysoGPs and 2-acyl-1-LysoGPs. Plückthun and Dennis (10) demonstrated that 1-palmitoyl-2-lysophosphatidylcholine (LPC) prepared by PLA2 is actually the equilibrium mixture consisting of approximately 90% of the 1-acyl-2-lyso isomers and 10% of the 2-acyl-1-lyso isomers. They also showed that the rate of the acyl migration was pH dependent, with a minimum around pH 4 to pH 5. Their technique was based on 31P NMR and thus could be used only on pure samples. In the present study, we developed a simple and versatile method to separate and quantify 2-acyl-1- and 1-acyl-2-lyso isomers using LC-MS/MS under conditions that completely eliminate the acyl migration reaction. Using this method, we determined the distribution of 2-acyl-1-LysoGPs and 1-acyl-2-LysoGPs with various head groups in biological samples. To the best of our knowledge, this is the first report to precisely determine the distribution of acyl chains between the sn-1 and sn-2 positions.
MATERIALS AND METHODS
Materials
All phospholipids {dioleoyl-phosphatidylserine (PS), dilinoleoyl-GPs [phosphatidic acid (PA), phosphatidylcholine (PC), phosphatidylethanolamine (PE), phosphatidylglycerol (PG), phosphatidylinositol (PI), and PS], 17:0-LPA, and 17:0-LPC were purchased from Avanti Polar Lipids. Phospholipids were dried in borosilicated glass tubes (9831-1207; Iwaki Glass) under nitrogen gas, dissolved in PBS using a water bath sonicator, and stored at −20°C. Other materials were purchased from Wako Pure Chemical Industries, unless otherwise noted. Acidic methanol (pH 4.0) was prepared by mixing 1 ml of 1 M ammonium formate and 99 ml of methanol (Kanto Chemical), and adjusting apparent pH to 4.0 by adding formic acid (approximately 1,160 μl) using a pH meter (D-21; Horiba).
Animals
C57BL/6 mice were purchased from CLEA Japan and maintained according to the Guidelines for Animal Experimentation of Tohoku University. The animal protocol was approved by the Institutional Animal Care and Use Committee at Tohoku University (No. 17-Pharm-Animal-2012).
Cell culture
HEK293 cells were maintained in DMEM (Nissui Pharmaceutical) supplemented with 10% fetal bovine serum (Gibco), 100 U/ml penicillin (Sigma-Aldrich), and 100 μg/ml streptomycin (Gibco) at 37°C in the presence of 5% CO2 gas.
LC-MS/MS analysis
LC-MS/MS analysis was principally performed as described previously with minor modifications (11, 12). The LC-MS/MS system consisted of a NANOSPACE SI-II HPLC (Shiseido) and a TSQ Quantum Ultra triple quadrupole mass spectrometer (Thermo Fisher Scientific, San Jose, CA) equipped with a heated-electrospray ionization-II (HESI-II) source. The positive and negative HESI-II spray voltages were 3,500 and 2,500 V, respectively, the heated capillary temperature was 350°C, the sheath gas pressure was 60 psi, the auxiliary gas setting was 40 psi, and the heated vaporizer temperature was 350°C. Both the sheath gas and auxiliary gas were nitrogen. The collision gas was argon at a pressure of 1.5 mTorr. The LC-MS/MS system was controlled by Xcalibur software (Thermo Fisher Scientific) and data were collected with the same software. LysoGP analyses were performed in the multiple reaction monitoring (MRM) mode, in positive ion mode for LPC and in negative ion mode for LPA, lysophosphatidylethanolamine (LPE), lysophosphatidylglycerol (LPG), LPI, and LysoPS. The collision energy was optimized for each compound to obtain optimum sensitivity using argon as collision gas. The collision energy settings, tube lens offsets, and MRM transitions for all analytes are summarized in Table 1. LC separation was performed using a reverse-phase column [Capcell Pak ACR (250 mm × 1.5 mm inner diameter, 3 μm particle size; Shiseido)] with a gradient elution of solvent A (5 mM ammonium formate in water, pH 4.0) and solvent B (5 mM ammonium formate in 95% (v/v) acetonitrile, pH 4.0) at 150 μl/min. Solvent A was prepared by mixing 95 ml of Milli-Q (Millipore) water and 5 ml of 100 mM ammonium formate, and adjusting to pH 4.0 with formic acid (approximately 9.6 μl). Similarly, solvent B was prepared by mixing 95 ml of acetonitrile and 5 ml of 100 mM ammonium formate, and adjusting to apparent pH 4.0 with formic acid (approximately 1,160 μl). The initial condition was set at 55% B. The following solvent gradient was applied: maintained 55% B for 10 min and then followed by a linear gradient to 85% B from 10 to 30 min, and hold at 85% B for 7 min. Subsequently, the mobile phase was immediately returned to the initial conditions and maintained for 3 min until the end of the run. Column effluent was introduced into the mass spectrometer between 3 and 37 min after injection.
TABLE 1.
MRM transition for LC-MS/MS method of lysophospholipids
| Compound | MRM (m/z) | Collision Energy (eV) | Tube Lens Offset (V) |
| LPC (14:0) | 468.3 → 184.1 | 31 | 99 |
| LPC (16:0) | 496.3 → 184.1 | 31 | 99 |
| LPC (16:1) | 494.3 → 184.1 | 31 | 99 |
| LPC (17:0) | 510.4 → 184.1 | 31 | 99 |
| LPC (18:0) | 524.4 → 184.1 | 31 | 99 |
| LPC (18:1) | 522.4 → 184.1 | 31 | 99 |
| LPC (18:2) | 520.3 → 184.1 | 31 | 99 |
| LPC (18:3) | 518.3 → 184.1 | 31 | 99 |
| LPC (20:3) | 546.4 → 184.1 | 31 | 99 |
| LPC (20:4) | 544.3 → 184.1 | 31 | 99 |
| LPC (20:5) | 542.3 → 184.1 | 31 | 99 |
| LPC (22:5) | 570.4 → 184.1 | 31 | 99 |
| LPC (22:6) | 568.3 → 184.1 | 31 | 99 |
| LPA (14:0) | 381.2 → 153.0 | 22 | 71 |
| LPA (16:0) | 409.2 → 153.0 | 22 | 71 |
| LPA (16:1) | 407.2 → 153.0 | 22 | 71 |
| LPA (17:0) | 423.3 → 153.0 | 22 | 71 |
| LPA (18:0) | 437.3 → 153.0 | 22 | 71 |
| LPA (18:1) | 435.3 → 153.0 | 22 | 71 |
| LPA (18:2) | 433.2 → 153.0 | 22 | 71 |
| LPA (18:3) | 431.2 → 153.0 | 22 | 71 |
| LPA (20:3) | 459.3 → 153.0 | 22 | 71 |
| LPA (20:4) | 457.2 → 153.0 | 22 | 71 |
| LPA (20:5) | 455.2 → 153.0 | 22 | 71 |
| LPA (22:5) | 483.3 → 153.0 | 22 | 71 |
| LPA (22:6) | 481.2 → 153.0 | 22 | 71 |
| LPE (14:0) | 424.2 → 196.0 | 29 | 111 |
| LPE (16:0) | 452.3 → 196.0 | 29 | 111 |
| LPE (16:1) | 450.3 → 196.0 | 29 | 111 |
| LPE (18:0) | 480.3 → 196.0 | 29 | 111 |
| LPE (18:1) | 478.3 → 196.0 | 29 | 111 |
| LPE (18:2) | 476.3 → 196.0 | 29 | 111 |
| LPE (18:3) | 474.3 → 196.0 | 29 | 111 |
| LPE (20:3) | 502.3 → 196.0 | 29 | 111 |
| LPE (20:4) | 500.3 → 196.0 | 29 | 111 |
| LPE (20:5) | 498.3 → 196.0 | 29 | 111 |
| LPE (22:5) | 526.3 → 196.0 | 29 | 111 |
| LPE (22:6) | 524.3 → 196.0 | 29 | 111 |
| LPG (14:0) | 455.2 → 227.2 | 26 | 132 |
| LPG (16:0) | 483.3 → 255.2 | 26 | 132 |
| LPG (16:1) | 481.3 → 253.2 | 26 | 132 |
| LPG (18:0) | 511.3 → 283.3 | 26 | 132 |
| LPG (18:1) | 509.3 → 281.2 | 26 | 132 |
| LPG (18:2) | 507.3 → 279.2 | 26 | 132 |
| LPG (18:3) | 505.3 → 277.2 | 26 | 132 |
| LPG (20:3) | 533.3 → 305.2 | 26 | 132 |
| LPG (20:4) | 531.3 → 303.2 | 26 | 132 |
| LPG (20:5) | 529.3 → 301.2 | 26 | 132 |
| LPG (22:5) | 557.3 → 329.2 | 26 | 132 |
| LPG (22:6) | 555.3 → 327.2 | 26 | 132 |
| LPI (14:0) | 543.3 → 227.2 | 40 | 145 |
| LPI (16:0) | 571.3 → 255.2 | 40 | 145 |
| LPI (16:1) | 569.3 → 253.2 | 40 | 145 |
| LPI (18:0) | 599.3 → 283.3 | 40 | 145 |
| LPI (18:1) | 597.3 → 281.2 | 40 | 145 |
| LPI (18:2) | 595.3 → 279.2 | 40 | 145 |
| LPI (18:3) | 593.2 → 277.2 | 40 | 145 |
| LPI (20:3) | 621.3 → 305.2 | 40 | 145 |
| LPI (20:4) | 619.3 → 303.2 | 40 | 145 |
| LPI (20:5) | 617.3 → 301.2 | 40 | 145 |
| LPI (22:5) | 645.3 → 329.2 | 40 | 145 |
| LPI (22:6) | 643.3 → 327.2 | 40 | 145 |
| LysoPS (14:0) | 468.2 → 381.2 | 22 | 97 |
| LysoPS (16:0) | 496.3 → 409.2 | 22 | 97 |
| LysoPS (16:1) | 494.3 → 407.2 | 22 | 97 |
| LysoPS (18:0) | 524.3 → 437.3 | 22 | 97 |
| LysoPS (18:1) | 522.3 → 435.3 | 22 | 97 |
| LysoPS (18:2) | 520.3 → 433.2 | 22 | 97 |
| LysoPS (18:3) | 518.3 → 431.2 | 22 | 97 |
| LysoPS (20:3) | 546.3 → 459.2 | 22 | 97 |
| LysoPS (20:4) | 544.3 → 457.2 | 22 | 97 |
| LysoPS (20:5) | 542.3 → 455.2 | 22 | 97 |
| LysoPS (22:5) | 570.3 → 483.3 | 22 | 97 |
| LysoPS (22:6) | 568.3 → 481.2 | 22 | 97 |
Evaluation of the acyl-migration reaction
To examine the effect of pH and temperature, a mixture of dilinoleoyl-GPs (PA, PC, PE, PG, PI, and PS) was incubated with 3.0 μg/ml (660 lipase units/ml) Rhizomucor miehei lipase (Sigma; L4277), which has intrinsic PLA1 activity, at 37°C for 3 h. The reactant was dissolved in methanol, whose pH was adjusted between 3 and 10 by adding formic acid or 1 M NaOH. After samples were left at −80°C, −20°C, 4°C, or room temperature (approximately 25°C) for 0, 1, 2, and 7 days, LysoGPs were analyzed by LC-MS/MS.
To examine the effects of albumin on the stability of 2-acyl-1-lyso-GPs, dioleoyl-PS was incubated with recombinant PS-specific PLA1 (PS-PLA1) at 37°C for 30 min and then mixed with 100 μg/ml Olristat (Roche; a lipase inhibitor) to stop the reaction. The solution was mixed with 0.1% (w/v) BSA (Sigma; fatty acid-free grade, A6003) and further incubated at 37°C. At the indicated time points, an aliquot (10 μl) was placed into a 1.5-ml sample tube. Then, acidic methanol (pH 4.0, 190 μl) was added to deproteinize the sample. The obtained mixture was homogenized for 3 min in an ultrasonic bath (ice-cold water). After centrifugation at 21,500 g for 10 min at 4°C, the supernatant was subjected to LC-MS/MS.
Quantification of lysophospholipids in various tissues
Mouse tissues (approximately 100 mg) were placed in 1.5 ml siliconized sample tubes. Then, nine volumes of acidic methanol (pH 4.0), 1 μM (final concentration) of 17:0-LPA, and 10 μM (final concentration) of 17:0-LPC were added to the tube. The obtained mixture was homogenized for 10 min by Micro Smash MS-100R (TOMY) (3,000 rpm at 4°C). After an initial centrifugation at 1,000 g for 10 min at 4°C, the supernatants were further centrifuged at 21,500 g for 10 min at 4°C. The resulting supernatant was passed through a filter (0.2 μm pore size, 4 mm inner diameter; YMC), and 10 μl of the filtrate was subjected to LC-MS/MS.
To obtain a serum sample, a blood sample was collected with a noncoated capillary (910-01-75; Hirschmann Laborgerate), incubated at 37°C for 1 h, allowed to stand at 4°C for 12 h, and centrifuged at 1,500 g for 10 min at 25°C. Plasma was collected with a heparinized capillary (1-040-7500-HC; Drummond), followed by addition of 1 mM of EDTA (final concentration), and centrifuged at 1,500 g for 10 min at 25°C. The plasma and serum samples (10 μl each) were placed in 1.5 ml siliconized sample tubes, deproteinized by mixing with 90 μl acidic methanol (pH 4.0), homogenized for 3 min in an ultrasonic bath, and centrifuged at 21,500 g for 10 min at 4°C (ice-cold water). The supernatants were filtered and 10 μl of the filtrate was subjected to the LC-MS/MS.
Method validation
A mixture of 1 mM 18:1-LPC, 100 μM 18:1-LPA, LPE, LPG, LPI, and LysoPS was prepared in methanol. It was diluted with methanol to prepare standard solutions with final concentrations of 100 μM, 50 μM, 10 μM, 5 μM, 1 μM, 500 nM, and 100 nM of 18:1-LPC and 10 μM, 5 μM, 1 μM, 500 nM and 100 nM of 18:1-LPA, 18:1-LPE, 18:1-LPG, 18:1-LPI, and 18:1-LysoPS. As internal standard stock solution, a mixture of 10 μM 17:0-LPC and 1 μM 17:0-LPA (final concentration) was also prepared in methanol. Ten microliters of each standard solution was injected into LC-MS/MS. The ratio between analyte and internal standard peak area was used for quantification. To determine the precision of the method, four samples were analyzed on the same day, and this procedure was repeated for 3 days. The coefficient of variation within one sample run (intra-day) and between sample runs (inter-day) was determined for various concentrations of LysoGPs. To determine extraction recovery, three concentrations of LysoGPs (100 μM, 50 μM, 1 μM 18:1-LPC, 10 μM, 5 μM, 1 μM 18:1-LPA, 18:1-LPE, 18:1-LPG, 18:1-LPI, and 18:1-LysoPS) solutions were prepared in brain, heart, lung, liver, spleen, kidney, plasma, and serum. Ten milligrams of tissue and 10 μl of plasma and serum were added 90 μl methanol containing each concentration of the LysoGP mixture and internal standard. The samples were prepared as described above. The extraction recovery was calculated as [(found concentration-endogenous concentration)/standard concentration] × 100 (%).
Preparation of recombinant PS-PLA1 enzyme
Recombinant PS-PLA1 proteins were prepared as described previously (9). Briefly, HEK293 cells were transfected with expression plasmids encoding mouse wild-type PS-PLA1 or mutant catalytically inactive PS-PLA1 (PS-PLA1 S166A), which has substitution of the catalytic center serine (166Ser) with an alanine, using Lipofectamine 2000 (Life Technologies) according to the manufacturer’s protocol. Cells were cultured in Opti-MEM (Life Technologies) for 72 h and conditioned media were collected, concentrated by Amicon Ultra (Millipore), and used as a recombinant protein source.
Detection of 2-acyl-1-LysoPS in HEK293 cells treated with recombinant PS-PLA1
HEK293 cells (1.0 × 10⁵ cells) were incubated with recombinant PS-PLA1 in 100 μl Opti-MEM in the presence or absence of 0.1% BSA at 37°C for 1 h. The cultures were centrifuged at 1,000 g for 3 min. The supernatants and cell pellets were deproteinized with 160 μl and 200 μl acidic methanol (pH 4.0), respectively, homogenized for 3 min in an ultrasonic bath, and centrifuged at 21,500 g for 10 min at 4°C (ice-cold water). The supernatants were filtered and 20 μl of the filtrate was subjected to LC-MS/MS.
RESULTS
Separation of 2-acyl-1-lyso-GPs and 1-acyl-2-lyso-GPs by reverse-phase HPLC
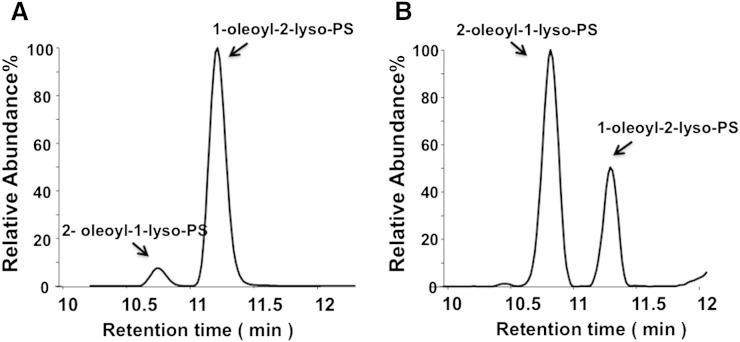
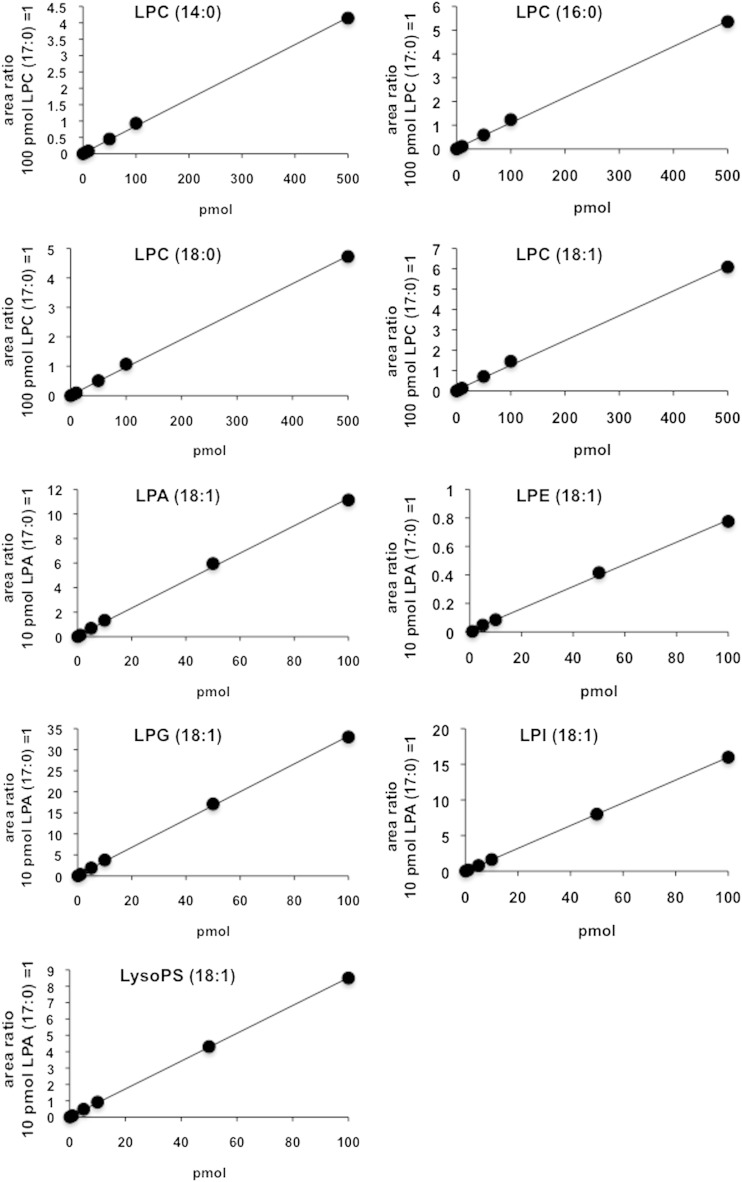
We previously established a method to separate a wide range of LysoGP species including LPC, LPE, LPI, LysoPS, LPG, LPA, and sphingosine 1-phosphate (11, 12). In this method LysoGPs are separated by octadecyl (C18) reverse-phase LC and detected by MS/MS. This method was found to separate 1-acyl-2-LysoGPs from the corresponding 2-acyl-1-lyso isomers (Fig. 1). Digestion of dioleoyl-PS with PLA2 and monitoring of LysoPS (with m/z 522.2 in negative mode) resulted in two separate peaks (elution times at 10.7 and 11.2 min, respectively). The first peak was dominant when PLA1 was employed and the second peak was dominant when PLA2 was employed, indicating that the first and the second peaks correspond to 2-acyl-1-LysoPS and 1-acyl-2-LysoPS, respectively. The order of elution in reverse-phase LC was consistent with a previous report (13, 14). The presence of 2-acyl-1-LysoPS in a PLA2 reactant and 1-acyl-2-LysoPS in a PLA1 reactant indicated that acyl chain migration occurred during the phospholipase reactions. 1-Acyl-2-LysoGPs and 2-acyl-1-LysoGPs with other polar head groups could also be separated under these conditions, and 2-acyl-1-LysoGPs always eluted faster than the corresponding 1-acyl-2-LysoGPs (data not shown). The standard curve for each LysoGP was constructed by plotting against the peak area ratio of the analytes to the internal standard (Fig. 2). The standard curves for LPC species were linear from 0.1 to 500 μM. The regions in which the standard curves for other LysoGPs were linear were similar (Table 2). Intra- and inter-day assay precision were 0.6–13.8% and 0.1–39.3%, respectively (Table 3). In the following experiments, we quantified the amount of LysoGPs within the calibration range.
Fig. 1.
Separation of 2-acyl-1-LysoPS and 1-acyl-2-LysoPS on C18-based reverse column chromatography. Dioleoyl-PS was subjected to either PLA2 (A) or PLA1 (B) reaction, and the resulting lipids were subjected to LC-MS/MS analysis. Elution profiles of oleoyl-LysoPS with an m/z value of 522 in negative mode are shown. Oleoyl-LysoPS was detected in two peaks in the chromatogram. Because the faster migrating peak was dominant when PLA1 was used and the slower peak was dominant when PLA2 was used, the faster peak was attributed to 2-oleoyl-1-LysoPS and the slower peak was attributed to 1-oleoyl-2-LysoPS.
Fig. 2.
Standard curves of lysophospholipid species. Standard curves were constructed by plotting the peak area ratio of the analyte against the concentration of the internal standard. 17:0-LPA was used as an internal standard for LPA, LysoPS, LPE, LPG, and LPI. 17:0-LPC was used as an internal standard for LPCs. The calibration range and method precision are shown in Tables 2 and 3, respectively.
TABLE 2.
Calibration curve for lysophospholipids
| Standard Curve | R^2 | Calibration Range (pmol) | |
| LPC (14:0) | y = 0.0083x + 0.0175 | 0.9994 | 0.1–500 |
| LPC (16:0) | y = 0.0107x + 0.0284 | 0.9990 | 0.1–500 |
| LPC (18:0) | y = 0.0095x+ 0.0208 | 0.9992 | 0.1–500 |
| LPC (18:1) | y = 0.0122x+ 0.0447 | 0.9983 | 0.1–500 |
| LPA (18:1) | y = 0.1118x+ 0.0979 | 0.9988 | 0.1–100 |
| LPE (18:1) | y = 0.0078x+ 0.0075 | 0.9986 | 5–100 |
| LPG (18:1) | y = 0.3305x + 0.1884 | 0.9996 | 0.1–100 |
| LPI (18:1) | y = 0.3305x + 0.1884 | 0.9996 | 0.1–100 |
| LysoPS (18:1) | y = 0.085x + 00285 | 0.9999 | 0.1–100 |
TABLE 3.
Intra-day and inter-day precision of determination method for lysophospholipids
| (μM) | (pmol) | LPC (14:0) | LPC (16:0) | LPC (18:0) | LPC (18:1) | LPA (18:1) | LPE (18:1) | LPG (18:1) | LPI (18:1) | LysoPS (18:1) |
| Intra-day precision (%) (n = 4) | ||||||||||
| 0.01 | 0.1 | 9.1 | 0.7 | 1.0 | 2.6 | 13.8 | — | 3.9 | 9.7 | 12.6 |
| 0.05 | 0.5 | 2.3 | 3.3 | 2.0 | 0.9 | 10.7 | — | 11.0 | 2.1 | 6.8 |
| 0.1 | 1 | 2.4 | 2.5 | 1.8 | 2.8 | 3.2 | — | 2.8 | 5.1 | 4.5 |
| 0.5 | 5 | 0.6 | 0.5 | 1.5 | 1.6 | 3.1 | 10.1 | 0.3 | 3.9 | 5.1 |
| 1 | 10 | 1.6 | 0.4 | 0.4 | 1.9 | 4.2 | 3.9 | 1.1 | 3.1 | 5.3 |
| 5 | 50 | 2.0 | 2.0 | 0.9 | 1.4 | 2.7 | 3.9 | 4.4 | 3.4 | 6.0 |
| 10 | 100 | 1.2 | 0.6 | 1.6 | 0.5 | 1.7 | 1.6 | 1.0 | 3.1 | 1.7 |
| 50 | 500 | 2.1 | 3.6 | 2.8 | 3.2 | — | — | — | — | — |
| Inter-day precision (%) (n = 4) | ||||||||||
| 0.01 | 0.1 | 6.9 | 3.4 | 5.4 | 11.1 | 5.6 | — | 9.1 | 10.8 | 39.3 |
| 0.05 | 0.5 | 0.1 | 3.8 | 2.5 | 0.2 | 1.4 | — | 7.6 | 3.5 | 6.4 |
| 0.1 | 1 | 0.9 | 3.9 | 2.0 | 3.5 | 2.6 | — | 4.6 | 8.1 | 12.8 |
| 0.5 | 5 | 4.1 | 0.7 | 0.5 | 1.7 | 1.4 | 8.9 | 0.8 | 1.8 | 3.5 |
| 1 | 10 | 4.8 | 2.2 | 0.2 | 0.4 | 4.6 | 1.0 | 3.0 | 1.2 | 7.8 |
| 5 | 50 | 1.8 | 1.5 | 0.6 | 0.5 | 1.3 | 2.2 | 2.3 | 1.4 | 1.3 |
| 10 | 100 | 1.8 | 2.3 | 2.9 | 2.5 | 0.8 | 0.8 | 0.4 | 1.6 | 3.3 |
| 50 | 500 | 3.8 | 5.2 | 4.8 | 6.5 | — | — | — | — | — |
2-Acyl-1-LysoGPs are stable in acidic and low temperature conditions
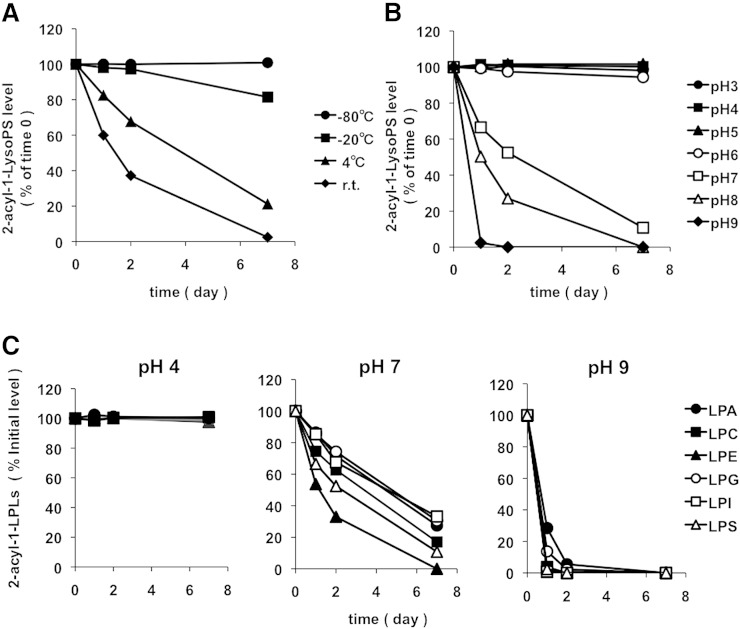
2-Oleoyl-1-LysoPS deteriorated rapidly at room temperature but remained stable for at least 1 week at −80°C (Fig. 3A). 2-Oleoyl-1-LysoPS deteriorated rapidly at pHs of 7 and above, but remained stable at pHs of 5 and below (Fig. 3B). 1-Acyl-2-LysoGPs with other head groups were also stable at pH 4 (Fig. 3C). By contrast, at neutral and pH 9, they were quickly converted to the corresponding 1-acyl-2-lyso isomers at different rates, with rates in the order LPE > LPS > LPC = LPA, LPG, LPI (Fig. 3C). Thus, in the following experiments we extracted lipids using methanol with an apparent pH 4.0 on ice and kept the samples at −20°C before analyses.
Fig. 3.
Effects of pH and temperature on the acyl migration of 2-acyl-1-lysophospholipids. A: Effect of temperature on the acyl migration reaction of 2-oleoyl-1-LysoPS. Dioleoyl-PS was digested by PLA1, and to the resulting reaction mixture nine volumes of methanol were added. The samples were kept at various temperatures. The amount of 2-oleoyl-1-LysoPS present at time 0 was defined as 100%. B: Effect of pH on the acyl migration reaction of 2-oleoyl-1-LysoPS. Dioleoyl-PS was digested by PLA1, and to the resulting reactant reaction mixture nine volumes of methanol with varying pH were added. The samples were kept at −20°C. C: The effect of pH on the acyl migration reaction of various 2-acyl-1-lysophospholipids. Dioleoyl phospholipids (PA, PC, PE, PG, and PS) and PI from porcine brain were mixed and digested by PLA1, and to the resulting reactants nine volumes of methanol with varying pH value (4, 7, or 9) were added. The samples were kept at −20°C. In each experiment, aliquots were taken at the indicated times points and analyzed by LC-MS/MS. The data are representative of three experiments with similar results.
Quantification of 2-acyl-1-LysoGPs and 1-acyl-2-LysoGPs in biological samples
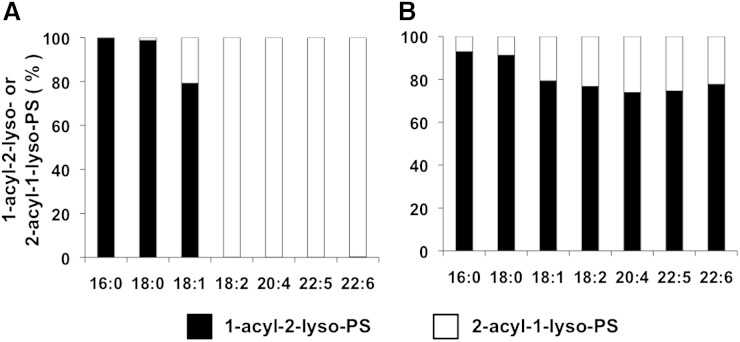
LysoPSs with 16:0, 18:0, 18:1, 18:2, 20:4, 22:5, and 22:6 were detected in mouse liver. Interestingly, LysoPSs with 16:0 and 18:0 were almost exclusively comprised of the 1-acyl-2-lyso isomer; whereas LysoPSs with 18:2, 20:4, 22:5 and 22:6 were exclusively comprised of the 2-acyl-1-lyso isomer. 18:1-LysoPS was found as both 1-acyl-2-lyso and 2-acyl-1-lyso isomers (Fig. 4A). Notably, the characteristic fatty acid distributions of the sn-1 and sn-2 positions were completely lost when lipids were extracted with methanol with neutral pH at room temperature (Fig. 4B), demonstrating that the result obtained using the newly established condition (Fig. 4A) reflected the accurate fatty acid distribution in the sn-1 and sn-2 positions of LysoPS in the mouse liver.
Fig. 4.
Distribution of 2-acyl-1-LysoPS and 1-acyl-2-LysoPS in the liver and the effect of pH. A: Phospholipids from mouse liver were dissolved in methanol by adding nine volumes of acid methanol (pH 4) and sonication, and were subjected to LC-MS/MS. The amount of 2-acyl-1-LysoPS and 1-acyl-2-LysoPS was quantified for each acyl chain (16:0, 18:0, 18:1, 18:2, 20:4, 22:5, and 22:6) and the ratio of 2-acyl-1-LysoPS and 1-acyl-2-LysoPS is shown for each fatty acid. B: Experiment was performed as in (A), except phospholipids were dissolved in neutral methanol.
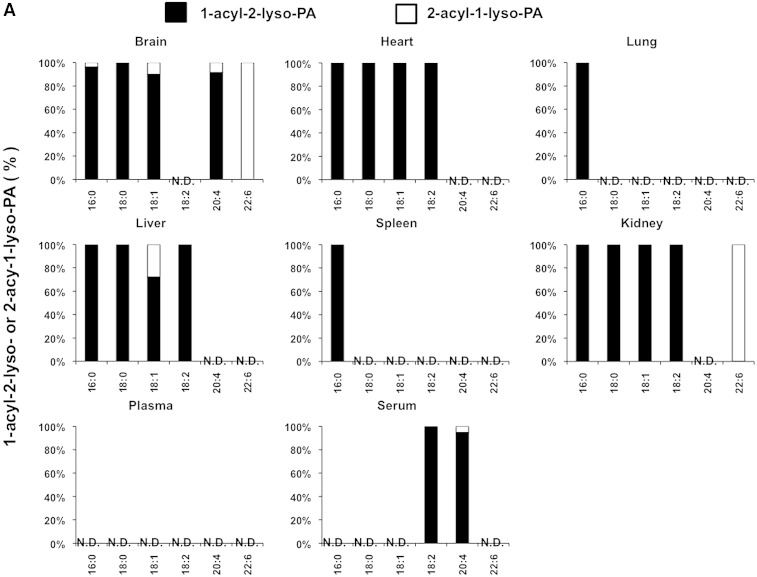
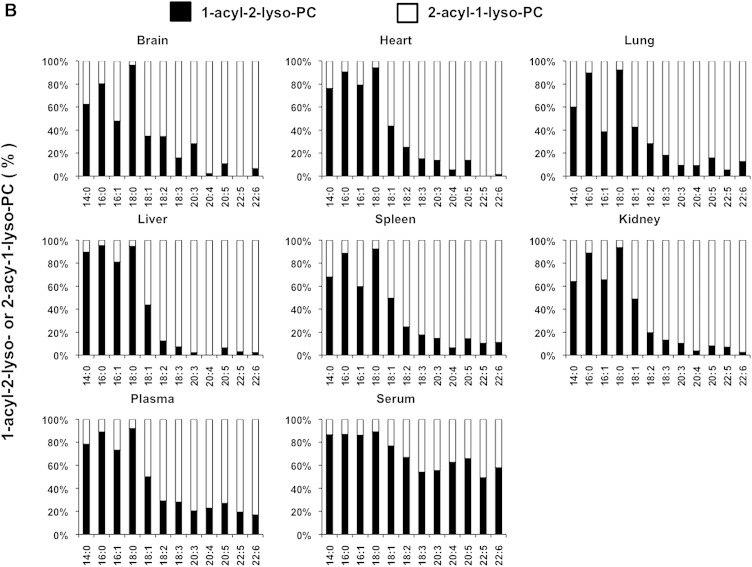
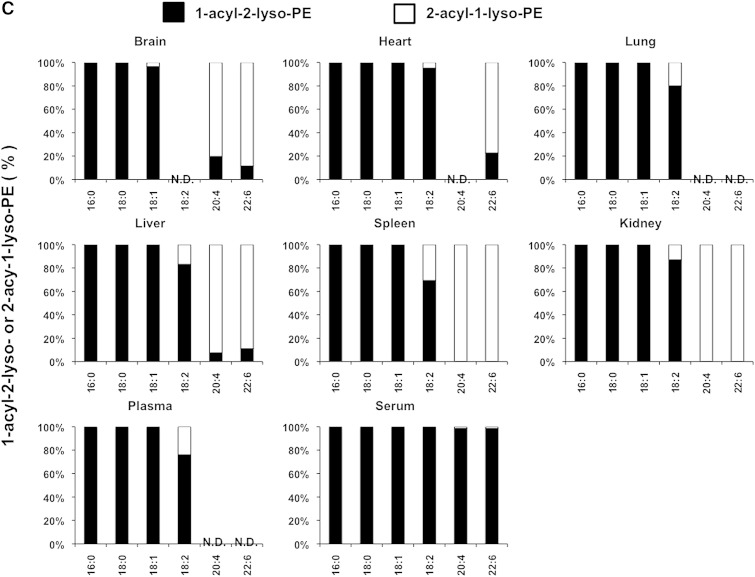
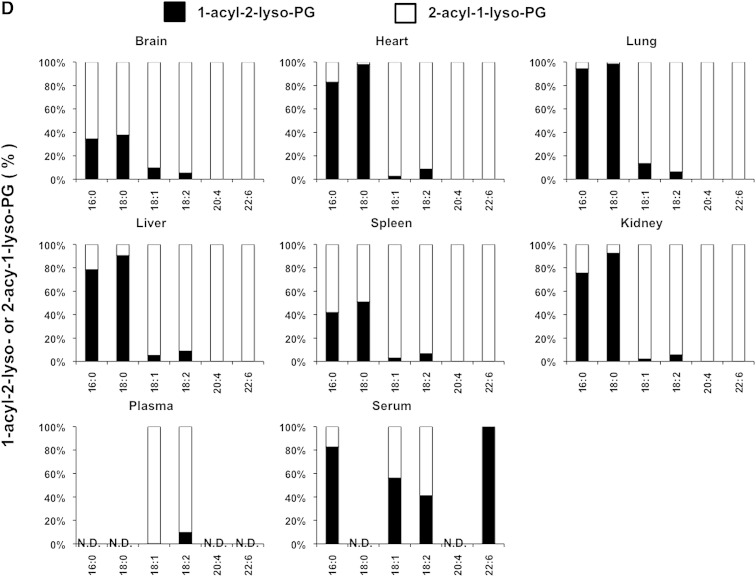
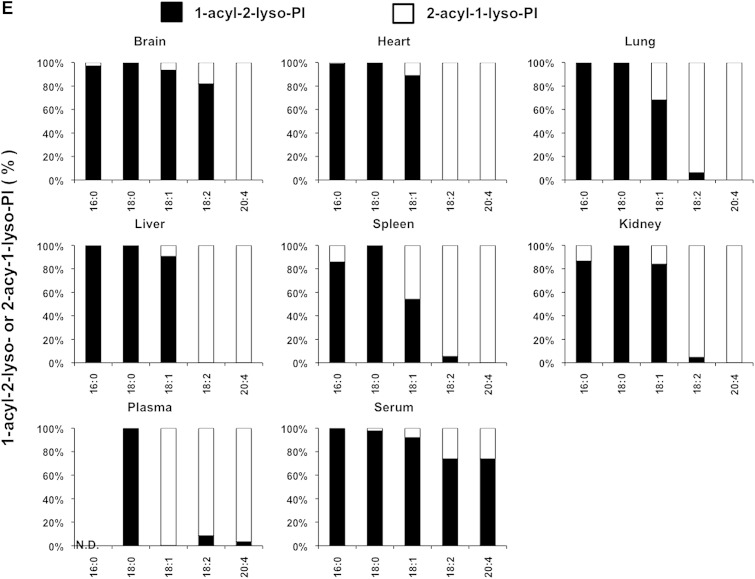
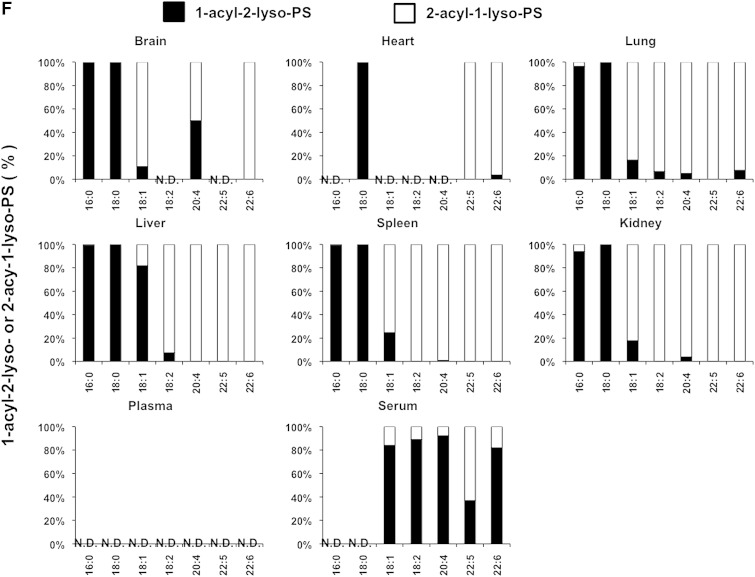
We also examined the LysoGP species in various mouse tissues and freshly prepared plasma and serum (Fig. 5A–F). The fatty acid distributions of other LysoGPs were similar to those observed for LysoPS in the mouse liver: saturated fatty acids (16:0 and 18:0) were detected mainly in the sn-1 position and unsaturated fatty acids (18:2, 20:4, 22:6, etc.) were detected mainly in the sn-2 position. Monounsaturated fatty acids (18:1, 16:1 in the case of LPC) distributed differently depending on the polar heads and origin of tissues (Fig. 5B). Interestingly, however, we observed some exceptions. For example, saturated LPC detected in various tissues contained significant amounts of 2-acyl-1-LPC, and unsaturated LPC, which was detected in various tissues, contained significant amounts of 1-acyl-2-LPC (Fig. 5B). In addition, most saturated LPGs detected in the brain and spleen were found to be 2-acyl-1-LPG (Fig. 5D). As expected, the uneven fatty acid distribution of LysoGPs in serum was completely lost, probably because of the 1 h incubation at 37°C. In sharp contrast, freshly prepared plasma contained both saturated and unsaturated fatty acids that were distributed unevenly between the sn-1 and sn-2 positions, as was the fatty acid distribution of LysoGPs from various tissues. To demonstrate the utility of this method, we examined the level of LysoGPs in the samples (Table 5). Some of the LysoGPs that were detected could not be quantified because their concentrations were below the limit of quantitation. These LysoGPs were labeled as not quantified (NQ) in Table 5, and those that were not detected were labeled ND.
Fig. 5.
Distribution of 2-acyl-1-lyso-GPs and 1-acyl-2-lyso-GPs in various mouse tissues. A: Phospholipids from various mouse tissues (brain, heart, lung, liver, spleen, and kidney), plasma, and serum were dissolved in methanol by adding nine volumes of acid methanol (pH 4) and sonication, and were subjected to LC-MS/MS. The amount of 2-acyl-1-lyso-GPs and 1-acyl-2-lyso-GPs was quantified for each polar head [LPA (A), LPC (B), LPE (C), LPG (D), LPI (E), and LysoPS (F)] and acyl chain (14:0, 16:0, 16:1, 18:0, 18:1, 18:2, 18:3, 20:3, 20:4, 20:5, 22:5, and 22:6) and the ratio of 2-acyl-1-LysoGP and 1-acyl-2-LysoGP is shown for each fatty acid. The data are representative of three experiments with similar results. Note that only LysoGPs whose fatty acids were detected are shown. N.D., not detected.
TABLE 5.
Concentrations of lysophospholipid species in biological samples (pmol/mg for tissues and pmol/µl for plasma or serum)
| LysoPGs | 1-acyl-lysoPG or 2-acyl-lysoPG | Brain | Heart | Lung | Liver | Spleen | Kidney | Plasma | Serum |
| LPA (16:0) | 1-acyl | 0.44 ± 0.14 | 1.18 ± 0.25 | 0.10 ± 0.03 | 1.36 ± 0.19 | NQ | 0.67 ± 0.08 | ND | ND |
| 2-acyl | NQ | ND | ND | ND | ND | ND | ND | ND | |
| LPA (18:0) | 1-acyl | 0.12 ± 0.06 | NQ | ND | NQ | ND | NQ | ND | ND |
| 2-acyl | ND | ND | ND | ND | ND | ND | ND | ND | |
| LPA (18:1) | 1-acyl | 0.48 ± 0.12 | 0.28 ± 0.02 | ND | 0.11 ± 0.05 | ND | NQ | ND | ND |
| 2-acyl | NQ | ND | ND | NQ | ND | ND | ND | ND | |
| LPA (18:2) | 1-acyl | ND | 0.15 ± 0.08 | ND | 0.29 ± 0.05 | ND | NQ | ND | 0.11 ± 0.06 |
| 2-acyl | ND | ND | ND | ND | ND | ND | ND | ND | |
| LPA (20:4) | 1-acyl | 0.15 ± 0.04 | ND | ND | ND | ND | ND | ND | NQ |
| 2-acyl | NQ | ND | ND | ND | ND | ND | ND | NQ | |
| LPA (22:6) | 1-acyl | ND | ND | ND | ND | ND | ND | ND | ND |
| 2-acyl | NQ | ND | ND | ND | ND | NQ | ND | ND | |
| LPC (14:0) | 1-acyl | NQ | NQ | NQ | NQ | NQ | NQ | NQ | 0.11 ± 0.01 |
| 2-acyl | NQ | NQ | NQ | NQ | NQ | NQ | NQ | NQ | |
| LPC (16:0) | 1-acyl | 5.02 ± 0.42 | 8.99 ± 0.50 | 32.25 ± 1.08 | 29.37 ± 3.91 | 26.97 ± 1.33 | 26.19 ± 1.71 | 22.24 ± 1.73 | 37.16 ± 2.31 |
| 2-acyl | 1.18 ± 0.19 | 0.88 ± 0.07 | 3.46 ± 0.11 | 1.27 ± 0.22 | 3.26 ± 0.11 | 3.04 ± 0.33 | 2.57 ± 0.29 | 5.22 ± 0.55 | |
| LPC (16:1) | 1-acyl | NQ | NQ | 0.24 ± 0.02 | 0.25 ± 0.05 | 0.10 ± 0.01 | NQ | 0.26 ± 0.03 | 0.53 ± 0.02 |
| 2-acyl | NQ | NQ | 0.37 ± 0.04 | NQ | NQ | NQ | NQ | NQ | |
| LPC (18:0) | 1-acyl | 3.64 ± 0.27 | 7.18 ± 0.80 | 18.53 ± 2.47 | 14.56 ± 1.38 | 17.78 ± 1.68 | 17.26 ± 2.08 | 8.35 ± 0.60 | 14.36 ± 1.56 |
| 2-acyl | 0.12 ± 0.02 | 0.40 ± 0.04 | 1.38 ± 0.19 | 0.71 ± 0.13 | 1.33 ± 0.15 | 1.06 ± 0.11 | 0.65 ± 0.06 | 1.59 ± 0.19 | |
| LPC (18:1) | 1-acyl | 0.92 ± 0.07 | 0.49 ± 0.03 | 1.03 ± 0.02 | 1.54 ± 0.28 | 0.96 ± 0.12 | 1.04 ± 0.06 | 2.02 ± 0.24 | 4.43 ± 0.31 |
| 2-acyl | 1.74 ± 0.34 | 0.63 ± 0.10 | 1.39 ± 0.19 | 1.99 ± 0.30 | 0.97 ± 0.01 | 1.09 ± 0.07 | 2.00 ± 0.15 | 1.32 ± 0.06 | |
| LPC (18:2) | 1-acyl | NQ | 0.50 ± 0.04 | 1.10 ± 0.14 | 0.71 ± 0.16 | 0.81 ± 0.02 | 0.75 ± 0.06 | 3.93 ± 0.53 | 12.06 ± 0.98 |
| 2-acyl | 0.10 ± 0.02 | 1.50 ± 0.23 | 2.78 ± 0.17 | 5.06 ± 1.02 | 2.48 ± 0.13 | 3.08 ± 0.20 | 9.55 ± 0.79 | 5.94 ± 0.26 | |
| LPC (18:3) | 1-acyl | NQ | NQ | NQ | NQ | NQ | NQ | NQ | NQ |
| 2-acyl | NQ | NQ | NQ | NQ | NQ | NQ | NQ | NQ | |
| LPC (20:3) | 1-acyl | NQ | NQ | NQ | NQ | NQ | NQ | NQ | 0.20 ± 0.04 |
| 2-acyl | NQ | NQ | 0.11 ± 0.04 | 0.28 ± 0.05 | 0.10 ± 0.01 | 0.11 ± 0.01 | 0.18 ± 0.03 | 0.16 ± 0.02 | |
| LPC (20:4) | 1-acyl | NQ | NQ | NQ | ND | NQ | NQ | 0.47 ± 0.13 | 2.13 ± 0.45 |
| 2-acyl | 0.63 ± 0.19 | 0.36 ± 0.11 | 0.66 ± 0.19 | 2.27 ± 0.53 | 0.79 ± 0.04 | 0.81 ± 0.12 | 1.59 ± 0.34 | 1.27 ± 0.22 | |
| LPC (20:5) | 1-acyl | NQ | NQ | NQ | NQ | NQ | NQ | NQ | 0.33 ± 0.06 |
| 2-acyl | NQ | NQ | NQ | 0.15 ± 0.04 | NQ | NQ | 0.21 ± 0.04 | 0.17 ± 0.02 | |
| LPC (22:5) | 1-acyl | ND | ND | NQ | NQ | NQ | NQ | NQ | NQ |
| 2-acyl | NQ | NQ | NQ | 0.15 ± 0.03 | NQ | NQ | NQ | NQ | |
| LPC (22:6) | 1-acyl | NQ | NQ | NQ | NQ | NQ | NQ | 0.25 ± 0.05 | 2.35 ± 0.31 |
| 2-acyl | 0.45 ± 0.14 | 1.84 ± 0.62 | 0.44 ± 0.04 | 2.05 ± 0.34 | 0.36 ± 0.02 | 2.45 ± 0.18 | 1.23 ± 0.14 | 1.70 ± 0.10 | |
| LPE (16:0) | 1-acyl | 16.70 ± 2.56 | 11.51 ± 2.09 | 40.68 ± 9.13 | 266.21 ± 58.86 | 29.11 ± 0.65 | 46.39 ± 2.97 | 5.20 ± 0.77 | NQ |
| 2-acyl | ND | ND | ND | ND | ND | ND | ND | ND | |
| LPE (18:0) | 1-acyl | 54.63 ± 18.56 | 23.10 ± 11.01 | 20.80 ± 4.62 | 151.86 ± 30.18 | 34.36 ± 10.37 | 54.91 ± 5.84 | NQ | NQ |
| 2-acyl | ND | ND | ND | ND | ND | ND | ND | ND | |
| LPE (18:1) | 1-acyl | 10.60 ± 1.48 | NQ | NQ | 116.00 ± 13.05 | NQ | 27.71 ± 2.91 | NQ | NQ |
| 2-acyl | NQ | ND | ND | ND | ND | ND | ND | ND | |
| LPE (18:2) | 1-acyl | ND | NQ | NQ | 7.84 ± 2.69 | NQ | NQ | NQ | 5.66 ± 0.90 |
| 2-acyl | ND | NQ | NQ | NQ | NQ | NQ | NQ | ND | |
| LPE (20:4) | 1-acyl | NQ | ND | ND | NQ | ND | ND | ND | 5.17 ± 0.60 |
| 2-acyl | N.Q. | ND | ND | NQ | NQ | NQ | ND | NQ | |
| LPE (22:6) | 1-acyl | NQ | NQ | ND | NQ | ND | ND | ND | 13.35 ± 2.23 |
| 2-acyl | NQ | NQ | ND | 6.97 ± 4.51 | NQ | 12.65 ± 5.59 | ND | NQ | |
| LPG (16:0) | 1-acyl | 0.31 ± 0.19 | 1.05 ± 0.37 | 9.81 ± 3.98 | 0.48 ± 0.18 | 0.16 ± 0.02 | 0.83 ± 0.13 | ND | NQ |
| 2-acyl | 0.59 ± 0.46 | 0.21 ± 0.12 | 0.57 ± 0.21 | 0.13 ± 0.05 | 0.22 ± 0.06 | 0.27 ± 0.05 | ND | NQ | |
| LPG (18:0) | 1-acyl | 0.11 ± 0.03 | 0.20 ± 0.04 | 0.88 ± 0.32 | 0.13 ± 0.05 | N.Q. | 0.12 ± 0.01 | N.D. | N.D. |
| 2-acyl | 0.19 ± 0.02 | NQ | NQ | NQ | NQ | NQ | ND | ND | |
| LPG (18:1) | 1-acyl | 0.47 ± 0.22 | NQ | 0.40 ± 0.13 | NQ | NQ | NQ | ND | NQ |
| 2-acyl | 4.32 ± 3.58 | 2.32 ± 0.90 | 2.55 ± 0.38 | 1.21 ± 0.20 | 2.26 ± 0.33 | 1.44 ± 0.36 | NQ | NQ | |
| LPG (18:2) | 1-acyl | NQ | 0.41 ± 0.15 | 0.26 ± 0.11 | 0.31 ± 0.09 | 0.24 ± 0.08 | 0.18 ± 0.07 | NQ | NQ |
| 2-acyl | 0.52 ± 0.42 | 4.27 ± 1.65 | 3.93 ± 0.99 | 3.09 ± 0.34 | 3.34 ± 0.45 | 2.94 ± 0.76 | NQ | NQ | |
| LPG (20:4) | 1-acyl | ND | ND | ND | ND | ND | ND | ND | ND |
| 2-acyl | 0.65 ± 0.51 | 0.21 ± 0.11 | 0.29 ± 0.06 | 0.24 ± 0.06 | 0.76 ± 0.18 | 0.22 ± 0.08 | ND | ND | |
| LPG (22:6) | 1-acyl | ND | ND | ND | ND | ND | ND | ND | NQ |
| 2-acyl | 0.29 ± 0.25 | 0.47 ± 0.13 | 0.78 ± 0.14 | 1.11 ± 0.04 | 0.65 ± 0.10 | 0.71 ± 0.17 | ND | ND | |
| LPI (16:0) | 1-acyl | 3.24 ± 0.85 | 0.73 ± 0.39 | 1.62 ± 0.12 | 26.70 ± 6.52 | 1.17 ± 0.52 | 6.17 ± 1.49 | ND | ND |
| 2-acyl | 0.11 ± 0.03 | NQ | ND | ND | 0.20 ± 0.05 | 0.98 ± 0.23 | NQ | ND | |
| LPI (18:0) | 1-acyl | 9.72 ± 2.89 | 4.24 ± 1.05 | 1.90 ± 0.34 | 50.53 ± 15.27 | 4.45 ± 1.37 | 29.06 ± 6.42 | NQ | 0.25 ± 0.06 |
| 2-acyl | ND | ND | ND | ND | ND | ND | ND | NQ | |
| LPI (18:1) | 1-acyl | 3.89 ± 1.36 | 0.83 ± 0.39 | 0.41 ± 0.03 | 21.13 ± 6.15 | 0.54 ± 0.11 | 2.59 ± 0.44 | ND | NQ |
| 2-acyl | 0.29 ± 0.06 | 0.11 ± 0.05 | 0.20 ± 0.02 | 2.27 ± 0.41 | 0.46 ± 0.03 | 0.51 ± 0.22 | NQ | NQ | |
| LPI (18:2) | 1-acyl | NQ | ND | NQ | ND | NQ | 0.14 ± 0.04 | NQ | 0.46 ± 0.09 |
| 2-acyl | NQ | 1.43 ± 0.42 | 0.24 ± 0.06 | 15.93 ± 3.35 | 0.63 ± 0.16 | 2.57 ± 0.83 | 0.12 ± 0.03 | 0.17 ± 0.06 | |
| LPI (20:4) | 1-acyl | ND | ND | ND | ND | ND | ND | NQ | 0.54 ± 0.08 |
| 2-acyl | 1.38 ± 0.44 | 1.75 ± 0.37 | 0.40 ± 0.09 | 14.88 ± 3.15 | 1.08 ± 0.22 | 2.90 ± 1.00 | NQ | 0.19 ± 0.06 | |
| LysoPS (16:0) | 1-acyl | NQ | ND | 0.10 ± 0.03 | 2.07 ± 0.34 | 1.50 ± 0.60 | 0.13 ± 0.07 | ND | ND |
| 2-acyl | ND | ND | NQ | NQ | NQ | NQ | ND | ND | |
| LysoPS (18:0) | 1-acyl | 1.07 ± 0.27 | 0.47 ± 0.06 | 1.18 ± 0.16 | 5.72 ± 1.77 | 6.15 ± 1.51 | 2.00 ± 0.23 | ND | ND |
| 2-acyl | ND | ND | ND | ND | ND | ND | ND | ND | |
| LysoPS (18:1) | 1-acyl | NQ | ND | NQ | 0.12 ± 0.06 | NQ | NQ | ND | NQ |
| 2-acyl | 0.71 ± 0.28 | ND | 0.19 ± 0.04 | NQ | 0.18 ± 0.04 | 0.12 ± 0.05 | ND | NQ | |
| LysoPS (18:2) | 1-acyl | ND | ND | NQ | NQ | ND | ND | ND | NQ |
| 2-acyl | ND | ND | NQ | NQ | 0.25 ± 0.11 | 0.11 ± 0.04 | ND | NQ | |
| LysoPS (20:4) | 1-acyl | NQ | ND | NQ | ND | NQ | NQ | ND | 0.16 ± 0.09 |
| 2-acyl | NQ | ND | NQ | 2.53 ± 0.68 | 2.74 ± 1.05 | 0.20 ± 0.05 | ND | NQ | |
| LysoPS (22:5) | 1-acyl | ND | ND | ND | ND | ND | ND | ND | NQ |
| 2-acyl | ND | NQ | NQ | 0.15 ± 0.10 | NQ | 0.14 ± 0.03 | ND | NQ | |
| LysoPS (22:6) | 1-acyl | ND | NQ | NQ | ND | ND | ND | ND | 0.37 ± 0.24 |
| 2-acyl | 6.29 ± 1.68 | 0.96 ± 0.06 | 0.26 ± 0.10 | 8.01 ± 3.17 | 1.65 ± 0.86 | 0.77 ± 0.00 | ND | NQ | |
| Data are mean ± SD (n = 3). Concentrations of LysoGPs relative to each 18:1 LysoGP are shown. NQ, not quantified; ND, not detected. | |||||||||
We examined the extraction recovery from seven different biological samples, brain, heart, lung, liver, spleen, kidney, and plasma, using this method. The recovery varied 77.9–113.1% in 18:1-LPC, 80.0–116.6% in 18:1-LPA, 71.6–178.3% in 18:1-LPE, 63.4–115.5% in 18:1-LPG, 70.7–112.8% in 18:1-LPI, and 62.9–97.2% in 18:1-LysoPS (Table 4).
TABLE 4.
Extraction recovery of lysophospholipids from several tissues
| Recovery (%) (n = 3) | Amount of LysoPGs Injected (pmol) | Brain | Heart | Lung | Liver | Spleen | Kidney | Plasma |
| LPC (18:1) | 50 | 103.5 | 89.7 | 82.1 | 77.9 | 91.5 | 103.8 | 112.5 |
| 100 | 113.1 | 104.6 | 87.2 | 99.8 | 71.3 | 94.1 | 104.8 | |
| LPA (18:1) | 5 | 83.2 | 88.0 | 97.6 | 81.2 | 96.9 | 80.0 | 99.4 |
| 10 | 86.5 | 90.2 | 116.6 | 99.0 | 106.2 | 71.0 | 76.1 | |
| LPE (18:1) | 5 | 122.2 | 71.6 | 98.2 | 122.6 | 119.6 | 110.8 | 111.7 |
| 10 | 104.0 | 78.6 | 71.2 | 114.0 | 178.3 | 78.9 | 84.9 | |
| LPG (18:1) | 5 | 100.4 | 63.4 | 98.8 | 77.8 | 84.6 | 85.1 | 85.4 |
| 10 | 115.5 | 85.1 | 101.3 | 110.8 | 105.3 | 93.8 | 89.5 | |
| LPI (18:1) | 5 | 103.4 | 70.7 | 106.6 | 109.4 | 99.6 | 79.5 | 78.3 |
| 10 | 112.8 | 84.1 | 92.6 | 105.1 | 105.8 | 96.4 | 89.9 | |
| LysoPS (18:1) | 5 | 90.8 | 62.9 | 98.3 | 87.1 | 97.2 | 63.4 | 79.1 |
| 10 | 96.0 | 70.2 | 70.6 | 96.8 | 87.0 | 90.2 | 109.6 |
Albumin accelerates acyl migration
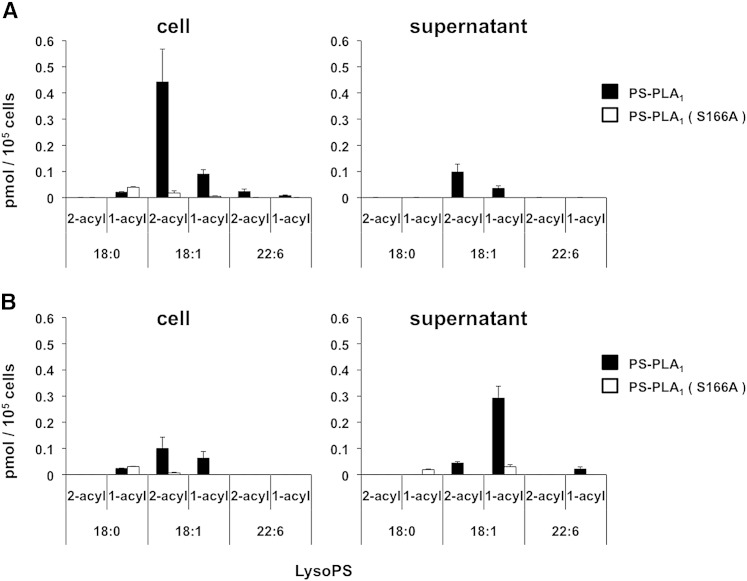
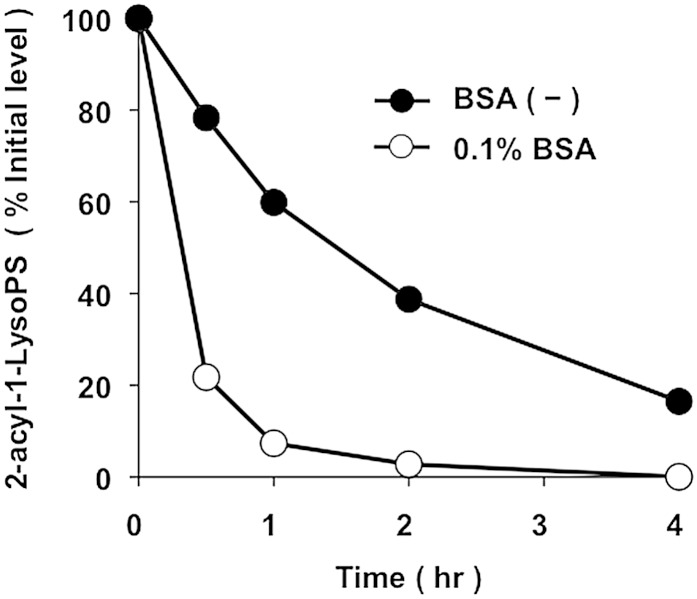
Finally, we attempted to detect 2-acyl-1-LysoGPs at the cellular levels. We chose PS-PLA1 as an enzyme to produce 2-acyl-1-LysoPS on the cell surface. PS-PLA1 specifically cleaves PS and is capable of cleaving PS on the outer surface of plasma membrane without any effect on cell viability (15). When HEK293 cells were treated with recombinant PS-PLA1, a significant amount of 2-oleoyl-1-LysoPS and a lesser amount of 2-DHA-1-LysoPS were detected in the cells but not in the cell supernatant. 1-Oleoyl-2-LysoPS was also detected, but the level was less than the level of 2-oleoyl-1-LysoPS. These LysoPS species were produced by PS-PLA1 because none of them were detectable when catalytically inactive PS-PLA1 mutant was used (Fig. 6A). Interestingly, when the conditioned media were supplemented with albumin, which binds and extracts LysoGPs from the cell surface, most of the LysoPS was detected in the cell supernatant as a 1-oleoyl-2-isomer (Fig. 6B). This suggested that 2-acyl-1-LysoPS was fairly stable on the cell membrane in the absence of albumin and that albumin added to the media extracted 2-acyl-1-LysoPS and converted it into 1-acyl-2-LysoPS. This was confirmed by the finding that the acyl migration was dramatically accelerated in the presence of 0.1% BSA (Fig. 7).
Fig. 6.
Detection of 2-acyl-1-LysoPS in biological membrane. HEK293 cells were treated with recombinant PS-PLA1 and the LysoPS in both cells and cell supernatants was analyzed by LC-MS/MS. In the cells, the major LysoPS species detected were oleoyl (18:1)-LysoPS with minor stearoyl (18:0)- and DHA (22:6)-LysoPS. In the absence of albumin, LysoPS was mainly associated with the cells as 2-acyl-1-LysoPS (A). While in the presence of albumin, most LysoPS was detected in the cell supernatant as 1-acyl-2-LysoPS (B). The results using the catalytically inactive PS-PLA1 (S166A) are also shown as negative controls. The data are representative of three experiments with similar results. SD is indicated by bars.
Fig. 7.
Albumin stimulates acyl migration. Dioleoyl-PS was digested by PLA1 prior to the addition of albumin. At time 0, albumin (final 0.1%, w/v) and lipase inhibitor (to stop the PLA1 reaction) were added and the samples were left at 37°C. Aliquots were taken at the indicated times and subjected to LC-MS/MS after the addition of nine volumes of acid methanol (pH 4). The result obtained in the absence of albumin is also shown. The amount of 2-oleoyl-1-LysoPS present at time 0 was defined as 100%. The data are representative of three experiments with similar results.
DISCUSSION
It has been difficult to quantify the level of 2-acyl-1-LysoGP species because of acyl migration reaction. In the current study, we minimized the acyl migration reaction and established a simple and versatile method for separation and quantification of 1-acyl-2-LysoGPs and 2-acyl-1-LysoGPs. The preceding paper by Plückthun et al. indicated that the acyl migration reaction of LPC was highly sensitive to pH and was effectively suppressed by lowering pH to 4 or 5 (10). In this study, we utilized this property and determined the pH-dependent stability of all the LysoGP classes, including LPC, LPA, LPE, LPG, LPI, and LysoPS. The result was essentially the same as was reported by the preceding paper for LPC (10). However, we obtained new information about the acyl migration reaction of LysoGPs. For example, the speed of the acyl migration reaction is highly dependent on the head group of LysoGPs (a rank order of migration rate is as follows: LPE > LysoPS > LPC > LPI > LPG, LPA; Fig. 3C). Furthermore, we found that the acyl migration reaction was sensitive to the temperature. By keeping the temperature below −20°C, we succeeded in suppressing the reaction completely. The method utilized in the preceding paper required 31P-labeled LysoGPs and NMR equipment (10). Thus, it was not readily applicable to biological samples. In contrast, the present method is applicable to biological samples, such as tissues and cells in culture, by measuring LysoGPs directly.
In the current study, we established an LC method for separating 2-acyl-1-LysoGPs and 1-acyl-2-LysoGPs and examined the conditions in which the acyl migration was minimal (Fig. 1). The previous study by Creer and Gross (14) showed that 1-acyl-2-LPC and 2-acyl-1-LPC could be separated on reverse-phase LC. However, the following modifications were applied. By comparing several reverse-phase columns, we chose CAPCELLPAK C18 ACR (Shiseido), which enabled us to separate the 1-acyl-2-lyso isomers and 2-acyl-1-lyso isomers of all the LysoGP species (data not shown). Indeed, the present method made it possible to analyze as much as 100 LysoGP species with different head groups and acyl chains within the range from several picomoles to nanomoles. In addition, we used the LC solvents with pH 4.0 to avoid possible acyl migration reaction during LC separation. Moreover, our method, adding the methanol only, is very easy and has high extract efficiency (Table 5). In our laboratory, by using an autosampler, simultaneous analyses of several hundred samples are possible.
When the method was applied to some biological samples (Figs. 4–6), LysoGPs with saturated fatty acids (16:0 and 18:0) were principally 1-acyl-2-LysoGPs and those with unsaturated fatty acids (18:2, 20:4, 22:6) were principally 2-acyl-1-LysoGPs (Figs. 4, 5), in agreement with the classical notion. In LysoGPs prepared under conventional conditions (neutral pH and room temperature), the asymmetrical distribution pattern was completely lost (Fig. 4B), demonstrating that the present method is suitable for determining the distribution of fatty acids between the sn-1 and sn-2 positions of LysoGPs. Among the fatty acids, we found that 18:1 (oleoyl moiety) distributed differentially between the sn-1 and sn-2 positions depending on both the head group and tissue. For example, whereas most 18:1-LPE species detected in various tissues were 1-oleoyl-2-LPE, 2-oleoyl-1-lyso isomers were the major 18:1-containing LPC and LPG (Fig. 5). Further studies are needed to understand why the distribution of 18:1 is asymmetrical.
It was revealed in this study that the pattern of acyl chain distribution in fresh plasma was totally different from that in serum. Most PUFA-containing LysoGPs detected in freshly prepared mouse plasma were 2-acyl-1-lyso isomers and most saturated LysoGPs were 1-acyl-2-lyso isomers, indicating that plasma (or naïve blood) has a mechanism for maintaining an asymmetric distribution. We previously demonstrated that multiple phospholipase activities are involved in the production of LysoGPs (mainly LPC) in plasma. LCAT (which has PLA2 activity) and lipases (which have PLA1 activity) are responsible for continuous production of LysoGPs in blood (19). The present method will elucidate the synthetic pathway of such plasma LysoGPs.
The present study confirmed that the fatty acid asymmetrical distribution between the sn-1 and the sn-2 of LysoGPs was kept in most tissues, while it was partially lost in plasma and almost completely lost in serum. 1-Acyl-2-LysoGPs were more stable in organic solvents such as chloroform than in aqueous solution (data not shown). Thus, LysoGPs appear to be more stable in a hydrophobic environment than in an aqueous environment. If this is the case, it is reasonable to assume that 1-acyl-2-LysoGPs are more stable in a biological membrane (lipid bilayer) where water molecules are excluded. This idea is supported by the observation that the acyl migration was accelerated when LysoGPs were extracted from cells (Fig. 6) or liposomes (Fig. 7) to the aqueous environment by albumin. This explains why most of the LysoGPs detected in serum were 1-acyl-2-lyso isomers.
In summary, we developed a simple and versatile method to measure 1-acyl-2-LysoGPs and 2-acyl-1-LysoGPs. The method can be used to determine the precise ratio of 1-acyl-2-LysoGPs and the corresponding 2-acyl-1-LysoGPs in various biological samples, and thus, aids in better understanding of the biological significance of 2-acyl-1-LysoGPs.
Footnotes
Abbreviations:
- GP
- phospholipid
- GPCR
- G protein-coupled receptor
- LPA
- lysophosphatidic acid
- LPC
- lysophosphatidylcholine
- LPE
- lysophosphatidylethanolamine
- LPI
- lysophosphatidylinositol
- LPG
- lysophosphatidylglycerol
- LysoGP
- lysophospholipid
- LysoPS
- lysophosphatidylserine
- MRM
- multiple reaction monitoring
- PA
- phosphatidic acid
- PC
- phosphatidylcholine
- PE
- phosphatidylethanolamine
- PG
- phosphatidylglycerol
- PI
- phosphatidylinositol
- PLA
- phospholipase A
- PS
- phosphatidylserine
- PS-PLA1
- phosphatidylserine-specific phospholipase A1
This work was supported by a Grant-in-Aid for Scientific Research from the Ministry of Education and Science, the Program for Promotion of Fundamental Studies in Health Sciences of the National Institute of Biomedical Innovation (NIBIO) and CREST from JST.
REFERENCES
- 1.Chun J., Hla T., Lynch K. R., Spiegel S., Moolenaar W. H. 2010. International Union of Basic and Clinical Pharmacology. LXXVIII. Lysophospholipid receptor nomenclature. Pharmacol. Rev. 62: 579–587. [DOI] [PMC free article] [PubMed] [Google Scholar]
- 2.Inoue A., Ishiguro J., Kitamura H., Arima N., Okutani M., Shuto A., Higashiyama S., Ohwada T., Arai H., Makide K., et al. 2012. TGFα shedding assay: an accurate and versatile method for detecting GPCR activation. Nat. Methods. 9: 1021–1029. [DOI] [PubMed] [Google Scholar]
- 3.Oka S., Nakajima K., Yamashita A., Kishimoto S., Sugiura T. 2007. Identification of GPR55 as a lysophosphatidylinositol receptor. Biochem. Biophys. Res. Commun. 362: 928–934. [DOI] [PubMed] [Google Scholar]
- 4.Sugo T., Tachimoto H., Chikatsu T., Murakami Y., Kikukawa Y., Sato S., Kikuchi K., Nagi T., Harada M., Ogi K., et al. 2006. Identification of a lysophosphatidylserine receptor on mast cells. Biochem. Biophys. Res. Commun. 341: 1078–1087. [DOI] [PubMed] [Google Scholar]
- 5.Choi J. W., Herr D. R., Noguchi K., Yung Y. C., Lee C. W., Mutoh T., Lin M. E., Teo S. T., Park K. E., Mosley A. N., et al. 2010. LPA receptors: subtypes and biological actions. Annu. Rev. Pharmacol. Toxicol. 50: 157–186. [DOI] [PubMed] [Google Scholar]
- 6.Bandoh K., Aoki J., Hosono H., Kobayashi S., Kobayashi T., Murakami-Murofushi K., Tsujimoto M., Arai H., Inoue K. 1999. Molecular cloning and characterization of a novel human G-protein-coupled receptor, EDG7, for lysophosphatidic acid. J. Biol. Chem. 274: 27776–27785. [DOI] [PubMed] [Google Scholar]
- 7.Bandoh K., Aoki J., Taira A., Tsujimoto M., Arai H., Inoue K. 2000. Lysophosphatidic acid (LPA) receptors of the EDG family are differentially activated by LPA species. Structure-activity relationship of cloned LPA receptors. FEBS Lett. 478: 159–165. [DOI] [PubMed] [Google Scholar]
- 8.Yanagida K., Masago K., Nakanishi H., Kihara Y., Hamano F., Tajima Y., Taguchi R., Shimizu T., Ishii S. 2009. Identification and characterization of a novel lysophosphatidic acid receptor, p2y5/LPA6. J. Biol. Chem. 284: 17731–17741. [DOI] [PMC free article] [PubMed] [Google Scholar]
- 9.Kitamura H., Makide K., Shuto A., Ikubo M., Inoue A., Suzuki K., Sato Y., Nakamura S., Otani Y., Ohwada T., et al. 2012. GPR34 is a receptor for lysophosphatidylserine with a fatty acid at the sn-2 position. J. Biochem. 151: 511–518. [DOI] [PubMed] [Google Scholar]
- 10.Plückthun A., Dennis E. A. 1982. Acyl and phosphoryl migration in lysophospholipids: importance in phospholipid-synthesis and phospholipase specificity. Biochemistry. 21: 1743–1750. [DOI] [PubMed] [Google Scholar]
- 11.Inoue A., Arima N., Ishiguro J., Prestwich G. D., Arai H., Aoki J. 2011. LPA-producing enzyme PA-PLA1α regulates hair follicle development by modulating EGFR signalling. EMBO J. 30: 4248–4260. [DOI] [PMC free article] [PubMed] [Google Scholar]
- 12.Saigusa D., Shiba K., Inoue A., Hama K., Okutani M., Iida N., Saito M., Suzuki K., Kaneko T., Suzuki N., et al. 2012. Simultaneous quantitation of sphingoid bases and their phosphates in biological samples by liquid chromatography/electrospray ionization tandem mass spectrometry. Anal. Bioanal. Chem. 403: 1897–1905. [DOI] [PubMed] [Google Scholar]
- 13.Nicholas A. W., Khouri L. G., Ellington J. C., Jr, Porter N. A. 1983. Synthesis of mixed-acid phosphatidylcholines and high pressure liquid chromatographic analysis of isomeric lysophosphatidylcholines. Lipids. 18: 434–438. [DOI] [PubMed] [Google Scholar]
- 14.Creer M. H., Gross R. W. 1985. Separation of isomeric lysophospholipids by reverse phase HPLC. Lipids. 20: 922–928. [DOI] [PubMed] [Google Scholar]
- 15.Hosono H., Aoki J., Nagai Y., Bandoh K., Ishida M., Taguchi R., Arai H., Inoue K. 2001. Phosphatidylserine-specific phospholipase A1 stimulates histamine release from rat peritoneal mast cells through production of 2-acyl-1-lysophosphatidylserine. J. Biol. Chem. 276: 29664–29670. [DOI] [PubMed] [Google Scholar]
- 16.Aoki J., Taira A., Takanezawa Y., Kishi Y., Hama K., Kishimoto T., Mizuno K., Saku K., Taguchi R., Arai H. 2002. Serum lysophosphatidic acid is produced through diverse phospholipase pathways. J. Biol. Chem. 277: 48737–48744. [DOI] [PubMed] [Google Scholar]


