Supplemental Digital Content is available in the text.
Key Words: ageing, health service utilization, chronic disease, ecological fallacy, longitudinal analysis
Abstract
Objective:
To examine the relationship between age and all-cause hospital utilization in the years preceding and following a diagnosis in hospital of heart failure, type 2 diabetes, or chronic obstructive pulmonary disease (COPD).
Research Design:
A cohort study of all patients in Western Australia who have had a principal diagnosis of heart failure, type 2 diabetes, or COPD, upon admission to hospital. All-cause hospital utilization 6 years preceding and 4 years following cardinal events, that is, a disease-specific diagnosis upon hospital admission, where such an event has not occurred in the previous 2 years, are examined in specific age groups.
Results:
Six years preceding a cardinal event, all-cause emergency department (ED) presentations are similar in all age groups, from under 55 to over 85 years of age, except in COPD where ED presentation rates are higher in younger groups. All-cause hospital inpatient days are transiently higher in the years preceding and following a cardinal event in older age groups, yet return to similar levels across all age cohorts after 4 years. ED presentations are significantly higher in the 4 years following cardinal events in younger compared with older groups.
Conclusions:
Longitudinal analysis of utilization around cardinal events overcomes the confounding effect of differences in chronic disease rates between age groups, avoiding a source of ecologic bias that erroneously attributes increasing utilization in individuals with chronic disease to age. Programs designed to reduce hospital demand in patients with chronic disease should possibly focus on younger, rather than older, individuals.
Chronic disease is a significant source of health care demand.1,2 It has been suggested that 78% of health spending is among patients with chronic disease.1 The incidence of chronic diseases increase with age, in particular heart failure, type 2 diabetes, and chronic obstructive pulmonary disease (COPD).1 Health economists are endeavoring to model future health costs in light of observed population ageing and changing patterns of morbidity.3,4 Understanding the interaction between age, chronic disease, and health care demand is important in planning cost-effective clinical service delivery, preventative health care, and projecting future health care costs.
In developed countries, the average per capita health care expenditure for those over 65 years old is 2–8 times higher than younger age groups.5,6 Expenditures have been predicted to increase significantly in developed countries, including the United States, Australia, and Europe, based on models that assume age-specific cohort demand costs remain fixed along with expected population ageing.7–10 However, projections based on such models have proven unreliable.3 It has been speculated that changes in morbidity and mortality rates may be influencing costs associated with ageing.3,4 Other factors, such as the introduction of new treatments, technologies, and price inflation, may influence the reliability of such projections.3
Hospital demand, in terms of inpatient days and emergency department (ED) presentations, significantly contribute to health costs and older cohorts use relatively more of these services.5,11–13 It is widely believed that an individual’s increasing age correlates with increasing hospital demand, and this is reflected in health policy and planning.8,10,11,14 However, the actual relationship between an individual’s age and their hospital demand is poorly understood.3,15 This study examines hospital demand before and after a fixed reference point in the progression of 3 common chronic diseases using longitudinal modeling.
METHODOLOGY
Ethics Statement
Ethical approval for this study was provided by the Department of Health Western Australia Human Research Ethics Committee and the University of Western Australia Human Research Ethics Committee. Informed consent was not sought and all data were analyzed anonymously.
Study Population
Data were extracted from the Western Australian (WA) Data Collections, including the Hospital Morbidity, Emergency, and Mortality datasets. This dataset included all records from all public and private hospitals in WA, linked using a combination of probabilistic matching of identifying variables and clerical review.16 All records (for any diagnosis or procedure) between 2002 and 2010 (inclusive) were obtained, for patients who had ever had a principal diagnosis on admission with ICD-10-AM diagnosis codes E11 (“type 2 diabetes mellitus,” excluding E11.39 “type 2 diabetes mellitus with other specified ophthalmic complication,” hereafter referred to as “type 2 diabetes”), I50 (“heart failure,” hereafter referred to as “heart failure”), and J44 (“other chronic obstructive pulmonary disease,” ie, excluding emphysema, hereafter “COPD”).
Records for individuals identified as Aboriginal or Torres Strait Islander (ATSI) (3.7% of the WA population17) were excluded from the analysis due to statistically significantly different distributions of age at diagnosis, rate of hospitalization, and mortality (data not shown).
Definition of Cardinal Event
“Cardinal events” were defined as the first day of an admission to hospital (not including ED visits that did not result in an admission) associated with a particular principal (and not additional) diagnosis code, where the same principal diagnosis was not associated with an admission by that patient in the previous 2 years. This definition excluded all admissions in 2002 and 2003, as admissions in these years could not be identified using these criteria. This resulted in a “rolling” 2-year clearance period. Cardinal events after 2008 were excluded to allow sufficient time (2009 and 2010) for subsequent events to be recorded within the WA Data Collections, as records enter the database after discharge. A minority of individuals had multiple events (2 and, rarely, 3 such events with the same diagnosis) occurring in the 5-year study period (see the Results section).
Statistical Analysis
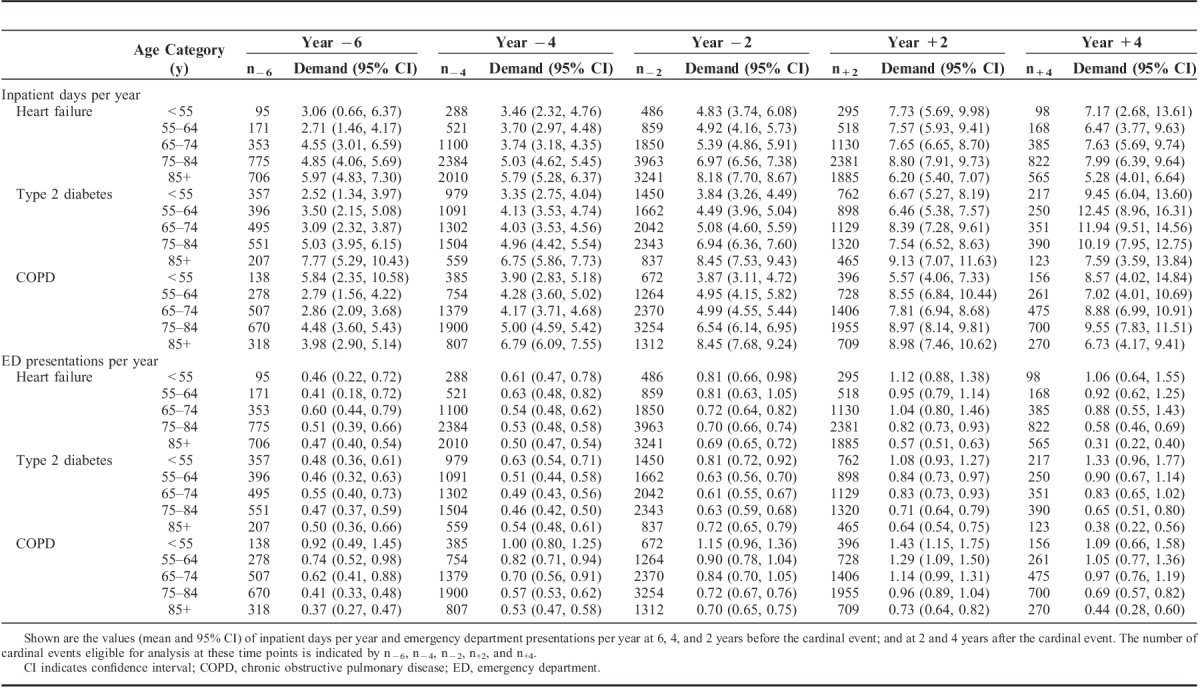
Patient data before and after a cardinal event were aligned using the day of the cardinal event as time zero. Because of this alignment, the number of person-days contributing to the denominator value (n) changed with time. The day of entry into the monitored data period, and the day of leaving the monitored data period, varied between different cardinal events. The dataset is therefore both right and left censored, that is, patients may not have data for the full 6 years before or 4 years after the cardinal event (Table 1). Patients who died during the follow-up period are left in this analysis, as the net hospital demand associated with cardinal events is being examined, not merely the utilization of surviving patients. This approach is similar to that used previously to examine longitudinal demand.18 Therefore, it should be kept in mind that following the cardinal event, data from both surviving individuals (and thus potentially using services) and those who have died are included.
TABLE 1.
Longitudinal Analysis of Inpatient Days Per Year and ED Presentations Around Cardinal Events
Admissions to hospital (including transfers) were linked to form an inpatient history (while retaining inpatient days actually used), with leave days (ie, where the patient temporarily leaves the hospital but has not been discharged, occurring in <2% of admissions) being excluded. Similarly, an ED presentation history was prepared. Daily hospital utilization was calculated as the number ED presentations or inpatient days (calculated and presented separately in the Results section) in the numerator divided by person-days in the denominator on a given day. The level of missing data (ie, where individuals are not present in WA) can be estimated by considering that, during the study period, 2.7% of the population emigrated from WA each year, whereas 4.0% of the population immigrated into WA each year.17
Hospitalizations with a principal diagnosis code of dialysis were removed from the analysis to avoid bias from such events. Same-day admissions for dialysis were associated with approximately 40% of all admissions in our study population, but were associated with only 0.5% of all patients (data not shown). It is worth noting that Australia is unusual in counting extracorporeal dialysis as an inpatient day.
Nonparametric regression was used, based on locally weighted polynomial regression19 (LOESS), to provide an accurate estimate of mean hospital utilization (as measured separately by either ED presentations or inpatient days), excluding a 2-week time window before and after the cardinal event. This allowed 95% confidence intervals (CI) to be simply generated using bootstrap techniques. LOESS combines the simplicity of least squares regression with the flexibility of nonlinear regression. Simple models are fitted to localized subsets of the data to build a curve that describes the variation in the data. This method does not require a global function or any assumption of form to fit a model to the data (see Supplemental Digital Content 1, http://links.lww.com/MLR/A795).
Estimates were displayed for the period up to 31 days before, and for the period beginning 31 days following, the cardinal event. The LOESS function (stats package in the R Statistical Graphics version 2.15.3 software20) was used to fit a kernel-weighted, polynomial regression with a second-order polynomial, with a Gaussian kernel with a span of 1.4 and weights equal to the denominator value on each day. The span was chosen by eye to balance bias (an over-smoothed curve) against variance (a curve that “chases the points”). The 95% confidence limits were calculated using a bootstrap function (bootobject and boot.ci functions from the boot package in R20). A total of 5000 bootstrap replicates were used (sampling with replacement) and 95% confidence limits were obtained using the bootstrap percentile method.21
To examine the period excluded from the analysis above, the total number of ED presentations and inpatient days were calculated for 3 periods relative to a cardinal event: “around event,” which is between −30 and +30 days, “before event,” which is between −31 days and −6 years; and “after event,” which is between +31 days and +4 years. The 95% CI for the hospitalization rates were calculated using the bootstrap percentile interval, using 1000 replicates sampled with replacement.21,22
Patient survival after a cardinal event was modeled using PROC LIFETEST in SAS version 9.3. The number of additional diagnoses associated with cardinal events was modeled using PROC GENMOD and a negative binomial distribution in SAS version 9.3.
RESULTS
Cardinal Events by Age Group
The total number of cardinal events examined is 27,605. Overwhelmingly, only a single cardinal event for each diagnosis type can be identified for any individual within the time period examined, with the percentage of individuals experiencing 2 cardinal events associated with heart failure, type 2 diabetes, and COPD being 4%, 3%, and 6% respectively. Less than 5 individuals experienced a third cardinal event. No association between age group and frequency of repeat cardinal events is observed (data not shown). Multiple cardinal events for the same individual are included in this analysis. Excluding such events did not significantly alter the analysis shown below (data not shown). Shown in Figure 1 are the number of cardinal events in the age groups <55, 55–64, 65–74, 75–84, and 85 and older.
FIGURE 1.
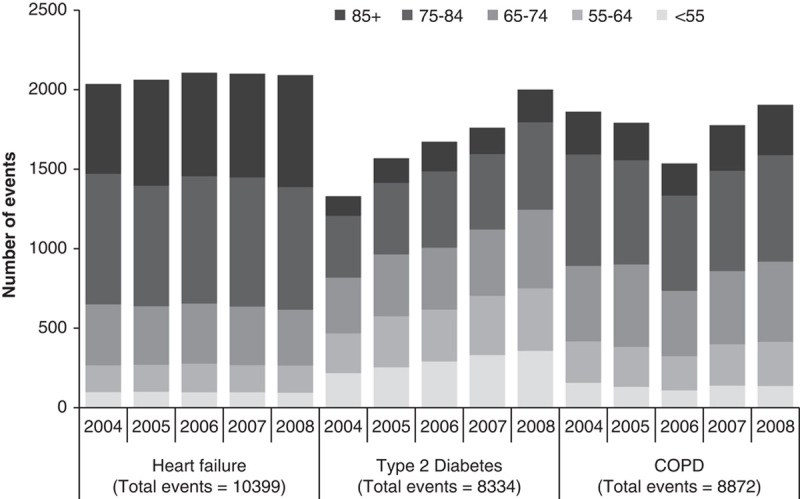
Number of cardinal events by age and year. Shown are the numbers of cardinal events by year for associated with primary diagnoses of heart failure, type 2 diabetes, and COPD. The x-axis is marked by year and diagnosis group, the y-axis in number of cardinal events. Each bar is divided by age group and the total number for all age groups is indicated.
Survival
Disease event cohorts were divided into age groups, according to the age at which the cardinal event occurs. Survival 4 years after a cardinal event in oldest age groups is the lowest (<25% in the over 85 age group), and highest in the youngest group (>80% in the under 55 age group) (Figs. 2A–C). Log-rank tests of equality over age strata demonstrated that age groups overall have significantly different survival rates (P<0.0001). Note that no adjustment has been made for the small percentage of patients represented more than once.
FIGURE 2.
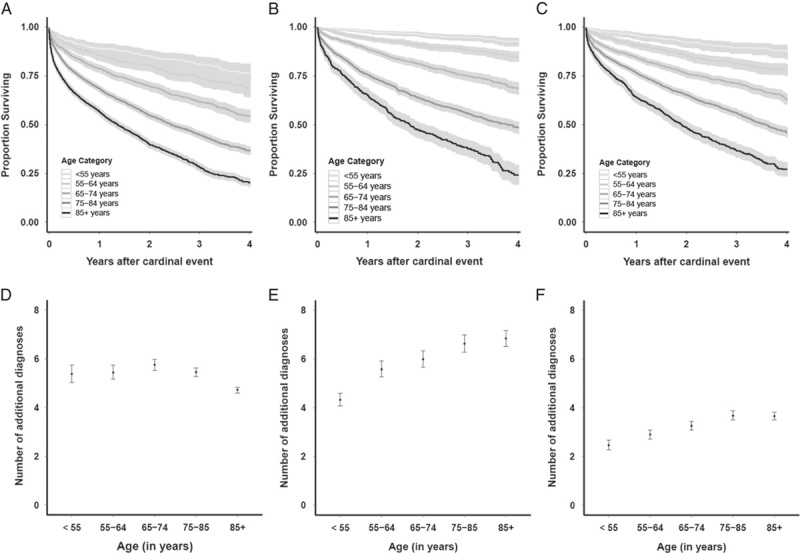
Survival after cardinal events and number of additional diagnoses. Shown are the survival rates after cardinal events associated with heart failure (A), type 2 diabetes (B), and COPD (C). The x-axis is marked with years after a cardinal event, y-axis with proportion of individuals surviving. Lines represent survival curves for the following age groups (from light gray to dark gray as indicated): <55, 55–64, 65–74, 75–84, and 85+ years. The black central curve indicates the survival rates, and the gray upper and lower curves are the 95% CI. Below is shown the number of additional diagnoses (both estimate and 95% CI) at the time of cardinal event associated with heart failure (D), type 2 diabetes (E), and COPD (F). CI indicates confidence interval; COPD, chronic obstructive pulmonary disease.
Additional Diagnoses
Cardinal events are defined using a principal diagnosis of heart failure, type 2 diabetes, or COPD. However, up to 20 additional diagnoses are scored. As shown in Figure 2D, the number of additional diagnoses in heart failure cardinal events are similar in all age groups (between 5 and 6), except those 85 and over, who had fewer. In both type 2 diabetes (Fig. 2E) and COPD (Fig. 2F), cardinal events in older groups are associated with an increasing number of additional diagnoses.
Interaction of Demand With Age
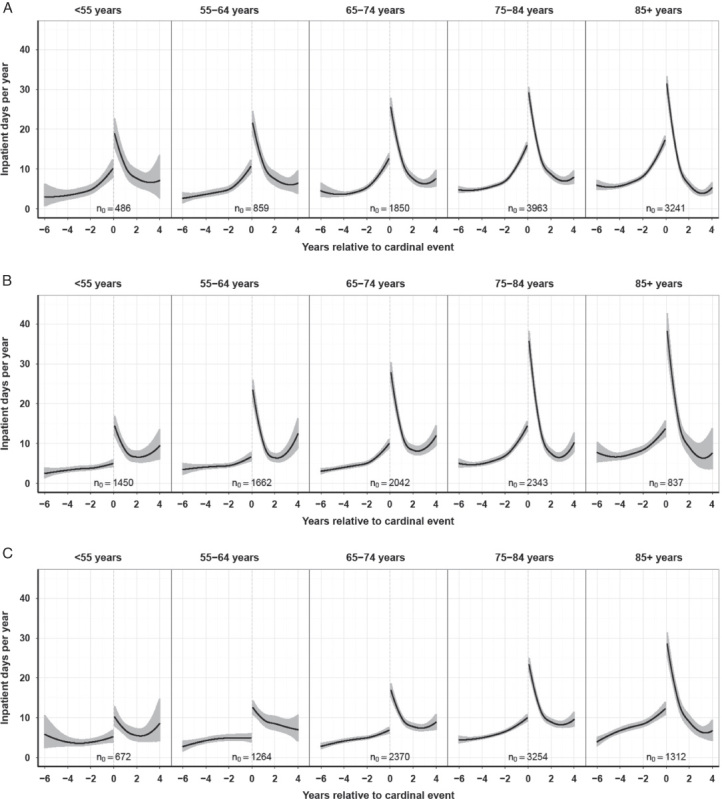
Longitudinal hospital utilization (defined as inpatient days or ED presentations) associated with cardinal events is shown in Figure 3. The period examined is from 6 years before the cardinal event, to 4 years following. Estimates are displayed for the period up to 31 days before the cardinal event, and for the period beginning 31 days following the cardinal event.
FIGURE 3.
(Continued)
In Figure 3A and Table 1, inpatient days per year associated with cardinal events in heart failure are shown. Some statistically significant differences are observed between different age groups at different time points. For example, at 6 years before the cardinal event, inpatient days per year are 5.97 (95% CI, 4.83–7.30) in the 85 years old and over group, whereas only 2.71 (95% CI, 1.46–4.17) in the 55–64 years old group. Generally, before the cardinal event, inpatient days per year are higher in older groups. However, 2 years following a cardinal event, inpatient days per year are lower in the 85 years old and over group (6.2, 95% CI, 5.4–7.07) compared with the 75–84 years old group (8.8, 95% CI, 7.91–9.73). Notwithstanding these differences, in general the 95% confidence bands around mean inpatient days per year tend to overlap. This may reflect a lack of power in our analysis. However, the large sample size of our analysis (ranging from 95 to 3963 data points in the units of analysis) suggests that the relationship between age and inpatient days per year may be a relatively weak one.
In Figure 3B and Table 1, inpatient days per year associated with cardinal events in type 2 diabetes are shown. Statistically significant differences in inpatient days per year are observed between age groups 6 years before the event. However, with the exception of the over 85s group, these differences are small, with all age groups using between 2.5 and 5 inpatient days per year at this time. In older age groups, there is an elevation in inpatient days in the years immediately preceding and following the cardinal event. However, this effect is transient and no significant differences can be shown between age groups 4 years after the event.
In COPD, inpatient days per year associated with cardinal events are similar in all age groups at 6 years before and at 4 years after the event (Fig. 3C and Table 1). Consistently in older age groups there is an elevation in inpatient days in the years immediately preceding and following the cardinal event. However, this effect is transient and no significant differences can be shown between age groups 4 years after the event.
In heart failure, while ED presentations associated with cardinal events are similar in all age groups before the event, such presentations are higher in younger groups following the event (Fig. 3D and Table 1). ED presentation rates 4 years following a cardinal event were 1.06 ED presentations per year in under 55s (95% CI, 0.64–1.55) and 0.31 per year (95% CI, 0.22–0.40) in the group 85 years of age and over.
FIGURE 3.
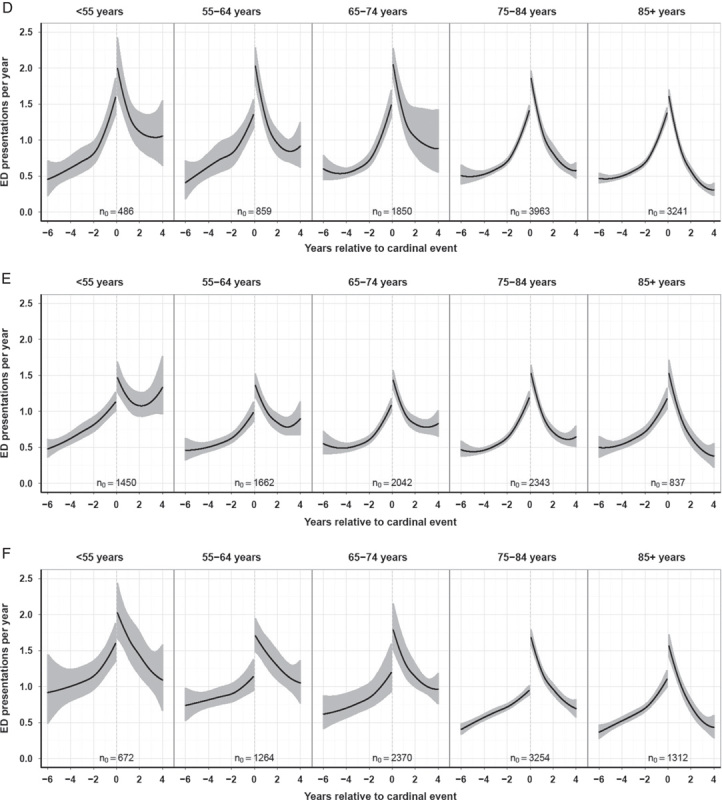
Longitudinal analysis demand around cardinal events. Shown are the inpatient days per year (A–C) and ED presentations per year (D–F) associated with heart failure, type 2 diabetes, and COPD cardinal events in 5 age groups: <55, 55–64, 65–74, 75–84, and 85+ years. The cardinal event in each group occurs at the point on the x-axis, where “0” is indicated. Six years data before to 4 years data after the event is shown. n0 values indicate the number of cardinal events represented at time zero, that is, the day of the cardinal event. The black central curve indicates the line of best fit, and the gray upper and lower curves are the 95% CI. Heart failure (A, D), type 2 diabetes (B, E), and COPD (C, F). CI indicates confidence interval; COPD, chronic obstructive pulmonary disease; ED, emergency department.
In type 2 diabetes, while ED presentations associated with cardinal events are similar in all age groups before the event, such presentations are higher in younger groups following the event (Fig. 3E and Table 1). ED presentation rates 4 years following a cardinal event are 1.33 ED presentations per year in under 55s (95% CI, 0.96–1.77) and 0.38 per year (95% CI, 0.22–0.56) in the group 85 and over years of age.
In COPD, ED presentations 6 years before a cardinal event are higher in younger groups (Fig. 3F and Table 1). ED presentation rates at this time are 0.92 ED presentations per year in under 55s (95% CI, 0.49–1.45) and 0.37 per year in over 85s (95% CI, 0.27–0.47). ED presentation rates 4 years following a cardinal event are 1.09 ED presentations per year in under 55s (95% CI, 0.66–1.58) and 0.44 per year in the group 85 and over years of age (95% CI, 0.28–0.60).
Total Utilization Across Periods
The above analysis excludes utilization in the period around the cardinal event, from 30 days before to 30 days after the event. To examine this, total number of ED presentations and inpatient days were separately calculated for 3 periods relative to a cardinal event: “around event,” “before event,” and “after event,” in Figure 4 (the estimate and 95% CI values are detailed in Table, Supplemental Digital Content 2, http://links.lww.com/MLR/A796).
FIGURE 4.
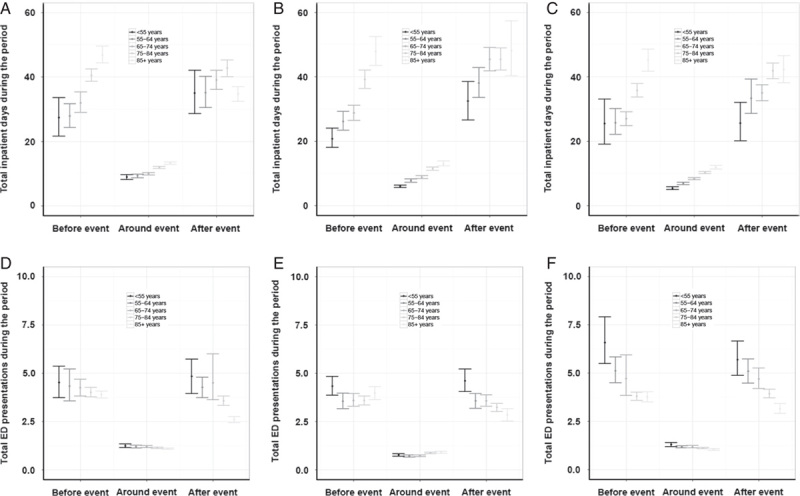
Total inpatient days and ED presentations around a cardinal event by age group. Shown are the total mean number of inpatient days and ED presentations associated with a heart failure (A and D), type 2 diabetes (B and E), or COPD (C and F) cardinal event. The mean and 95% CI are indicated for 5 age groups: <55, 55–64, 65–74, 75–84, and 85+ years. “Before event” indicates the period 6 years before to the event (up to 31 d before the event), “around event” indicates the period around the event (from day −30 to day +30), and “after event” indicates the 4 years after the event (from +31 d onward). Inpatient days (A–C) and the total mean number of ED presentations (D–F) are shown. CI indicates confidence interval; COPD, chronic obstructive pulmonary disease; ED, emergency department.
Approximately 85%–90% of inpatient demand and ED presentations occur outside the clearance period around the cardinal event. In all conditions, total inpatient days used across all periods is higher in older age groups. The total number of ED presentations in these periods are either similar across all age groups (ie, heart failure and type 2 diabetes in the periods before and around the clearance events), or higher in younger groups than older groups.
DISCUSSION
Using aligned cardinal events, we examined the longitudinal association between a first admission in 2 years for a chronic disease on antecedent and subsequent all-cause hospital utilization. We demonstrate that in the 6 years before a cardinal event in chronic disease, inpatient days per year are associated with increasing age. However, this relationship is weaker than expected. In the 4 years following a cardinal event, age is a weak and transient predictor of inpatient days. Before a cardinal event, ED presentations are similar across age groups, except in COPD, where younger groups had more ED presentations. Following a cardinal event, increasing age is associated with decreasing ED demand. We excluded 60 days around the cardinal event to produce the smoothed utilization curves. It could be argued that most hospital utilization would occur around the cardinal event. However, 85%–90% of the demand occurs outside of this 60-day period.
Individual data are left in the analysis even if a patient has died. The overall health service utilization over 10 years of patients diagnosed with chronic disease is being examined, regardless of whether an individual dies or survives. This analysis is concerned with determining which patients use the most hospital services, in order to guide clinical intervention. Clinical interventions only occur when a patient is alive. By definition, all patients are alive up to the day of the cardinal event, and it is this cohort that is being examined. Future death does not remove them from the cohort relevant to determination of utilization in future years.
It is known that the mean hospital utilization per capita in older groups is higher than younger groups.5,11–13 On the basis of this observation, it has been concluded that older individuals use more services than younger individuals.8,10,11,14 However, such a conclusion is susceptible to the ecological fallacy.23,24 That is, where there is heterogeneity between subgroups in hospital utilization, the mean may not reflect the actual utilization of individuals in those subgroups. An important subgroup is those with chronic disease, as the majority of health spending occurs among those with chronic disease.1,2 When this subgroup is examined, we find that young cohorts have higher mean ED presentations than older groups, following a cardinal event in chronic disease. Furthermore, older groups only transiently use more days in hospital than younger groups. Six years before a cardinal event in chronic disease, all age groups are utilizing EDs at similar rates (except for higher rates of ED presentations in the young with COPD). That our findings are so remarkably consistent for such a large cohort in 3 of the most common chronic diseases, each affecting separate body systems, we suggest that such a relationship is the rule, rather than the exception. This suggests that the higher mean hospital utilization in older age groups is largely driven by the higher incidence of chronic disease, rather than higher utilization in older individuals with chronic disease.
Severity of chronic disease may vary between different age groups. We examined the number of additional diagnoses associated with cardinal events, as comorbidity would be associated with increasing illness. In type 2 diabetes and COPD, increasing age was associated with more additional diagnoses. Heart failure patients have similar numbers of additional diagnoses in all age groups, except the oldest. However, hospital utilization among different chronic disease patient groups will also be driven by disease severity that cannot be easily determined using administrative data collections. Furthermore, perceptions and decisions of patients and their health care providers will impact upon utilization between age groups.
Implications for Policy and Practice
These findings contradict the policy and planning programs designed to reduce hospital utilization by targeting patient over 65 years of age. Although there may be economies of scale in focusing chronic disease programs on the elderly, the group of younger people with chronic disease is not insignificant, with 20% of patients with chronic disease in our cohort being under 65. Survival rates of younger cohorts and the life-long nature of chronic disease suggests that this younger group is likely to benefit from programs to reduce hospitalizations and ED presentations. To exclude this group from an intervention designed to target chronic disease because it is thought that this group is insignificant in size, or in contribution to hospital demand, is clearly erroneous. However, most, if not all, chronic disease management programs seem to make this error.8–13,25,26 Interventions designed to reduce inpatient demand in the short term around admissions with chronic disease might focus on older age groups, as demand around such events are transiently higher in older age groups.
Current policy and programs designed to reduce ED demand focus on older age individuals.12,13,18,25,26 Programs designed to avoid ED demand after an admission to hospital with chronic disease should possibly focus on younger rather than older patients.
ATSI People
ATSI people were excluded from our analysis. ATSI people are 3.7% of the population of Australia,17 and behave as a distinct group in the use of health services. The health of ATSI people in Australia represents one of the largest health inequities in the developed world.27 We are preparing a separate paper examining this population. The inclusion of this group in this analysis would significantly reduce the generalizability outside Australia.
Implications for Wider Cost Analyses
Our analysis focuses on inpatient days and ED presentations. This does not reflect differences in costs associated with inpatient days and ED presentations between groups, nor nonhospital-based costs. However, our methodology of longitudinally examining all-cause demand associated with significant events in individuals could be similarly applied to an analysis of actual costs in other areas of expenditure such as pharmaceutical use and diagnostic tests.
CONCLUSIONS
Longitudinal analysis of utilization around cardinal events overcomes the confounding effect of differences in chronic disease rates between age groups, avoiding a source of ecologic bias that erroneously attributes increasing utilization in individuals with chronic disease to age. Among individuals with chronic disease, younger individuals often use more services than older individuals. This improves modeling of future health care demand and informs preventative programs and targeted interventions designed to reduce morbidity and hospital utilization. Finally, programs designed to avoid hospital demand after an admission to hospital with chronic disease should possibly focus on younger, rather than older, individuals.
Footnotes
Supplemental Digital Content is available for this article. Direct URL citations appear in the printed text and are provided in the HTML and PDF versions of this article on the journal's Website, www.lww-medicalcare.com.
Supported by the Department of Health Western Australia.
The authors declare no conflict of interest.
REFERENCES
- 1.Anderson G, Horvath J. The growing burden of chronic disease in America. Public Health Rep. 2004;119:263–270 [DOI] [PMC free article] [PubMed] [Google Scholar]
- 2.Beaglehole R, Bonita R, Horton R, et al. Priority actions for the non-communicable disease crisis. Lancet. 2011;377:1438–1447 [DOI] [PubMed] [Google Scholar]
- 3.Payne G, Laporte A, Deber R, et al. Counting backward to health care’s future: using time-to-death modeling to identify changes in end-of-life morbidity and the impact of aging on health care expenditures. Milbank Q. 2007;85:213–257 [DOI] [PMC free article] [PubMed] [Google Scholar]
- 4.Caley M, Sidhu K. Estimating the future healthcare costs of an aging population in the UK: expansion of morbidity and the need for preventative care. J Public Health. 2011;33:117–122 [DOI] [PubMed] [Google Scholar]
- 5.CMS (Centers for Medicare and Medicaid Services). Personal Health Care Expenditures by Age: 1987-2004. 2006Washington, DC: US Department of Health and Human Services; Available at: http://www.cdc.gov/nchs/data/hus/2010/127.pdf. Accessed November 12, 2013 [Google Scholar]
- 6.Australian Institute of Health and Welfare (AIHW). Health System Expenditure on Disease and Injury in Australia, 2004-05. Contract No.: Cat. no. HSE 87. 2010Canberra: AIHW; Available at: http://www.aihw.gov.au/WorkArea/DownloadAsset.aspx?id=6442457087. Accessed November 12, 2013 [Google Scholar]
- 7.Centers for Medicare and Medicaid Services (CMS). National Health Expenditures Projections 2011. 2012Washington, DC: CMS; Available at: http://www.cms.gov/Research-Statistics-Data-and-Systems/Statistics-Trends-and-Reports/NationalHealthExpendData/Downloads/Proj2011PDF.pdf. Accessed November 12, 2013 [Google Scholar]
- 8.Productivity Commission 2005. Economic Implications of an Ageing Australia, Research Report. 2005Canberra: Productivity Commission 2005; Available at: http://www.pc.gov.au/__data/assets/pdf_file/0006/13587/ageing1.pdf. Accessed November 12, 2013 [Google Scholar]
- 9.Goss J. Projection of Australian health care expenditure by disease, 2003 to 2033. Cat. no. HWE. 43. 2008Canberra: AIHW; Available at: http://www.aihw.gov.au/WorkArea/DownloadAsset.aspx?id=6442457498. Accessed November 12, 2013 [Google Scholar]
- 10.Directorate-General for Economic and Financial Affairs of the European Commission. The 2012 Ageing Report: Underlying Assumptions and Projection Methodologies. 2012Brussels: European Commission; Available at: http://ec.europa.eu/economy_finance/publications/european_economy/2012/pdf/ee-2012-2_en.pdf. Accessed October 16, 2013 [Google Scholar]
- 11.Banks G. Health Costs and Policy in an Ageing Australia. 2008Canberra: Productivity Commission: Australian Government; Available at: http://www.pc.gov.au/__data/assets/pdf_file/0011/81758/cs20080701-agedhealthpolicy.pdf. Accessed November 12, 2013 [Google Scholar]
- 12.Samaras N, Chevalley T, Samaras D, et al. Older patients in the emergency department: a review. Ann Emerg Med. 2010;56:261–269 [DOI] [PubMed] [Google Scholar]
- 13.Roland M, Abel G. Reducing emergency admissions: are we on the right track? BMJ. 2012;18:e6017. [DOI] [PubMed] [Google Scholar]
- 14.de Boer AGEM, Wijker W, de Haes HCJM. Predictors of health care utilization in the chronically ill: a review of the literature. Health Policy. 1997;42:101–115 [DOI] [PubMed] [Google Scholar]
- 15.Australian Institute of Health and Welfare (AIHW). Australian Hospital Statistics 2010-11. Contract No.: Cat. no. HSE 117. 2012Canberra: AIHW; Available at: http://www.pc.gov.au/__data/assets/pdf_file/0011/81758/cs20080701-agedhealthpolicy.pdf. Accessed November 12, 2013 [Google Scholar]
- 16.Holman CD, Bass AJ, Rouse IL, et al. Population-based linkage of health records in Western Australia: development of a health services research linked database. Aust N Z J Public Health. 1999;23:453–459 [DOI] [PubMed] [Google Scholar]
- 17.Australian Bureau of Statistics (ABS). Australian Historical Population Statistics, 2008 cat. no. 3105.0.65.001. 2008Canberra: ABS; Available at: http://www.abs.gov.au/AUSSTATS/abs@.nsf/Lookup/3105.0.65.001Explanatory%20Notes12008. Accessed November 12, 2013 [Google Scholar]
- 18.Roland M, Dusheiko M, Gravelle H, et al. Follow up of people aged 65 and over with a history of emergency admissions: analysis of routine admission data. BMJ. 2005;330:289–292 [DOI] [PMC free article] [PubMed] [Google Scholar]
- 19.Cleveland WS, Grosse E, Shyu WM.Chambers JM, Hastie TJ. Local regression models. Statistical Models in S. 1992New York: Chapman & Hall [Google Scholar]
- 20.R Development Core Team. R: A Language and Environment for Statistical Computing. 2013Vienna, Austria: Foundation for Statistical Computing; Available at: http://www.R-project.org/. Accessed October 16, 2013 [Google Scholar]
- 21.Davison A, Hinkley D. Bootstrap Methods and Their Application. 1997Cambridge, NY: Cambridge University Press [Google Scholar]
- 22.Canty A, Ripley B. Bootstrap functions. CRAN, 2013. Available at: http://CRAN.R-project.org/. Accessed October 17, 2013]
- 23.Morgenstern H. Ecologic studies in epidemiology: concepts, principles, and methods. Annu Rev Public Health. 1995;16:61–81 [DOI] [PubMed] [Google Scholar]
- 24.Sedgwick P. The ecological fallacy. BMJ. 2011;343:d4670. [DOI] [PubMed] [Google Scholar]
- 25.Seshamani M, Gray A. A longitudinal study of the effects of age and time to death on hospital costs. J Health Econ. 2004;23:217–235 [DOI] [PubMed] [Google Scholar]
- 26.Hastings SN, Horney C, Landerman LR, et al. Exploring patterns of health service use in older emergency department patients. Acad Emerg Med. 2010;17:1086–1092 [DOI] [PubMed] [Google Scholar]
- 27.House of Representatives Standing Committee on Family and Community Affairs. Report on the Inquiry into Indigenous Health. 2013Canberra: House of Representatives Standing Committee on Family and Community Affairs; Available at: http://www.aph.gov.au/parliamentary_business/committees/house_of_representatives_committees?url=fca/indhea/inqinde2.htm. Accessed November 12, 2013 [Google Scholar]


