

Abstract
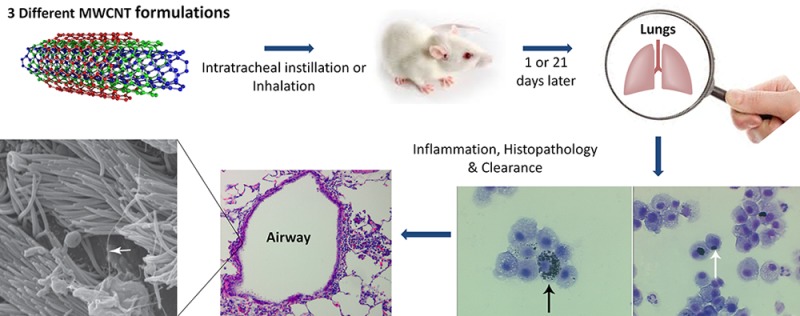
Inhaled multiwalled carbon nanotubes (MWCNTs) may cause adverse pulmonary responses due to their nanoscale, fibrous morphology and/or biopersistance. This study tested multiple factors (dose, time, physicochemical characteristics, and administration method) shown to affect MWCNT toxicity with the hypothesis that these factors will influence significantly different responses upon MWCNT exposure. The study is unique in that (1) multiple administration methods were tested using particles from the same stock; (2) bulk MWCNT formulations had few differences (metal content, surface area/functionalization); and (3) MWCNT retention was quantified using a specialized approach for measuring unlabeled MWCNTs in rodent lungs. Male Sprague–Dawley rats were exposed to original (O), purified (P), and carboxylic acid functionalized (F) MWCNTs via intratracheal instillation and inhalation. Blood, bronchoalveolar lavage fluid (BALF), and lung tissues were collected at postexposure days 1 and 21 for quantifying biological responses and MWCNTs in lung tissues by programmed thermal analysis. At day 1, MWCNT instillation produced significant BALF neutrophilia and MWCNT-positive macrophages. Instilled O- and P-MWCNTs produced significant inflammation in lung tissues, which resolved by day 21 despite MWCNT retention. MWCNT inhalation produced no BALF neutrophilia and no significant histopathology past day 1. However, on days 1 and 21 postinhalation of nebulized MWCNTs, significantly increased numbers of MWCNT-positive macrophages were observed in BALF. Results suggest (1) MWCNTs produce transient inflammation if any despite persistence in the lungs; (2) instilled O-MWCNTs cause more inflammation than P- or F-MWCNTs; and (3) MWCNT suspension media produce strikingly different effects on physicochemical particle characteristics and pulmonary responses.
Keywords: pulmonary toxicity, inflammation, engineered nanomaterial, inhalation exposure, multiwalled carbon nanotube (MWCNT)
Due to their extremely small size, airborne engineered nanomaterials (ENMs) can reach the deepest portions of the lung when inhaled and potentially move into systemic circulation.1 One such ENM2 is the carbon nanotube (CNT), which is highly marketable because of its unusual tensile strength, thermal conductivity, electrical properties, and broad commercial applications. Of particular concern, CNTs have similar properties to disease-causing asbestos fibers (e.g., high aspect ratio, large surface area, and poor solubility). Toxicology studies using rats and mice have shown that exposure to multiwalled carbon nanotubes (MWCNTs) resulted in not only pulmonary inflammation and fibrosis3 but also cancerous lesions consistent with mesothelioma.4 This may be the result of MWCNTs eliciting frustrated phagocytosis in exposed cells.5,6 In this process, phagocytic cells fail to fully engulf target particles and instead release their internal degradative enzymes into the interstitium, causing damage to nearby host cells, inflammation, and, over time, fibrotic lesions. MWCNTs are currently being produced on a grand scale (>4000 t/year worldwide)7 and sold at a significantly lower price than the single-walled variety (SWCNTs). Because MWCNTs are expected to be biopersistent,8,9 as more particles enter the ecosystem, the risk of exposure could increase over time.
Due to the disproportionate lack of in vivo studies and the vast heterogeneity of MWCNTs, investigations into specific administration methods and CNT formulations are needed to better understand the parameters that best correlate to human compatibility/toxicity in the animal model. To be specific, few studies have investigated the relationships among (a) MWCNT toxicity in vivo (dose and recovery over time), (b) administration techniques [e.g., intratracheal instillation (IT) vs inhalation], and (c) particle physicochemical characteristics (e.g., metal content and hydrophilicity) altogether. Fewer have actually quantified the clearance of different MWCNTs in tissues postexposure.10,11 This study is one of few to take a comprehensive, holistic approach to evaluating and quantifying responses postexposure to MWCNTs. Main factors (dose, time, physicochemical characteristics, and administration method) shown separately in previous publications to affect MWCNT retention and/or toxic responses in vivo and/or in vitro were considered, and MWCNT formulations from the same batch were used to compare/contrast findings. By considering all the aforementioned factors and controlling the MWCNT variability, confounders that can influence differential findings across laboratories and/or across studies within the same laboratory were eliminated. This study is also one of the few to quantify unlabeled MWCNTs in exposed animal tissues and the only to quantify unlabeled F-MWCNTs using programmed thermal analysis (PTA). Because of their organic nature, MWCNTs are rarely ever quantified in tissues postexposure, and this is one reason that pharmacokinetic data are sorely missing in the literature (especially with respect to unlabeled MWCNTs).
We aimed to determine how the particular factors of dose, time, physicochemical characteristics, and administration method modulate pulmonary inflammation, cellular injury, and particle clearance/retention in Sprague–Dawley (SD) rats after exposure to various formulations of engineered MWCNTs. Three formulations of MWCNTs were tested by IT: original (O), purified (P), and carboxylic acid functionalized (F). To determine the dose–response effect, rats were instilled with MWCNTs (0, 10, 50, or 200 μg) suspended in a biocompatible dispersion media (DM).12
In separate experiments, animals were exposed via inhalation for a single 6 h period (approximating the 200 μg instilled dose) to O-, P-, or F-MWCNTs in DM, or to F-MWCNTs in water. Inhalation studies with F-MWCNTs in water were completed first because F-MWCNTs are readily dispersed in water for nebulization and show promise for use in thin films13 and nanopesticides,14 which are often applied as spray coatings. F-MWCNTs are also being studied for use in hydrogels for tissue engineering and/or drug delivery,15 and other medical applications,16 wherein O- and/or P-MWCNTs cannot be used due to either possible inherent toxicity and/or instability in aqueous suspensions. Nebulization of F-MWCNTs in water also enabled observation of postexposure biological responses uninfluenced by DM and thus a better approximation of occupational exposures.
Inhalation studies with MWCNTs suspended in DM were completed next for direct comparison to the instillation studies. The DM provides equivalent dispersion of engineered nanomaterials to bronchoalveolar lavage fluid (BALF) and stabilizes hydrophobic particles (like O- and P-MWCNTs) to decrease clumping and settling in suspension, but DM alone avoids added toxicity. Without added functional groups to sterically hinder O- and P-MWCNT agglomeration, bundles/aggregates and precipitation are more likely in the absence of DM.
For all studies, blood and BALF was collected at 1 or 21 days postexposure to assess lung total and differential cell counts, lactate dehydrogenase (LDH), and total protein for signs of inflammation, cell membrane damage, and lung permeability, as these analyses are common, relatively easy, and inexpensive to complete. MWCNT-laden macrophages (Mφ) were also quantified in BALF and imaged by transmission electron microscopy (TEM). Blood was collected to assess changes in complete blood count (CBC), and body weights were taken to assess potential systemic effects. Finally, lung tissues were collected to quantify particle retention and/or evaluate histopathological abnormalities such as increased cellular infiltrates, mucus production, and fibrosis.
Results and Discussion
Combining expertise in the fields of toxicology, molecular biology, engineering, chemistry, occupational exposure, and environmental sciences, the study described here tested multiple factors (dose, time, physicochemical characteristics, and administration method) shown previously to affect MWCNT toxicity in vivo and/or in vitro. Although there are merits to their respective methodologies, many in vivo MWCNT studies to date compare particles with many inherent differences and/or do not provide dosimetric measurements when correlating pulmonary toxicity and particle exposure. In fact, analytical quantification of MWCNTs in tissues is rarely done due to the difficulty in distinguishing the xenobiotic MWCNTs from eobiotic carbonaceous species in exposed biological matrices. Further, although the efficacy of high-throughput in vitro assays cannot be denied with respect to initial screening of potentially toxic ENMs, these studies often overlook the effects of the biological milieu and, therefore, should be succeeded by in vivo assessments. This study is unique in that (1) the IT dose range approximates doses equivalent to 1 week, 5 weeks, and 5 months in an occupational setting; (2) multiple administration methods were tested using particles from the same stock; (3) the different bulk MWCNT forms used had only a few, clearly defined differences (metal content, surface area, surface functionalization), making spurious correlations less likely; and (4) MWCNTs were quantified using a relatively new, specialized approach10,17 aimed at measuring various forms of unlabeled MWCNTs in rodent lungs. Previous studies have obtained preliminary hazard rankings for the MWCNTs tested here.3,18 Results from experiments aimed at expanding the knowledge of these MWCNT behaviors in vivo form the basis of this study.
Physicochemical Particle Characteristics
Bulk MWCNTs had typically high aspect ratios, a range of morphologies from straight to curled often appearing in tangled agglomerates, and no visible tube damage resulting from either purification or functionalization (Figure 1). O-MWCNTs had 4.49% and 0.76% of Ni and Fe residual catalyst, respectively, which was determined by energy dispersive X-ray spectroscopy (EDS) and confirmed by inductively coupled plasma mass spectrometry (ICP-MS).26 The same catalysts dropped to 1.8% and 0.08%, respectively, for P-MWCNTs and to nondetectable values for F-MWCNTs. Zeta potential measurements in water for O-, P-, and F-MWCNT were −14.5, −8.3, and −50.5, respectively, indicating high dispersibility for F-MWCNTs and unstable behavior for O- and P-MWCNTs at neutral pH. These values are similar to those reported previously for analogous CNTs.26,35,36 Brunauer–Emmett–Teller (BET) analysis of O-, P-, and F-MWCNTs showed surface areas of 182, 168, and 224 m2/g, respectively. According to Birch and colleagues,19 metal content, amorphous carbon impurities, acid purification, and surface functionalization all influence CNT surface area measurements by BET. Additional details on the physicochemical characterization of the MWCNTs have been presented elsewhere.26,36
Figure 1.
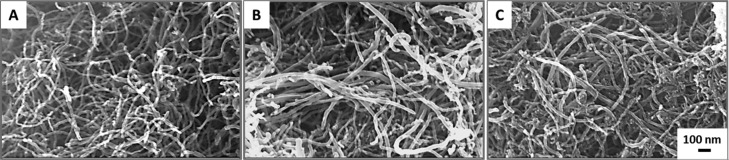
SEM images of all MWCNT formulations. From left to right (A–C): O-, P-, and F-MWCNTs. Outer diameter: 20–30 nm; inner diameter: 5–10 nm; length: 10–30 μm.
MWCNT Preparations for Dose–Response Instillation Studies
Suspension and probe sonication of MWCNTs in DM produced well-dispersed instillates in comparison to water. Although the primary length was 10–30 μm for all MWCNTs in dry bulk form, the hydrodynamic size of O-, P-, and F-MWCNTs in DM was generally less than 1 μm in length.
Aerosol Characterization: F-MWCNTs in Water
Gravimetric analyses showed that field blanks were clean. Over the course of the 6 h exposure to F-MWCNTs in water, cascade impactor samples showed concentrations averaged approximately 30 mg/m3. At this concentration, rats would have inhaled approximately 1.62 mg of F-MWCNTs during the 6 h period assuming they had a ventilation rate (V) = 0.15 L/min. Deposition is estimated to be at most 14%,20 which would suggest a maximum of approximately 227 μg of F-MWCNTs was deposited in the tracheobronchial and pulmonary regions altogether. This dose is comparable to the high (200 μg) dose from the IT experiments.
Aerosol droplet size varied (Figure S1) during the exposure to F-MWCNTs in water. Initially, approximately 80% of the particle mass impacted at the first stage [effective cutoff diameter (ECD) = 4.66 μm]. Later, particle mass evened out, depositing at ≤20% at each of the stages. For the latter case, the highest deposition occurred primarily at stages 1–4, corresponding to ECDs ranging from 4.66 to 1.62 μm. TEM of the nebulized MWCNTs showed a range of MWCNT sizes and morphologies. Aerosolized MWCNTs were a mixture of individual and agglomerated nanotubes, although the latter appeared most common in point-to-plane electrostatic precipitator (ESP) samples (Figure 2A) due to the sampling method.
Figure 2.

TEM Image of aerosolized F-MWCNTs captured by ESP. F-MWCNTs (white arrow) suspended in water (A) or dispersion media (B) deposited on TEM grids (black arrows) during inhalation exposures.
Aerosol Characterization: MWCNTs in DM
Field blanks were clean for all exposures involving MWCNTs suspended in DM. Operating at 10 L/min, with a 1 mg/mL suspension of O-, P-, or F-MWCTs in DM, the Heart nebulizer output was approximately 70 μL/min (nearly double that of F-MWCNTs in water, 38 μL/min), and the estimated MWCNT aerosol concentration was approximately 70 mg/m3. This makes sense because the DM has a lower surface tension than water as a result of the added pulmonary surfactant, disaturated-phosphatidylcholine. Water has a surface tension of about 70–77 dyn/cm, and the pulmonary surfactant surface tension is about 25 dyn/cm. The latter is enough to enable droplet formation during nebulization (as with water), but surfactant will not aggregate like water and will instead spread out over a surface. We believe this, along with a potentially lower viscosity21 for DM versus water, enabled the faster output rate of suspended MWCNTs in DM versus water.
Gravimetric analysis of cascade impactor samples could not be used to confirm MWCNT concentrations in the aerosols due to the significant mass added by the DM. However, exposure system output and nose-port sampling filters were black (as with the F-MWCNTs in water exposure), indicating the presence of MWCNTs in the aerosol. Additionally, a suspension of MWCNTs in DM produced more normal aerosol size distributions (Figure S2) [not present with F-MWCNTs in water (Figure S1)], allowing calculation of the aerosol droplet mass median aerodynamic diameter (MMAD) and geometric standard deviation (GSD) using a modified spreadsheet designed for eight-stage cascade impactor data.22 Data showed that the aerosol droplet size distribution for nebulized O- and P-MWCNTs in DM was relatively consistent throughout the entire exposure period (Figure S2A and B, respectively), while that for F-MWCNTs in DM (Figure S2C) was slightly more variable. Despite this, all three formulations produced aerosol droplets, with the majority (approximately 60–80%) of the mass depositing at stages 1–3 (ECD = 4.66–2.15 μm, respectively) (Figure S2). MMADs and GSDs for droplets of O-, P-, and F-MWCNTs were 3.7 ± 2.5, 4.8 ± 2.9, and 3.3 ± 3.1 μm, respectively.
TEM of the nebulized O-, P-, and F-MWCNTs was impaired because the lower surface tension MWCNT suspensions in DM did not adhere well to the TEM substrate grids during point-to-plane ESP sampling. This was especially true for O- and P-MWCNTs. Overall, despite the higher nebulizer output, fewer MWCNTs were collected on TEM grids (Figure 2B). However, results showed that like F-MWCNTs in water, aerosolized MWCNTs in DM were a mixture of individual and agglomerated nanotubes (Figure 2). Unlike aerosolized F-MWCNTs in water, MWCNTs in DM were primarily observed as singlets or small tangles (Figure 2).
Given the aerosol droplet size range and an average MWCNT concentration of approximately 70 mg/m3 over the course of the 6 h exposures to O-, P-, or F-MWCNTs in DM, rats would have inhaled approximately 3.8 mg of MWCNTs (with a ventilation rate = 0.15 L/min), correlating to deposition (10%)20 of 380 μg in the tracheobronchial and pulmonary regions altogether. This dose is nearly double the high (200 μg) dose from the IT experiments.
At least one study23 showed that breathing rate is variable during inhalation exposures, and despite this, deposition in the lungs still ranged between 10% and 14% for the aerosols ranging from 0.45 to 4.5 μg. Thus, the calculated deposited doses for all inhalation exposures (MWCNTs in DM and F-MWCNTs in water) appear sound.
Animal Weight
Animal weight was unaffected by exposure to MWCNTs compared to controls (data not shown). There was no correlation between weight change (loss) following instillation and subsequent degree of neutrophilia postexposure (data not shown).
BALF Total Cells
The number of total cells recovered from BALF was unchanged in MWCNT-treated animals compared to control animals following IT and inhalation (Figure S3). However, ANOVA model effect tests did show that, overall, MWCNT formulation and time postexposure significantly affected total cells recovered from BALF upon IT/inhalation of MWCNTs suspended in DM (Table S1). Inhalation of F-MWCNTs in water produced no significant changes in BALF total cells irrespective of time postexposure or deposited dose.
Considering the exposure method specifically, despite the lower (200 μg) MWCNT dose by IT, the total number of cells recovered in BALF was significantly higher than inhalation of MWCNTs suspended in DM (deposited dose 380 μg) (Table 1). Inhalation of F-MWCNTs in water (227 μg deposited dose) (M = 205.96) also produced significantly higher total cell numbers (104) than inhalation of F-MWCNTs in DM (M = 117.28) (Table 1); however, there was no significant difference from 200 μg of instilled F-MWCNTs (M = 202.93). Higher BALF cell numbers in DM-instilled sham control animals (Figure S3) relative to those breathing filtered air suggest that the instillation method itself may have produced the increase in total BALF cells relative to inhalation.
Table 1. Significant Post Hoc Comparisons: BALF Total Cells Post IT and Inhalationa.
| compared factor(s) | group I (A) | group II (B) | mean difference (A – B) | standard error difference (A – B) | p-value | df | LCL | UCL |
|---|---|---|---|---|---|---|---|---|
| exposure | instilled O- | inhaled O- in DM | 87.19 | 14.15 | CON | 6 | 72.39 | 157.12 |
| exposure | instilled P- | inhaled P- in DM | 76.17 | 14.40 | CON | 6 | 33.06 | 119.29 |
| exposure | instilled F- | inhaled F- in DM | 85.65 | 14.56 | CON | 6 | 42.03 | 129.25 |
| exposure | inhaled F- in H2O | inhaled F- in DM | 88.68 | 13.98 | CON | 6 | 46.82 | 130.54 |
df = degrees of freedom. LCL and UCL = lower confidence limit and upper confidence limit, respectively. O-, P-, F- = original, purified, and functionalized multiwalled carbon nanotubes, respectively. DM = dispersion media.
BALF Cell Differentials: Neutrophils
Cell differential data were upwardly skewed, so square-root transformation was performed to achieve normal distribution for ANOVA and post hoc statistical analyses. Testing the interaction of dose, time, and MWCNT formulation showed that on day 1 instilled O-MWCNTs produced the most neutrophilia (Figure 3A). By day 21, the acute neutrophilia observed initially had resolved in all MWCNT-instilled animals (Figure 3A, C, and E). Upon inhalation of MWCNTs (Figure 3B, D, F, and G), no significant differences in total neutrophils were noted between filtered-air control and MWCNT-exposed groups. However, total neutrophils were at least 1 order of magnitude lower when contrasted to responses post MWCNT IT (200 μg) (Figure 3).
Figure 3.

Instilled MWCNTs stimulate BALF neutrophilia. Values shown are square-root-transformed numbers of neutrophils (PMNs) in BALF at days 1 and day 21 postexposure to MWCNTs by instillation with dispersion media (DM) (panels A, C, E), inhalation with DM (panels B, D, F), or inhalation with water (panel G). Results are from ANOVA considering dose, time, and particle formulation. “†” indicates difference (p < 0.0001) from all other treatment groups shown in the panel. “*” indicates difference (p < 0.05) from the DM-exposed control group shown in the panel. “#” indicates difference (p < 0.05) from animals instilled with 200 μg of P-MWCNTs.
Although particle formulation did not seem to play an important role with respect to BALF neutrophilia post-IT, the factors of time (Table S2), MWCNT dose (Table S2), and their interaction (Table S3) were most significant. These factors were also significant postinhalation of MWCNTs in DM (Table S4).
BALF Cell Differentials: Macrophages
Upon IT, the total number of macrophages (Mφ) recovered was unaffected by MWCNT formulation, time postexposure, and/or dose. However, IT (200 μg MWCNTs) did produce significantly greater macrophages than inhalation of MWCNTs (380 μg) in DM (Table 2). Contrasting results postexposure to F-MWCNTs via inhalation in DM, inhalation in water (227 μg), and IT showed that macrophage numbers were highest and on par for the latter two exposure methods (Table 2).
Table 2. Significant Post Hoc Comparisons: Square-Root-Transformed Number of Macrophages Post IT Exposure (Instillation versus Inhalation)a.
| compared factor | group I (A) | group II (B) | mean difference (A – B) | standard error difference (A – B) | p-value | df | LCL | UCL |
|---|---|---|---|---|---|---|---|---|
| exposure | instilled O- | inhaled O- in DM | 54.22 | 14.07 | 0.01 | 6 | 12.09 | 96.34 |
| exposure | instilled P- | inhaled P- in DM | 60.92 | 14.32 | 0.001 | 6 | 18.05 | 103.79 |
| exposure | instilled F- | inhaled F- in DM | 67.51 | 14.48 | 0.001 | 6 | 24.16 | 110.88 |
| exposure | inhaled F- in H2O | inhaled F- in DM | 88.65 | 13.90 | CON | 6 | 47.03 | 130.27 |
df = degrees of freedom. LCL and UCL = lower confidence limit and upper confidence limit, respectively. O-, P-, F- = original, purified, and functionalized multiwalled carbon nanotubes, respectively. DM = dispersion media. CON represents “convincing” findings at p < 0.0001.
Effect tests showed that all independent factors (administration method, time, dose, and particle formulation) played significant roles with respect to the (square-root-transformed) number of MWCNT-laden Mφ recovered from BALF (Table S5 and Figure 4). Macrophages with visible MWCNT inclusions (MWCNT-positive Mφ) were significantly higher on day 1 in animals instilled with MWCNTs at the 50 or 200 μg doses (Figure 4A, C, and E). For O-MWCNTs, these increases were also significantly different from the 10 μg dose (Table S5), and data trends suggest that instillation of 10 μg of P- or F-MWCNTs (M = 394.42 and M = 539.96, respectively) may produce slightly more MWCNT-positive Mφ than O-MWCNTs (M = 69.75) (Figure 4A, C, and E). Although MWCNT-laden Mφ were still visible at day 21 post-IT, due to variability there were no significant differences between MWCNT-instilled and control animal groups (Figure 4A, C, and E) in the ANOVA model. Further, although Mφ laden with O- and P-MWCNTs appeared to decrease by approximately half at the 50 and 200 μg doses, the number of Mφ with F-MWCNT inclusions remained relatively high at day 21 (Figure 4A, C, and E). Indeed, particle-laden Mφ were significantly lower on day 21 for animals given 200 μg of O- or P-MWCNTs (Table S5) than on day 1. Increases in the number MWCNT-positive Mφ did not correlate to the numbers of Mφ in BALF (data not shown), which were not significantly different with respect to any of the independent factors previously mentioned.
Figure 4.

MWCNT uptake by macrophages (Mφ) in the lungs postexposure. Values shown are square-root-transformed numbers of MWCNT-laden Mφ in BALF at days 1 and day 21 postexposure to MWCNTs by instillation with dispersion media (DM) (panels A, C, E), inhalation with DM (panels B, D, F), or inhalation with water (panel G). Results are from ANOVA considering dose, time, and particle formulation. “‡ and †” indicate differences (p < 0.0001 and p ≤ 0.05, respectively) from control groups sacrificed on the same day and shown in the same panel. “§” indicates difference (p < 0.05) from a group (shown in the same panel) exposed to the same MWCNT formulation, at the same dose, but sacrificed on a different day. “*” indicates difference (p < 0.01) from groups (shown in different panels) exposed to the same dose of a different MWCNT formulation (O-MWCNTs, P-MWCNTs), but sacrificed on the same day. Finally, “Ω” indicates difference (p ≤ 0.0001) from groups (shown in different panels) exposed to the same MWCNT formulation via a different administration method, but sacrificed on the same day.
Inhalation of F-MWCNTs in water resulted in a significantly greater number of Mφ with visible inclusions (>85%) at days 1 and 21 compared to the filtered-air controls (Figure 4G). F-MWCNTs in water also produced the highest numbers of MWCNT-positive macrophages in contrast to all other F-MWCNT exposure methods (Figure 4G) with no apparent changes from day 1 to day 21(Figures 4G and 5).
Figure 5.

Inhaled F-MWCNTs in water caused heavy and sustained particle loading in BALF Mφ. Cells recovered from the BALF of filtered-air control animals (A and C) or F-MWCNT-exposed animals (B and D) at days 1 (A, B) and 21 (C, D). Cells were stained with Diff Qwik. Panels are bright-field microscopy images of representative cells from rats exposed during a single 6 h time period. Arrows indicate F-MWCNTs.
Inhalation of F-MWCNTs in DM (Figure 4F) produced significantly more particle-laden Mφ in contrast to inhalation of O- or P-MWCNTs in DM (Figure 4B and D, respectively), but similar numbers in comparison to (200 μg) instilled F-MWCNTs (Figure 4E), whereas inhalation of O- or P-MWCNTs in DM (380 μg) produced much less Mφ with visible inclusions than (200 μg) instilled O- or P-MWCNTs (Figure 4A and C, respectively).
Presence of MWCNT-positive Mφ was confirmed by TEM (Figures 6–8) and bright-field microscopy (Figures 7 and 8). TEM showed that at day 1 O- (data not shown) and P-MWCNTs were present in Mφ phagolysosomes, while F-MWCNTs occupied the cytosol (Figure 6). Unlike O- or P-MWCNTs, F-MWCNTs were also found protruding from the cell membrane of Mφ (Figure 7).
Figure 6.

Different MWCNTs are located in different cellular compartments. Interior of alveolar Mφ recovered from BALF at 1 day postexposure to F-MWCNTs (A) and P-MWCNTs (B) by intratracheal instillation. P-MWCNTs at 21 days postexposure are shown on the right (C). Panels are TEM images of representative cells from rats exposed to a one-time bolus dose (200 μg) of MWCNTs suspended in dispersion media.
Figure 8.

Morphology of F-MWCNTs differs from O-MWCNTs in cells at 21 days postinstillation. Mφ recovered from BALF at 21 days postexposure to F-MWCNTs (A and C) and O-MWCNTs (B and D) by intratracheal instillation. Top panels are bright-field microscopy images of representative cells from rats exposed to a one-time bolus dose (200 μg) of MWCNTs. Results are mirrored in TEM images (bottom panels). F-MWCNTs appear as multiple dispersed aggregates within the Mφ (black arrows), while the O-MWCNTs are clustered within a much larger and single aggregate (white arrow). BAL cells were stained with Diff Qwik for bright-field microscopy.
Figure 7.

F-MWCNT uptake by Mφ. Cells recovered from BALF at 1 day postexposure to F-MWCNTs by intratracheal instillation. Bright-field image (A) of an alveolar macrophage with protruding F-MWCNTs (linear, black particles), verified by TEM (B), suggests cellular entry by penetration. BAL cells were stained with Diff Qwik for bright-field microscopy. Black arrows point to F-MWCNT.
At day 21, micrographs revealed loss of compartmentalization for O- and P-MWCNTs, which appeared in the cytosol (Figures 6 and 8), and differences in aggregate morphologies. Whereas O- and P-MWCNTs appeared in large focal agglomerates within the cytosol (Figure 8B and D), F-MWCNTs were dispersed in smaller aggregates (Figure 8A and C). A more complete discussion of these TEM findings are discussed elsewhere (to be submitted for publication), wherein results were confirmed by 3D tomography.
BALF Supernatant and Blood Assays
BALF supernatant assays (total protein and LDH) and blood CBCs showed no significant differences between control and exposed animals irrespective of MWCNT formulation, administration method, or time postexposure (data not shown).
Histopathology
At 1 day postexposure, animals instilled with 200 μg of MWCNT exhibited focal centriacinar inflammation in regions adjacent to visible particle agglomerates or particle-laden Mφ in the air spaces (Figure 9).
Figure 9.

Instilled MWCNTs produced particle-associated inflammation in the lung parenchyma at day 1. Histopathological findings from exposure to DM (A), P-MWCNTs (B), O-MWCNTs (C), and F-MWCNTs (D). Panels are bright-field microscopy images of the most severe responses observed in lung tissues from rats given a single 200 μg dose of MWCNTs or 250 μL of DM. Tissues were stained with H & E. Solid arrow = MWCNTs, and broken arrow = inflammatory polymorphonuclear cell. Scale bar (25 μm) applies to all panels.
Nearby blood vessels were affected in only the most severe instances. Instilled O- and P-MWCNTs produced obvious particle agglomerates with significant increases in cellularity at day 1 (Figure 10A and C), as did inhaled F-MWCNTs (Figure 10G). O- and P-MWCNT IT exposure also produced significantly greater bronchiolar inflammation over sham controls (Figure 10A and C). Although instilled P-MWCNTs were found more frequently, at day 1, to produce stronger particle-associated inflammation (Figure 9), only instilled O-MWCNTs produced significantly increased alveolar and pleural inflammation (Figures 10A and 11) in contrast to controls. This acute alveolitis was significantly greater upon O-MWCNT instillation (Figure 10A) in contrast to P- or F-MWCNT (Figure 10C and E, respectively). Similarly, pleural inflammation resulting from IT of O-MWCNTs (Figure 10A) was also higher than that produced by P- (Figure 10C) or F-MWCNTs (Figure 10E). As a whole, O-MWCNTs produced a greater effect than either instilled P- or F-MWCNTs in the alveoli (Figure 10A), where severe inflammatory infiltrates were often observed filling the air spaces (Figures 9C and 11D), and at the subpleura (Figure 10A), where moderate influxes of Mφ were observed (Figure 11C). Marked numbers of cells in the bronchiolar region and/or terminal bronchiole–alveolar duct junction (Figure 11D) also contributed to a greater overall inflammatory response to O-MWCNTs on day 1. ANOVA results showed that exposure to F-MWCNTs by IT and inhalation in DM did not produce statistically significant inflammation in contrast to controls at day 1 (Figure 10E and F). Inhaled F-MWCNTs (227 μg) suspended in water did produce significantly more particle-associated inflammation versus filtered-air controls (Figure 10G) and versus (380 μg) inhaled F-MWCNTs in DM (Figures 10F), but not more than (200 μg) instilled F-MWCNTs (Figure 10E). Due to the low dose rate inhalation exposures (with an inherent lack of bolus MWCNT deposition in tissues), the most severe particle-associated inflammation in animals that inhaled MWCNTs (suspended in DM or water) (Figure 12) was a score of 1 (Figure 10), corresponding to little/no increase in vicinal cellularity (Supporting Figures S4 and S6). This was much lower than that in MWCNT-instilled animals, which produced scores of ≤3 (Figure 9).
Figure 10.

MWCNTs produced variable histopathology. Results from semiquantitative scoring are shown for O-MWCNTs (A, B), P-MWCNTs (C, D), and F-MWCNTs (E–G) for day 1 postexposure. Results are from ANOVA considering dose, particle formulation, and exposure method. “‡ and †” indicate differences (p < 0.0001 and p ≤ 0.05, respectively) from control groups sacrificed on the same day and shown in the same panel. “§” indicates difference (p < 0.05) from a group (shown in the same panel) exposed to the same MWCNT formulation, at the same dose, but sacrificed on a different day. “*” indicates difference (p < 0.01) from groups (shown in different panels) exposed to the same dose of a different MWCNT formulation (F-MWCNTs, P-MWCNTs), but sacrificed on the same day. “*” indicates difference (p < 0.0001) from groups (shown in different panel) exposed to the same dose of a different MWCNT formulation (F-MWCNTs), but sacrificed on the same day. “Ω” indicates difference (p ≤ 0.001) from groups (shown in different panels) exposed to the same MWCNT formulation via all other administration methods (inhalation and instillation), but sacrificed on the same day. Finally “α” indicates difference (p ≤ 0.05) from groups (shown in different panels) exposed to the same MWCNT formulation via different administration methods (inhalation with DM), but sacrificed on the same day.
Figure 11.

Instilled O-MWCNTs produced significant inflammation in the lungs at day 1. Histopathological findings of pleural (A) and (B) bronchiolar inflammation in rats exposed to 250 μL DM or a single 200 μg dose of O-MWCNTs (C and D, respectively). Panels are bright-field microscopy images of representative responses. Tissues were stained with H & E. Scale bar is 50 μm in panels A and C and 100 μm in panels B and D.
Figure 12.
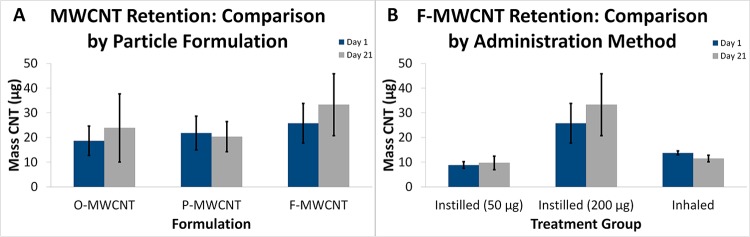
Programmed thermal analysis quantification of MWCNTs in lung tissue. (A) Day 1 and 21 time-course data from animals instilled with O-, P-, or F-MWCNTs. (B) Time-course data from animals exposed to F-MWCNTs by intratracheal instillation and inhalation.
By day 21, all MWCNT-exposed animals had a mild to moderate level of inflammation with no significant differences from control animals. Instilled F-MWCNTs (M = 1.83) caused less bronchiolitis than O- and P-MWCNTs (M = 2.75 and 2.88, respectively) and less pleural inflammation (M = 0.83) than O- and P-MWCNTs (M = 1.83 and 1.88, respectively) (Table S6). Instilled F-MWCNTs (M = 2.17) also produced significantly less perivascular inflammation than O-MWCNTs (M = 2.67), but not P-MWCNTs (M = 2.50) (Table S6). Additionally, instilled MWCNTs produced significantly more (Table S7) alveolar, bronchiolar, pleural, and/or perivascular inflammation than inhaled MWCNTs.
Analysis of AB/PAS and Picrosirius red slides revealed no differences between control and MWCNT-treated animals, indicating no increases in mucosal production or fibrotic changes, respectively, regardless of MWCNT formulation, time postinstillation, or method of administration (data not shown). Although the possibility of frustrated phagocytosis was examined, and evidence of macrophage aggregates in BALF (Figure 8) and lung tissues (Figures 9B–D and 11C,D) was noted, the MWCNT formulations in DM were generally ≤1 μm in length. This is evident especially in cells recovered from BALF (Figures 5–8). Because the threshold length at which frustrated phagocytosis has been shown to occur is ≥10 μm in vivo,24 we believe that particle-associated frustrated phagocytosis, if present, was primarily isolated to regions of the lungs where large particle agglomerates were present (terminal bronchiole–alveolar duct junction, bronchioles, Figures 9 and 11). By day 21 postexposure, given the lack of PMNs, fibrotic changes, and granulomas, it is likely the larger particle agglomerates were already gone and that the remaining MWCNTs were of a small enough size that they were readily taken up by macrophages so as to not activate inflammatory responses.
Programmed Thermal Analysis
Inhaled MWCNTs in DM were not tested due to limited resources and unidentified use of DM-suspended MWCNTs for practical purposes. Although instilled MWCNTs were also suspended in DM, the known dose delivered to the lungs made conclusions regarding MWCNT retention/clearance possible. Spiked tissue recoveries of hydrophobic (O- and P-) MWCNTs were equivalent (87.6%), but hydrophilic F-MWCNT recovery was lower (30.12%). Previous research showed that O- and P-MWCNTs behaved the same in terms of recovery and behavior during PTA.17 Statistical analysis of MWCNT quantities measured in the right caudal lung lobe by PTA at postexposure days 1 and 21 revealed no significant differences due to time, particle formulation, or administration method (IT vs inhalation with water); however, there was a data trend suggesting that instilled F-MWCNTs may be retained in the lungs to a higher degree than either O- or P-MWCNTs (Figure 12A). The instilled 200 μg dose of F-MWCNTs was associated with greater variability in retention than the 50 μg dose or that received by inhalation (Figure 12B). The mass of inhaled F-MWCNTs recovered by PTA more closely matched the mass recovered from the 50 μg instillation (IT) group and not the 200 μg IT group as expected given the deposited dose estimate of 227 μg. However, there were no significant differences in retention between any F-MWCNT-exposed groups (Figure 12B).
Because at least 10% of the instilled MWCNT mass was still present in the caudal lobes at day 21 (Figure 12), the data confirm a lack of significant MWCNT clearance from day 1 to 21 despite MWCNT-positive cells in BALF (Figures 4–8) and confirmation of CNTs found in airway cilia (Figure 13).
Figure 13.

SEM images of inhaled F-MWCNTs in ciliated cells along the main airway. White arrows indicate F-MWCNTs.
Effects Due to Dose
The purpose of this study was to investigate how correlations between (a) MWCNT dose, (b) particle physicochemical characteristics, and (c) administration techniques modulate pulmonary inflammation and cellular injury over time. Results do suggest a dose–response effect. BAL cell analyses showed that 50 μg was the lowest dose at which significant differences from control could be observed (Figure 3), whereas the 200 μg dose most consistently produced acute inflammatory responses (Figure 3). These doses tested were not sufficient to produce significant differences in BALF supernatant and blood CBC assays, which may have been insensitive assay choices in hindsight. Because of the results observed in BALF, only tissue samples from animals instilled with 200 μg of MWCNTs were compared to controls. However, given that a 200 μg dose of O- or P-MWCNTs produced highly significant particle-associated inflammation, and a 50 μg instillation of MWCNTs was sufficient to produce neutrophilia and significant MWCNT-positive macrophages (in contrast to control), it is possible we would have seen acute inflammation by histopathology in animals given 50 μg of O- or P-MWCNTs too. Overall, histopathology findings echoed those from BALF differentials: the 200 μg dose produced significant inflammation in contrast to sham controls, and O-MWCNTs often produced greater inflammatory responses than P- and F-MWCNTs (Figures 3 and 10A, Table 2).
Role of Physicochemical Particle Characteristics
Physicochemical characteristics and exposure methodology appeared to play important roles in particle retention and/or macrophage function, BALF neutrophilia, and histopathology. Most statistically significant results found at postexposure day 1 resolved by day 21, intimating that inflammatory responses due to MWCNTs were predominantly transient. Although instillation of 200 μg of O-, P-, or F-MWCNTs induced neutrophilia at day 1 postexposure, responses to O-MWCNTs were significantly higher than those to P- and F-MWCNTs (Figure 3A, Table S1). By day 21 however, neutrophilia was resolved in all MWCNT-exposed animals (Figure 3). A significant percentage of Mφ-containing visible inclusions were also found in BALF, at day 1, in animals instilled with 50 or 200 μg of MWCNTs (Figure 4A, C, and E, Table S5). However, at day 21, (1) only instilled F-MWCNTs (not instilled O- or P-MWCNTs) produced significant particle-laden Mφ (Figure 4E); (2) inhaled F-MWCNTs in DM produced significantly more MWCNT-positive Mφ than inhaled O- and P-MWCNTs in DM (Figure 4F); and (3) inhaled F-MWCNTs in water showed no difference from day 1 (Figure 4G). This could be due to a slightly higher degree of retention, which is suggested by the trend in Figure 12A at day 21 and/or a difference in their ability to be taken up by macrophages. Semiquantitative histopathological assessment showed that at day 1 O-MWCNTs produced the greatest overall inflammatory effects in contrast to P-and F-MWCNTs (Figure 10) and the most statistically significant differences between control and 200 μg instilled animals (Figure 10). Although 200 μg was sufficient to produce significant, acute, particle-associated inflammation, only O-MWCNT exposure resulted in statistically marked alveolar, bronchiolar, and pleural inflammation at day 1 as well (Figure 10). As a whole, results suggest that with the given exposure methods and measured biological end points instilled MWCNTs produced only acute inflammation. However, O-MWCNTs produced the most potent inflammatory responses (Figures 3, 10, and 11, Tables S1 and S6), and F-MWCNTs affected Mφ-mediated uptake most and may be more persistent (Figures 4 and 12B). Although some research suggests a fibrotic response could occur at later time points,25,26 the results are consistent with findings from other previously published studies using the same or similar materials3,27−30 showing only transient MWCNT effects in the lungs.
Potential reasons for the relatively higher potency of instilled O-MWCNTs and/or greater uptake of F-MWCNTs (instilled or inhaled) are multifold. Particles differed by metal content, functionalization, surface area, and size, all of which play roles in particle uptake, clearance/retention, cell viability, and toxicity. O-MWCNT instillation may have produced more inflammation due to a higher percentage of catalyst metals (Ni and Fe) by mass. O-MWCNTs had the most (4.5% Ni, 0.8% Fe) followed by P-MWCNTs (1.8% Ni, 0.1% Fe), and finally F-MWCNTs (negligible Ni and Fe, 0.2% S). This mirrors the degree of inflammatory responses. Previous studies suggest that higher metal content may correlate to an increase in oxidative potential and/or inflammation.30−32 Although some studies with MWCNTs show no differences between metal-containing and purified formulations,33 catalyst metals complexed to CNTs behave differently from each other in acidic (e.g., lung lining) and neutral environments.34 Depending upon the exposure parameters [e.g., type of metal catalyst, time, suspension media, CNT storage conditions (light, temperature), and biological environment], results may vary even between studies using the same nanomaterials.
Fe is known to generate hydroxyl radicals, promote intracellular reactive oxygen species, and decrease cell viability.34,35 Increased Ni has been linked to concomitant increase in NLRP3 inflammasome activation, which influences inflammation and apoptosis, to produce significant histopathology31 and decreases in cell viability32 in MWCNT-instilled mice. Altogether, findings support the hypothesis that Ni and/or Fe content explain(s) the relative magnitudes of toxic responses with O-MWCNTs ≥ P-MWCNTs ≥ F-MWCNTs.
Addition of acidic functional groups, as with F-MWCNTs, causes an overall increase in hydrophilicity, which is generally linked to easier clearance from the body and a relative decrease in toxicity. Recent publications lend credibility to these assumptions,18,28,30,32,36−38 and at least one study suggests that toxicity decreases with increased −COOH functionalization.29 Research by Sager and colleagues39 suggests this may be due to F-MWCNTs’ ability to prevent phagolysosome permeability, release of lysosomal contents into the cytosol, and downstream activation of the NLRP3 inflammasome. These results were bolstered by findings32 that show intact and damaged phagolysosomes in alveolar macrophages exposed to F-MWCNT and P-MWCNT, respectively, despite the appearance of greater F-MWCNT uptake.
Although primary size was similar for all MWCNTs in dry bulk form, and the hydrodynamic size of F-MWCNTs (234 ± 24 nm) was lower than that of O- and P-MWCNTs (324 ± 33 and 858 ± 58 nm, respectively), particles were suspended in DM for IT. The DM acts as a lung fluid mimic, providing equivalent dispersion of engineered nanomaterials to BALF, and stabilizes hydrophobic particles (like O- and P-MWCNTs) to decrease clumping and settling; yet, DM alone avoids added toxicity. Serum albumin has been used effectively to provide dispersion and suspension of CNTs.3,18,26,40 Previously, the MWCNTs used in our study were stabilized by serum albumin (SA) in phosphate-buffered saline and in 0.9% NaCl.41 Co-administration of dipalmitoylphosphatidylcholine significantly enhanced the stability of O-MWCNTs, but had no effect on P- and F-MWCNTs. As indicated by the images presented in Figure 1, long MWCNTs especially contain bends and kinks. Because the O- and P-MWCNTs do not contain added functional groups to sterically hinder agglomeration, formation of bundles/aggregates and precipitation is more likely in the absence of DM. Comparison of particles in DM showed O- and P-MWCNTs were roughly equivalent in size, but F-MWCNTs were smaller (measured by dynamic light scattering) when suspended in ionic media and bovine SA.41 It is possible that the F-MWCNTs were preferentially taken up by macrophages due to a relatively lower agglomeration status, allowing more contact between dispersed particles and cells and/or increased uptake via penetration of the cell membrane (Figure 7)42−44 or other vesicle-mediated processes.45,46 Indeed, previous studies have shown agglomeration status to be a factor in particle uptake and retention/clearance.42,47,48 The biomolecular “coronas”, formed by weak interactions between the DM, biological milieu, and the F-MWCNTs, are also likely to be very different from that of O- and P-MWCNTs. This difference would distinctly affect transport, uptake, and clearance of these particles as well.40,49−52
Effects Due to Administration Method
Although the higher aerosol output was an initially unintended and unexpected result, it enabled comparisons of biological responses between a 200 μg bolus dose of MWCNTs by IT and approximately double that (380 μg) by inhalation. Given that several previous studies have contrasted post-IT and -inhalation responses to MWCNTs administered at equivalent doses, results presented herein add to the discussion regarding the effects of dose rate. Intratracheal instillation of MWCNTs resulted in greater neutrophilia (Figure 3A, C, and E) than inhalation (Figure 3B, D, F, and G), while inhalation resulted in significantly greater MWCNT-positive Mφ (Figure 4G). Although acute histopathology appeared to be fairly similar between animals exposed to F-MWCNT by IT and inhalation with water (Figure 10E and G, respectively), only the latter produced significant particle-associated inflammation on day 1 in contrast to respective controls (Figure 10G). Further, only instilled animals (including sham controls) showed an overall inflammatory increase (though slight and insignificant) over time (Figure S7). These results suggest that inhalation of F-MWCNTs can produce lung inflammation and that exposure by IT, irrespective of the suspension used, may produce at least some of the inflammatory effects observed in tissues.
While IT of nanoparticles in animals is much more controlled than inhalation, ideally with the full dose being received by the animal it is a much more invasive process than exposing animals to particles through inhalation. Furthermore, the delivered dose rate of a given dose as a bolus versus inhalation is different by orders of magnitude. This likely affects biological outcome, as here, although the deposited dose estimate was ∼227 μg for inhaled F-MWCNTs in water and ∼380 μg for inhaled MWCNTs in DM, neutrophilic influx was still, on average, an order of magnitude less than that seen for even the 50 μg instillation-exposed animals (Figure 3). Despite this, the number of particle-laden cells was much higher with inhalation than IT at both postexposure time points (Figure 4). Previous studies53,54 showed that the immune inflammatory response is relatively less robust when the body is exposed to very small particles given at a low/steady rate in contrast to a large bolus. In fact, phagocytes may even initially fail to actively take up exogenous, smaller nanoscale particles until internalization is thermodynamically favorable.42 In these cases, pathological changes are more often seen with continued, chronic exposures as macrophage phagocytic capacity becomes saturated.
F-MWCNT size in water versus DM and resulting variations in biomolecular coronas may also have factored into the enhanced uptake of inhaled F-MWCNTs and the toxicity of instilled F-MWCNTs. Particles suspended in water were smaller and more dispersed than those in DM.41 As above, it is possible this enabled relatively more contact with Mφ and/or resultant uptake of the smaller, more dispersed (inhaled) F-MWCNTs in water. This is also applicable to inhaled MWCNTs in DM delivered at a low dose rate versus bolus MWCNTs delivered by IT.
Phagocytosis alone can occur by several different mechanisms, at least some of which are affected by particle size and surface characteristics.42,45 For instance, CNTs are known to enter Mφ via diffusion/penetration through the lipid membrane,25,43,46,55,56 causing a characteristic porcupine-like appearance to a cell.44 Indeed, this was observed in our study using both bright-field microscopy and TEM (Figure 7). Research suggests that while long CNT tangles43 and localized clusters of singlet CNTs42,45 interact with the cell membrane and become phagocytosed, dispersed CNTs of <1 μm are most likely to enter the cell through diffusion43,44 or receptor-mediated endocytosis (RME). RME occurs with coronated, dispersed CNTs,46 and singlet CNTs of >1 μm or localized clusters of CNTs of <1 μm enter cells via receptor–ligand binding or RME, respectively.42,45
Whether penetration by CNTs is harmful to the cell has yet to be determined. Some studies suggest this type of entry by CNTs has very little effect on cell viability,44 with at least one study suggesting penetration is both bidirectional and innocuous under certain circumstances.57 Other studies suggest cell penetration may effect decrements in cell viability.43 However, these discrepancies may be due to myriad differences in CNT forms, experimental methods, and biological end points tested. Certainly, results herein suggest the former is true, as F-MWNCTs produced little if any signs of toxicity despite being the only MWCNT formulation observed penetrating the cell membrane.
How and whether CNT location within the Mφ affects cellular functions (e.g., phagocytosis, cell signaling, release of inflammatory mediators) and lung pathology remains to be elucidated. In an in vitro study of human monocyte-derived Mφ, Porter and colleagues43 showed single-walled carbon nanotubes within lysosomes appeared healthy when viewed with 3D tomography at 2 days postexposure, but at 4 days postexposure, signs of apoptosis and necrosis were evident. This could mean that the peak inflammatory responses were missed in our study by observing only postexposure days 1 and 21. Hamilton and colleagues32 showed that mere uptake of MWCNTs did not correlate with MWCNT toxicity or NLRP3 activation in alveolar Mφ. Furthermore, NLRP3 activation occurred as a result of phagolysosomal lysis (like Sager and colleagues,39), suggesting that NLRP3 activation may not even be necessary for O- and/or P-MWCNTs to decrease cell viability and increase interleukin (IL)-1β, an important inflammatory mediator. Their results also showed differential compartmentalization of MWCNTs similar to our results.32 Future studies, therefore, should include a thorough examination of primary Mφ postexposure to MWCNTs including analyses of phagocytic, chemotactic, and particle clearance mechanisms, cell viability, cytoskeletal integrity, major histocompatibility complex expression, specific protein activity (caspase 1), and/or cyto/chemo-kine release, e.g., IL-1β and tumor necrosis factor (TNF)-α.
Conclusion
Understanding human health risks associated with ENMs is particularly challenging because of the wide range of plausible exposure scenarios. While workers, consumers, or the general public may potentially be exposed to nanoparticles through a number of pathways (e.g., dermal, ingestion, ocular), inhalation, at least from an occupational standpoint, is likely to be one of the most significant routes of exposure. Relating exposure characteristics of airborne particles in experimental studies to those in human exposure settings is important for establishing exposure/dose–response relationships and standards to protect human health.
We acknowledge IT does not represent real-world exposure conditions or deposition patterns in the lung that would occur via inhalation. This is due to the fact that instilled particles in suspension are not subject to the same physics as airborne particles (impaction, sedimentation, diffusion), and inhaled CNTs are more slowly dispersed than an instilled aqueous bolus. Thus, they are much more likely to reach the distal lung.58 However, the objective of our study was to assess how different physicochemical particle characteristics and pulmonary retention of the various MWCNT formulations affect pulmonary toxicity in an attempt to clarify results from preliminary hazard rankings. This is not often possible in an inhalation exposure scenario without actual dosimetry measurements, which were, at the time of the study, difficult without the use of tagged MWCNTs and/or higher metal content. Labeling of MWCNTs for postexposure tracing could affect interactions within the body (i.e., with large fluorescent tags) or entail excess cost and increased safety measures (i.e., with 14C radiolabeling). As such, the ex post facto PTA data presented lack early time (T) points (e.g., T0, T < 24 h, and T > 1 < 21) necessary to fully understand particle clearance. Additionally, though exposure to MWCNTs occurred via nebulization approximating a 5-month occupational exposure, real-life exposures are more likely to happen with dry bulk materials at much lower concentrations, as in various stages of production, packing, or transport of ENMs. Aside from the high concentrations, the aerosolized MWCNTs (in water) generated herein appear close to those encountered under workplace conditions in that the CNTs occur primarily as tangles with heterogeneous sizes and morphologies.59
In the future, subsequent studies may benefit from a larger sample size and multiple-day inhalation exposures. Collecting biological samples at more time points and utilizing analytical dosimetry methods such as PTA could yield much needed deposition and clearance data regarding more “true to life” MWCNT exposures.
Overall, this study has shown that MWCNTs produce the following: (1) acute, dose-dependent inflammation at postexposure day 1, which resolved by postexposure day 21; (2) different inflammatory responses, which likely correlate to physicochemical characteristics affecting particle uptake and clearance mechanisms, such that O-MWCNTs ≥ P-MWNCTs ≥ F-MWCNTs; and (3) reversed patterns of inflammation and particle uptake in IT versus inhalation exposures, which may be due in part to the unnatural presence of bolus particles in the former versus the latter and subsequently different defense responses in the lung. Still, these MWCNTs may create concerns for human health if exposures occur. Studies show that MWCNTs can persist in the lung for long periods8,9 and cause toxic responses even after short, occupationally relevant exposures.11 More research is needed to elucidate the common mechanisms of MWCNT-induced toxicity associated with the resulting human and environmental exposures from the emerging nanotechnology industry. Future research should expand the efforts described herein to ensure the safe continuation of MWCNT use in nanotechnology.
Materials and Methods
Bulk MWCNT Preparations
MWCNTs were obtained in powder form and used as received for the O-MWCNT stock [Cheap Tubes, Inc., Brattleboro, VT, USA, outer diameter = 20–30 nm, inner diameter = 5–10 nm, length = 10–30 μm, as specified by the manufacturer and confirmed by SEM (Figure 1)]. Purification and functionalization of the O-MWCNTs to create P- and F-MWCNTs, respectively, were carried out using previously described procedures.60−62 Briefly, a microwave-accelerated reaction system (Mars, CEM, Matthews, NC, USA) fitted with internal temperature and pressure controls was used. The reaction chamber, which had an operating range of 0–200 °C and 0–200 psi, was lined with Teflon PFA. Residual metals and amorphous carbon were removed from O-MWCNTs via microwave-induced reaction using dilute nitric acid (1 M) and saturated ethylenediamine tetra-acetate (EDTA) in CH3COOH at pH = 4 to produce P-MWCNTs.60,63 The P-MWCNTs were functionalized (F-MWNCTs) by adding them to a reaction chamber containing 50 mL of a mixture (1:1) of 70% nitric acid and 97% sulfuric acid. The reaction time was 10 min at a microwave power of 80% (of the maximal possible 1600 W output) and a temperature of 140 °C. The suspension was diluted with 50 mL of deionized water, filtered through a 10 mm PTFE membrane, and vacuum-dried at room temperature.
MWCNTs were characterized using a variety of different analytical techniques. These included (1) EDS to identify the elemental composition of the MWCNTs; (2) Fourier transform infrared spectroscopy (FTIR) measurements in KBr pellets using a PerkinElmer Spectrum One instrument (Downers Grove, IL, USA) to provide information regarding molecular structure and chemical bonding; (3) thermogravimetric analyses (TGA) using a Q500 TGA from TA Instruments (New Castle, DE, USA) to determine organic/inorganic content, and (4) BET for determination of surface area. The specific surface areas of the samples were measured using a Quantachrome NOVA 3000 series (model N32-11) high-speed gas sorption analyzer (Boynton Beach, FL, USA) at 77.40 K. The sample were heated for 3 h and degassed under vacuum at 300 °C prior to surface area measurement. Scanning electron microscopy using a Genesis 4000 XMS (EDAX Inc., Mahwah, NJ, USA) was also done to image sample morphology, and zeta-potential measurement of the MWCNT suspensions was performed using a ZetaSizer Nano-ZS instrument (Malvern Instruments). Samples were analyzed by the New Jersey Institute of Technology.18
Animal Protocol
Studies were conducted in accordance with the Society of Toxicology Guiding Principles in the Use of Animals in Toxicology. University of California Davis IACUC (Animal Care and Use Committee) approval was obtained for all procedures involving rats in this study. Male SD rats (Harlan Laboratories, Inc., Hayward, CA, USA), 9–10 weeks of age, were used because they are calm, easily handled, and very tolerant of IT and inhalation procedures. At 9–10 weeks of age, the rats are similar to human adults, with respect to fully formed lungs and complete alveolarization, before any signs of senescence.
Upon arrival, animals were weighed and housed in pairs, in plastic cages (∼20 × 16 × 8.25 in.), with narrow, straight-wire, stainless steel lids; enrichment objects; and CareFRESH absorptive paper bedding. Animals were acclimated for a minimum of 1 week and given access ad libitum to laboratory rodent diet (Purina Mills, St Louis, MO, USA) and water throughout the duration of the experiment. Animal bedding was replaced and cages were changed on a weekly basis. Aseptic animal rooms were maintained at approximately 22 °C with 12 h light/dark cycles.
After their arrival and initial one-week adaptation period, animals slated for inhalation studies underwent supplemental acclimation to the inhalation exposure tubes (Teague Enterprises, Woodland, CA, USA) (Figure 14). For a period of 1 to 2 weeks prior to the scheduled exposure, animals were trained to enter and remain in the exposure tubes until released. Time in the tube increased up to 6 h at a gradual rate over the training week(s). This served to decrease/prevent confinement stress during the actual 6 h inhalation exposure period.
Figure 14.
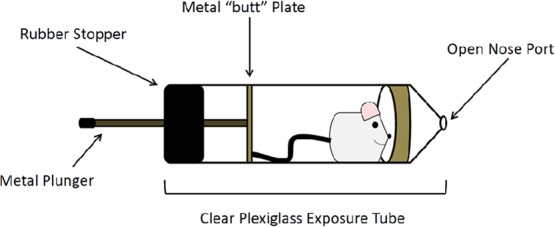
Diagram of (nose-only) inhalation exposure tube. Image shows a representation of the clear plexiglass tubes used for the nose-only inhalation exposure study. Once inside, the rat instinctively moves toward the open nose port (shown at the right), where it is exposed to MWCNT aerosol or filtered air if it is a control animal. The tube is sealed with a metal plunger (shown left), which attaches to a metal plate and exits through a rubber stopper. The rubber stopper ensures a firm seal, while the metal plate contacts the rat’s tail and enhances the animal’s ability to stay cool during the exposure period. The exposure tube was designed to minimize thermal stress by providing a heat-conducting path from the metal butt plate, which keeps the rodent not only inside the tube but also cool. This design allows the rodent to self-regulate its body temperature by changes in blood circulation to its tail, a normal means of maintaining homeostasis. To ensure that most of the tail-cooling portion (metal butt plate and plunger) was outside the tube in the cool room air, the exposure tubes were cut to a length so that not more than 1 in. of the plunger was within the tube. Note: Drawing not to scale.
During tube acclimation, measurements of room temperature and relative humidity (RH) were recorded every 10 min to ensure the room was kept between 18 and 24 °C. Fans were used for added cooling and air circulation. The exposure tubes (external portion) were also sprayed with cool water intermittently to prevent heat stress. Care was taken with the loading and unloading of rats into/out of the tubes to avoid animal injuries. Animals were allowed to walk freely into the tubes, not forced into them. Animals were monitored, once securely in the tubes, for signs of stress and deviations from the desired body position (tail facing the nose port).
Animal weights were recorded throughout the study. Prior to exposure, animals were assigned to treatment groups by weight. This was done in a manner ensuring the mean weight for all treatment groups, for a particular time point and particle formulation, was statistically the same. Any animal showing a decline in weight during the acclimation period was not used. Sentinel rats were maintained in the same room and tested to ensure that experimental animals remained free of pathogens and/or parasites.
Preparation of Exposure Equipment for Inhalation Exposures
The nose-only exposure system and the exposure tubes were sanitized before use by scrubbing with diluted Liqui-Nox and flushing with water. (Liqui-Nox does not support bacterial growth and is free-rinsing.) To ensure there was no mold/mildew growth, the individual system components were allowed to air-dry for 24–48 h in a clean, negative pressure environment, and once the system was reassembled, filtered air was run through it for a minimum of 8 additional hours. System cleanliness was determined by viewing outlet filters under bright-field, EM, and fluorescent microscopy.
Gravimetric Analysis
Gravimetric analysis was conducted in accordance w/NIOSH Method 5000 for carbon black.64 Though Method 504065 is currently the recommended method for measuring airborne carbon nanotubes, we did not have access to an evolved gas analyzer for measurements of elemental carbon in the aerosol, specifically. Briefly, before aerosol sampling, each unused filter was inspected for tears, folds, and other imperfections. A unique identification number was then assigned to each filter, which was placed in a labeled, static-dissipative, plastic filter holder (SKC Inc., Eighty Four, PA, USA) to prevent contamination and damage. Prior to weighing, all filters were equilibrated for 24–48 h at the UC Davis Crocker Nuclear Lab. All filter weights were obtained using a Cahn microbalance sensitive to ±1 μg. The microbalance was calibrated using National Institute of Standards and Technology standard weights, and balance checks were performed with control filters after every five filter weights. Each filter was weighed under carefully monitored conditions (temperature, RH, gauss level) at least two times before and after sampling to determine steady pre- and postweights, respectively. Additional weight measurements were made as needed until variance was limited to ±3 μg.
After sampling, filters were transported to the Crocker Lab for equilibration and postweighing as described above. Mass measurements were used to calculate the concentration of F-MWCNTs in the aerosol.
Preparation of Particle Suspensions for Intratracheal Instillation and Inhalation Exposures
All dry bulk MWCNTs used for the nanoparticle suspensions were measured using a calibrated analytical microbalance with a minimum limit of detection equal to 0.003 mg (M5P filter microbalance, Sartorius, Goettingen, Germany). For IT exposures, MWCNTs were placed in DM prepared as previously described.66 Proportions were such that in 1 mL of DM there were 0.399 mL of sterile saline, 0.600 mL of rat serum albumin (1 mg of RSA powder:1 mL of 0.9% saline), and 0.001 mL of 1,2-distearoyl-sn-glycero-3-phosphocholine (DSPC) (10 mg of DSPC powder:1 mL of ethanol).
MWCNT suspensions (10, 50, and 200 μg/250 μL) were prepared and probe-sonicated as previously described.66 DM served as the sham control instillate. All suspensions were prepared and loaded into 1 cc Monoject syringes fitted with 1.5-in., 22 gauge, blunt-tipped Monoject needles directly before instillation. Sonication, syringe loading, and instillation were choreographed to ensure the highest degree of particle dispersion, although even up to 20 h postsonication these media have been shown to remain well-dispersed in ionic media.41
For inhalation exposures, MWCNTs were dispersed in nanopure water or DM in a 240 mL nebulizer at a concentration of 1 mg/mL to generate respirable particles with concentrations averaging 30 mg/m3 continuously over a 6 h period. Utilization of a Heart high-output nebulizer (Westmed, Inc., Tucson AZ, USA) and Krypton-85 source (charge neutralization) allowed for efficient delivery of single particles rather than large bulk agglomerates into the nose-only inhalation system (Teague Enterprises). The suspension was sonicated as above prior to attaching the nebulizer to the exposure system. The nebulizer was kept in an ice water bath during the exposure to prevent evaporation in the MWCNT suspension. Preparations of the exposure system, MWCNT suspension, and animals were coordinated to maintain the highest degree of particle dispersion and animal comfort.
Intratracheal Instillations
Two hours prior to instillation, food was removed from the animal cages. Animals were anesthetized and instilled with 0, 10, 50, or 200 μg of MWCNTs in 250 μL of DM according to previously published methods.66 For each MWCNT formulation, a sample size of 48 animals was used, with 6 animals per dose (including sham control) and 24 per time point.
The tested doses were chosen because they approximate human occupational exposures to MWCNTs after 1 week, 5 weeks, and 5 months in a light work environment. Aerosolized MWCNTs have been measured at a peak concentration of approximately 400 μg/m3 and a mass median aerodynamic diameter of 1.5 μm in a workplace environment.67 A nose-breathing reference worker with a ventilation rate of 25 L/min has an alveolar deposition fraction of approximately 10% when inhaling particles with a 1.5 μm MMAD.68 Humans have an alveolar epithelium surface area of approximately 102 m2.69 Exposure to 400 μg/m3 MWCNTs produces approximately 5, 24, and 94 μg MWCNTs/m2 alveolar epithelium after 1 day, 1 week, and 1 month, respectively. Given the alveolar epithelium of an SD rat has a surface area of approximately 0.4 m2,69 the 10, 50, and 200 μg MWCNT doses result in 25, 125, and 500 μg MWCNTs/m2 alveolar epithelium, respectively, approximating 1-week, 5-week, and 5-month human exposures.
Inhalation Exposure and Aerosol Characterization
As with IT, food was removed from the animal cages 2 h prior to exposure. Each animal was loaded into an exposure tube, which was then coupled at an open nose port to the exposure system. Procedures were similar to acclimation periods, but rats were exposed to either nebulized MWCNTs (treated) or filtered air (control) for a single 6 h period. A diagram of the inhalation system is provided in Figure 15.
Figure 15.

Diagram of the nebulization system. Image shows a representation of the nose-only inhalation exposure apparatus. Inlet air lines direct filtered air into the Heart nebulizer containing the MWCNT suspension. Aerosolized MWCNTs flow past the Krypton-85 source and into the inhalation chamber for the animal exposures. Vacuum lines pull air from the chamber through a heated outlet air filter before exiting the apparatus. Flow meters attached to the inlet and outlet air lines and a magnehelic help to ensure balanced flow of air through the system. There are a total of 72 ports (36 on each side) that can be used for animal exposures and aerosol sampling or sealed off entirely. Note: Drawing not to scale.
The mass of aerosolized MWCNTs deposited in the lungs was estimated by multiplying the amount inhaled by the deposition fraction in the gas exchange/pulmonary (P) and tracheobronchial (Tb) regions of the respiratory tract. The fraction of inhaled aerosol deposited in each region of the respiratory tract is a function of aerosol particle size distribution for the liquid aerosol. The intended dose to be deposited in the respiratory tract was calculated by
where F = fraction deposited in respiratory tract region (function of particle size) = P + Tb = 14%,20C = aerosol MWCNT concentration (per liter of air) = 38 μg/L air, T = time of aerosol treatment (minutes), and V = inhaled minute volume of air by subject = 0.15 L/min or 9L/h for a 300 g rat.
The Heart nebulizer was operated at 10 L/min.70 The output concentration of liquid aerosol was ∼38 μL/L of air with ∼12 μL/L of water vapor. The aerosol was delivered simultaneously to several individual rats using a version of the multiport exposure apparatus previously described by Raabe and colleagues.71 The concentration of the MWCNTs in the nebulizer was 1 mg/mL, so the expected nebulizer output was 380 μg/min in 10 L of air. With no diluting air, the expected aerosol MWCNT concentration was 380 μg/min divided by 10 L/min of air or 38 μg/L (C). Therefore, the total amount of MWCNTs inhaled in 60 min by each rat would be ∼340 μg (about 1.1 mg/kg whole body mass). Assuming that the wet aerosol had a mass median aerodynamic diameter of about 2 μm (specified by Heart), the expected deposition would be ∼30 μg/h (8%) in the gas exchange/pulmonary region of the lung (P); ∼20 μg/h (6%) in the tracheobronchial region (Tb); and ∼170 μg (50%) in the head. Approximately 35% of the inhaled aerosol was expected to be exhaled.20
Aerosolized MWCNTs were characterized by mass, size, and morphology using gravimetric filter analysis, an inertial cascade impactor, and TEM, respectively. Sampling heads were coupled to the exposure chamber by attaching the sampler inlets to unused exposure ports. Each cascade impactor (CI)72 was fitted with eight 25 mm filters (1/stage). Individual samplers were connected to Universal XR pumps (SKC, Inc., Fullerton, CA, USA) with Tygon tubing. Air flow through the sampling assembly was set at 1 L/min. Sampling was performed concurrent to the exposure period with samplers placed in unused exposure ports. Field blanks were prepared and handled according to NIOSH Manual of Analytical Methods recommendations.
CI filter samples were taken to determine the aerodynamic size distribution of the MWCNT aerosol droplets. Seven-stage Mercer-type impactors with effective cutoff diameters ranging from 4.5 to 0.33 μm were used.72 Finally, ESP (In-Tox, Moriarty, NM, USA) samples were taken on Ultrathin Carbon TEM grids (Ted Pella Inc., Redding, CA, USA). These grab samples provided a snapshot of F-MWCNTs as they existed in the aerosol. Sampling times were 10 min for CI samplers and 5 s for ESP samplers. All gravimetric filter analyses were completed at the UC Davis Crocker Nuclear Laboratory. TEM analysis of ESP samples was completed by the Evans Laboratory, Department of Molecular and Cellular Biology, University of California, Davis, as previously described.73
Collection and Analysis of Biological Samples
At 1 or 21 days postexposure, animals were euthanized with an intraperitoneal injection of beuthanasia-D 7.5 mL/kg bodyweight followed by exsanguination. Collection of biological samples was completed as previously described.66 Blood was sent to the UC Davis Comparative Pathology Laboratory for CBC analysis. BALF supernatant was collected for same-day protein and LDH analyses, which were performed using kits from Thermo Scientific (Rockford, IL, USA) and Sigma-Aldrich (St. Louis, MO, USA), respectively. BALF cells were kept for determination of total cell numbers and cell viability with a hemocytometer and Trypan Blue exclusion dye, respectively. Total cell number, cell differentials, and particle uptake/retention (i.e., visible MWCNT inclusions in Mφ) were determined by bright-field microscopy, counting a minimum of 500 cells from a 100 mL cytospin slide stained with Diff Qwik (Dade Behring Inc., Newark, DE, USA). Blind analysis was completed by two observers to ensure minimal observer bias. After total cell numbers had been determined, remaining cells were centrifuged as previously described and resuspended in agarose for TEM analysis.66
In addition to blood and BALF, histological samples were collected from each animal. Each right lobe was frozen at −80 °C in a separate NUNC cryovial for PTA and/or other future histological analysis. The left lung was fixed hydrostatically (30 cm) using 4% paraformaldehyde, microdissected, dehydrated in a series of graded ethanol, embedded in paraffin, and sectioned to 5 μm with a microtome (HM 355, Microm, Walldorf, Germany).66 Lung sections were placed on slides and stained for analysis of (1) cellular infiltrates and epithelial abnormalities, (2) changes in mucosal production, and (3) collagenous fibrotic changes. These biological end points were observed using hematoxylin and eosin stains (H & E) (Harris hematoxylin and eosin Y stain), Alcian Blue/periodic acid Schiff stain (AB/PAS), and Picrosirius Red stain from American MasterTech, Inc. (Lodi, CA, USA).
A semiquantitative scoring method was used to distinguish the degree of alveolar, bronchiolar, perivascular, particle-associated, and pleural inflammation in the H & E-stained tissue sections.66 Briefly, before scoring began, an initial blind, qualitative assessment was done to determine the range of responses. Then, to minimize observer scoring subjectivity, a scoring rubric was made with categorical definitions and pictorial guidelines (Figures S4–S6) of the ordinal scores (0–3) roughly corresponding to no, minimal, moderate, and marked inflammation, respectively. Blind semiquantitative histological assessment of all samples was then performed in close succession to control for scoring variability. A qualitative assessment of AB/PAS- and Picrosirius Red stained-slides was also completed to determine hyperplasia of mucus-secreting goblet cells in the airways and/or changes in the types of mucosubstances being secreted and the presence of fibrotic lesions, respectively.
Transmission Electron Microscopy and Scanning Electron Microscopy
Ultrathin sections of resin-embedded Mφ were prepared as previously described73 and were examined on a JEOL JEM-2100-FEG transmission electron microscope (JEOL, Japan) operating at 200 keV. Micrographs were recorded using a 4096 × 4096 pixel Tietz CCD camera (TVIPS, Germany).
Lungs from animals exposed to MWCNTs by inhalation were fixed with Karnovsky’s fixative (0.9% glutaraldehyde/0.7% paraformaldehyde in cacodylate buffer, adjusted to pH 7.4, and 330 mOsmol/kg H2O) for 1 h at 30 cm of pressure. The fixed right middle lobe was then isolated and glued to a 22 mm2 coverslip (Corning Life Sciences, Lowell, MA, USA) with Nexaband tissue adhesive (Abbott Animal Health, North Chicago, IL, USA). The lobe was dissected to expose the airways from the interlobar bronchus to the terminal bronchioles. The samples were then (1) rinsed with 0.1 M sodium phosphate buffer to remove fixative; (2) dehydrated in graduating increments of ethanol (EtOH) for 15 min/step with three changes of 95% EtOH and three changes of 100% EtOH; and (3) further processed as described previously.74 Samples were mounted on aluminum stubs using double-sticky carbon tabs and sputter coated with gold using a PELCO SC-7 auto sputter coater (Ted Pella). They were then viewed on an FEI XL-30 TMP scanning electron microscope (FEI, Hillsboro, OR, USA), and images were acquired.75 Airways were imaged at bifurcations. Confirmation of the presence of MWCNTs in cilia was done by energy-dispersive X-ray spectroscopy. Work was performed on a Phillips FEG SEM at the Advanced Materials Characterization and Testing Lab (AMCaT) at UC Davis.
Programmed Thermal Analysis
PTA17 was used to quantify MWCNT clearance/retention on right caudal lung lobes from control and MWCNT-exposed animals. Particle loading was examined in the caudal lobe because it is the largest lobe and it represents the long airway path of the lung. Previous work suggests that much of the instilled/inhaled particles are deposited in the right caudal lobe.23,66 Deposition in the right caudal lobe is also less likely than the other right lobes to be significantly different between the two exposure methods76,77 given equivalent doses, particle formulations, and animals used. A two-step CNT extraction method followed by PTA allowed for highly sensitive and precise detection of MWCNTs with a method detection limit of approximately 700 ng. Complete details for detecting MWCNTs in digested lung tissues are described elsewhere.10 Briefly, lung tissue samples were mixed with Solvable at 60 °C for 24 h followed by treatment with proteinase K at 56 °C for 24 h. Samples were washed after each step to remove interfering carbon on the CNT surface. Samples were then loaded onto prefired quartz-fiber filters (Pall Tissuquartz filters, 2500 QAT-UP) and analyzed using PTA. Solvable consists of sodium hydroxide, and precautions should be taken when handling it.
The NIOSH 5040 method outlined for CNTs in air78 was not applicable to heterogeneous samples such as CNTs extracted from rat lung tissue because of the misinterpretation of the transmission analysis.17 As a result, a modified version of this, applicable to complex heterogeneous matrices such as rat lung tissue, was used.10,17
Statistical Analysis
Graphical data are presented as mean ± standard error of the mean whenever possible. Descriptive statistics from effect tests are presented in the text or tables and include group means (M), degrees of freedom (df), p-values (p), and/or confidence intervals. JMP 10.0.0 statistical software (Cary, NC, USA) was used to perform analysis of variance (ANOVA) and post hoc Tukey’s range tests. Tables show some values obtained from Tukey’s HSD Multiple Comparisons; here p-values were rounded up to 0.05, 0.01, or 0.001. Rat weights, histopathology scores, total cells, percent PMNs, LDH, total protein, percent particle-laden cells, and CBCs were analyzed. The analyses considered the main effects of and interactions between the factors, dose, time, particle formulation, and/or administration method. The data were first analyzed for deviations from the assumptions of ANOVA, and outliers were identified via box plots. Normal distribution results were confirmed by Q–Q plots and Shapiro-Wilk tests (p > 0.05 and/or W ≥ 95), which are useful for small sample sizes (n < 50), and homoscedasticity was confirmed with Levene and Bartlett’s tests. In cases when ANOVA was appropriate, the model included all data for a given biological end point to decrease error caused by multiple separate analyses. For all analyses, a p-value of 0.05 was used to determine significance. Although pathology scores were ordinal, these data were treated as continuous after confirming ANOVA assumptions were met. ANOVA instead of categorical analyses was run on histopathology scores to (1) enable tests of interactions between independent variables and (2) control for type I and II errors, which can be incurred by multiple separate nonparametric analyses.
Acknowledgments
Support for this research was provided by the University of California, Davis, Atmospheric Aerosols and Health Lead Campus Program (aah.ucdavis.edu), and NIEHS [1U01ES020127-01], Engineered Nanomaterials: Linking Physical and Chemical Properties to Biology. Pacific Northwest National Laboratory is operated by Battelle Memorial Institute for the U.S. Department of Energy under Contract Number DE-AC05-76RL01830. The authors wish to thank I. Espiritu, K. Johnson, A. Madl, D. Munshi, L. Mut, E. Patchin, J. Peake, L. Plummer, V. Seshachellam, D. Uyeminami, E. Andreozzi, Dr. T. Guo, and Dr. A. Louie for their assistance during the course of this study. Special thanks to Dr. L. Ashbaugh at Crocker Nuclear Lab of UC Davis, Dr. N. Willits at the UC Davis Statistical Laboratory, F. Hayes at the AMCaT Lab, and S. Smiley-Jewell and the Cellular and Molecular Imaging (CAMI) core facility at the Center for Health and the Environment, UC Davis.
Supporting Information Available
Tables showing significant post hoc comparisons of main effects: BALF total cells (104) postinstillation or -inhalation of MWCNTs in DM; square root-transformed number of neutrophils post-IT; square-root-transformed number of neutrophils post-IT; square root-transformed number of neutrophils postinhalation; square-root-transformed number of MWCNT-positive macrophages post-IT; day 21 histopathology post IT; day 21 histopathology postexposure (instillation vs inhalation). Figures of aerosolized F-MWCNTs in water; aerosolized MWCNTs in DM; instillation producing more BALF cells than inhalation; semiquantitative histopathology scoring rubric; illustrated histopathology scoring reference; histopathology resulting from MWCNT instillation. This material is available free of charge via the Internet at http://pubs.acs.org.
The authors declare no competing financial interest.
Funding Statement
National Institutes of Health, United States
Supplementary Material
References
- Kreyling W. G.; Hirn S.; Schleh C. Nanoparticles in the Lung. Nat. Biotechnol. 2010, 28, 1275–1276. [DOI] [PubMed] [Google Scholar]
- Mercer R. R.; Scabilloni J. F.; Hubbs A. F.; Wang L.; Battelli L. A.; McKinney W.; Castranova V.; Porter D. W. Extrapulmonary Transport of MWCNT Following Inhalation Exposure. Part. Fibre Toxicol. 2013, 10, 38. [DOI] [PMC free article] [PubMed] [Google Scholar]
- Bonner J. C.; Silva R. M.; Taylor A. J.; Brown J. M.; Hilderbrand S. C.; Castranova V.; Porter D.; Elder A.; Oberdorster G.; Harkema J. R.; etal. Interlaboratory Evaluation of Rodent Pulmonary Responses to Engineered Nanomaterials: The NIEHS NanoGO Consortium. Environ. Health Perspect. 2013, 121, 676–682. [DOI] [PMC free article] [PubMed] [Google Scholar]
- Takagi A.; Hirose A.; Nishimura T.; Fukumori N.; Ogata A.; Ohashi N.; Kitajima S.; Kanno J. Induction of Mesothelioma in P53± Mouse by Intraperitoneal Application of Multi-Wall Carbon Nanotube. J. Toxicol. Sci. 2008, 33, 105–116. [DOI] [PubMed] [Google Scholar]
- Murphy F. A.; Schinwald A.; Poland C. A.; Donaldson K. The Mechanism of Pleural Inflammation by Long Carbon Nanotubes: Interaction of Long Fibres with Macrophages Stimulates Them to Amplify Pro-Inflammatory Responses in Mesothelial Cells. Part. Fibre Toxicol. 2012, 9, 8. [DOI] [PMC free article] [PubMed] [Google Scholar]
- Sanchez V. C.; Weston P.; Yan A. H.; Hurt R. H.; Kane A. B. A 3-Dimensional in Vitro Model of Epithelioid Granulomas Induced by High Aspect Ratio Nanomaterials. Part. Fibre Toxicol. 2011, 8, 17. [DOI] [PMC free article] [PubMed] [Google Scholar]
- Patel V.Global Carbon Nanotubes Market - Industry Beckons; Nanowerk: Honolulu, HI, 2011. [Google Scholar]
- Elgrabli D.; Floriani M.; Abella-Gallart S.; Meunier L.; Gamez C.; Delalain P.; Rogerieux F.; Boczkowski J.; Lacroix G. Biodistribution and Clearance of Instilled Carbon Nanotubes in Rat Lung. Part. Fibre Toxicol. 2008, 5, 20. [DOI] [PMC free article] [PubMed] [Google Scholar]
- Mercer R. R.; Hubbs A. F.; Scabilloni J. F.; Wang L. Y.; Battelli L. A.; Schwegler-Berry D.; Castranova V.; Porter D. W. Distribution and Persistence of Pleural Penetrations by Multi-Walled Carbon Nanotubes. Part. Fibre Toxicol. 2010, 7, 28. [DOI] [PMC free article] [PubMed] [Google Scholar]
- Doudrick K.; Corson N.; Oberdörster G.; Eder A. C.; Herckes P.; Halden R. U.; Westerhoff P. Extraction and Quantification of Carbon Nanotubes in Biological Matrices with Application to Rat Lung Tissue. ACS Nano 2013, 7, 8849–8856. [DOI] [PMC free article] [PubMed] [Google Scholar]
- Ma-Hock L.; Strauss V.; Treumann S.; Kuttler K.; Wohlleben W.; Hofmann T.; Groters S.; Wiench K.; van Ravenzwaay B.; Landsiedel R., Comparative Inhalation Toxicity of Multi-Wall Carbon Nanotubes, Graphene, Graphite Nanoplatelets and Low Surface Carbon Black. Part. Fibre Toxicol. 2013, 10. [DOI] [PMC free article] [PubMed] [Google Scholar]
- Porter D.; Sriram K.; Wolfarth M.; Jefferson A.; Schwegler-Berry D.; Andrew M.; Castranova V. A Biocompatible Medium for Nanoparticle Dispersion. Nanotoxicology 2008, 2, 144–154. [Google Scholar]
- Wei Z.; Belay A. B.; Davis K.; Sorloaica-Hickman N. In Transparent Conductive Film Fabrication by Carbon Nanotube Ink Spray Coating and Ink-Jet Printing; Photovoltaic Specialists Conference (PVSC), 38th IEEE, June 3–8, 2012; 2012; pp 002324–002327. [Google Scholar]
- Sarlak N.; Taherifar A.; Salehi F. Synthesis of Nanopesticides by Encapsulating Pesticide Nanoparticles Using Functionalized Carbon Nanotubes and Application of New Nanocomposite for Plant Disease Treatment. J. Agric. Food Chem. 2014, 62, 4833–4838. [DOI] [PubMed] [Google Scholar]
- Zhang C. H.; Luo Y. L.; Chen Y. S.; Wei Q. B.; Fan L. H. Preparation and Theophylline Delivery Applications of Novel PMAA/MWCNT-COOH Nanohybrid Hydrogels. J. Biomat. Sci.-Polym. E 2009, 20, 1119–1135. [DOI] [PubMed] [Google Scholar]
- Chen S.; Goode A. E.; Sweeney S.; Theodorou I. G.; Thorley A. J.; Ruenraroengsak P.; Chang Y.; Gow A.; Schwander S.; Skepper J.; etal. Sulfidation of Silver Nanowires inside Human Alveolar Epithelial Cells: A Potential Detoxification Mechanism. Nanoscale 2013, 5, 9839–9847. [DOI] [PMC free article] [PubMed] [Google Scholar]
- Doudrick K.; Herckes P.; Westerhoff P. Detection of Carbon Nanotubes in Environmental Matrices Using Programmed Thermal Analysis. Environ. Sci. Technol. 2012, 46, 12246–12253. [DOI] [PMC free article] [PubMed] [Google Scholar]
- Xia T.; Hamilton R. F. Jr.; Bonner J. C.; Crandall E. D.; Elder A.; Fazlollahi F.; Girtsman T. A.; Kim K.; Mitra S.; Ntim S. A.; Orr G.; Tagmount M.; Taylor A. J.; Telesca D.; Tolic A.; Vulpe C. D.; Walker A. J.; Wang X.; Witzmann F. A.; Wu N.; Xie Y.; Zink J. I.; Nel A.; Holian A. Interlaboratory Evaluation of in Vitro Cytotoxicity and Inflammatory Responses to Engineered Nanomaterials: The NIEHS Nano GO Consortium. Environ. Health Persp. 2013, 121, 683–690. [DOI] [PMC free article] [PubMed] [Google Scholar]
- Birch M. E.; Ruda-Eberenz T. A.; Chai M.; Andrews R.; Hatfield R. L. Properties that Influence the Specific Surface Areas of Carbon Nanotubes and Nanofibers. Ann. Occup. Hyg. 2013, 57, 1148–1166. [DOI] [PMC free article] [PubMed] [Google Scholar]
- Raabe O. G.; Al-Bayati M. A.; Teague S. V.; Rasolt A. Regional Deposition of Inhaled Monodisperse Coarse and Fine Aerosol Particles in Small Laboratory Animals. Ann. Occup. Hyg. 1988, 32, 53–63. [Google Scholar]
- Meban C. Surface Viscosity of Surfactant Films from Human Lungs. Respir. Physiol. 1978, 33, 219–227. [DOI] [PubMed] [Google Scholar]
- O’Shaughnessy P. T.; Raabe O. G., A Comparison of Cascade Impactor Data Reduction Methods. Aerosol. Sci. Technol. 2003, 37, 187–200. [Google Scholar]
- Asgharian B.; Kelly J. T.; Tewksbury E. W. Respiratory Deposition and Inhalability of Monodisperse Aerosols in Long-Evans Rats. Toxicol. Sci. 2003, 71, 104–111. [DOI] [PubMed] [Google Scholar]
- Schinwald A.; Donaldson K.. Use of Back-Scatter Electron Signals to Visualise Cell/Nanowires Interactions in Vitro and in Vivo; Frustrated Phagocytosis of Long Fibres in Macrophages and Compartmentalisation in Mesothelial Cells in Vivo. Part. Fibre Toxicol. 2012, 9, 1–13. [DOI] [PMC free article] [PubMed] [Google Scholar]
- Mercer R. R.; Hubbs A. F.; Scabilloni J. F.; Wang L. Y.; Battelli L. A.; Friend S.; Castranova V.; Porter D. W. Pulmonary Fibrotic Response to Aspiration of Multi-Walled Carbon Nanotubes. Part. Fibre Toxicol. 2011, 8, 21. [DOI] [PMC free article] [PubMed] [Google Scholar]
- Porter D. W.; Hubbs A. F.; Mercer R. R.; Wu N. Q.; Wolfarth M. G.; Sriram K.; Leonard S.; Battelli L.; Schwegler-Berry D.; Friend S.; etal. Mouse Pulmonary Dose- and Time Course-Responses Induced by Exposure to Multi-Walled Carbon Nanotubes. Toxicology 2010, 269, 136–147. [DOI] [PubMed] [Google Scholar]
- Zhu L.; Schrand A. M.; Voevodin A. A.; Chang D. W.; Dai L.; Hussain S. M. Assessment of Human Lung Macrophages after Exposure to Multi-Walled Carbon Nanotubes Part I. Cytotoxicity. Nanosci. Nanotechnol. Lett. 2011, 3, 88–93. [Google Scholar]
- Li R.; Wang X.; Ji Z.; Sun B.; Zhang H.; Chang C. H.; Lin S.; Meng H.; Liao Y. P.; Wang M.; etal. Surface Charge and Cellular Processing of Covalently Functionalized Multiwall Carbon Nanotubes Determine Pulmonary Toxicity. ACS Nano 2013, 7, 2352–2368. [DOI] [PMC free article] [PubMed] [Google Scholar]
- Jain S.; Thakare V. S.; Das M.; Godugu C.; Jain A. K.; Mathur R.; Chuttani K.; Mishra A. K. Toxicity of Multiwalled Carbon Nanotubes with End Defects Critically Depends on Their Functionalization Density. Chem. Res. Toxicol. 2011, 24, 2028–2039. [DOI] [PubMed] [Google Scholar]
- Hamilton R. F. Jr.; Wu Z.; Mitra S.; Shaw P. K.; Holian A. Effect of MWCNT Size, Carboxylation, and Purification on in Vitro and in Vivo Toxicity, Inflammation and Lung Pathology. Part. Fibre Toxicol. 2013, 10, 57. [DOI] [PMC free article] [PubMed] [Google Scholar]
- Hamilton R. F. Jr.; Buford M.; Xiang C.; Wu N.; Holian A. NLRP3 Inflammasome Activation in Murine Alveolar Macrophages and Related Lung Pathology Is Associated with MWCNT Nickel Contamination. Inhal. Toxicol. 2012, 24, 995–1008. [DOI] [PMC free article] [PubMed] [Google Scholar]
- Hamilton R. F.; Xiang C. C.; Li M.; Ka I.; Yang F.; Ma D. L.; Porter D. W.; Wu N. Q.; Holian A. Purification and Sidewall Functionalization of Multiwalled Carbon Nanotubes and Resulting Bioactivity in Two Macrophage Models. Inhal. Toxicol. 2013, 25, 199–210. [DOI] [PMC free article] [PubMed] [Google Scholar]
- Ellinger-Ziegelbauer H.; Pauluhn J. Pulmonary Toxicity of Multi-Walled Carbon Nanotubes (Baytubes) Relative to Alpha-Quartz Following a Single 6h Inhalation Exposure of Rats and a 3 Months Post-Exposure Period. Toxicology 2009, 266, 16–29. [DOI] [PubMed] [Google Scholar]
- Ge C.; Li Y.; Yin J.-J.; Liu Y.; Wang L.; Zhao Y.; Chen C. The Contributions of Metal Impurities and Tube Structure to the Toxicity of Carbon Nanotube Materials. NPG Asia Mater. 2012, 4, e32. [Google Scholar]
- Shvedova A. A.; Castranova V.; Kisin E. R.; Schwegler-Berry D.; Murray A. R.; Gandelsman V. Z.; Maynard A.; Baron P. Exposure to Carbon Nanotube Material: Assessment of Nanotube Cytotoxicity Using Human Keratinocyte Cells. J. Toxicol. Environ. Health, Part A 2003, 66, 1909–1926. [DOI] [PubMed] [Google Scholar]
- Kostarelos K.; Bianco A.; Prato M. Promises, Facts and Challenges for Carbon Nanotubes in Imaging and Therapeutics. Nat. Nanotechnol. 2009, 4, 627–633. [DOI] [PubMed] [Google Scholar]
- Vardharajula S.; Ali S. Z.; Tiwari P. M.; Eroglu E.; Vig K.; Dennis V. A.; Singh S. R. Functionalized Carbon Nanotubes: Biomedical Applications. Int. J. Nanomed. 2012, 7, 5361–5374. [DOI] [PMC free article] [PubMed] [Google Scholar]
- Kim J. E.; Lim H. T.; Minai-Tehrani A.; Kwon J. T.; Shin J. Y.; Woo C. G.; Choi M.; Baek J.; Jeong D. H.; Ha Y. C.; etal. Toxicity and Clearance of Intratracheally Administered Multiwalled Carbon Nanotubes from Murine Lung. J. Toxicol. Environ Health, Part A 2010, 73, 1530–1543. [DOI] [PubMed] [Google Scholar]
- Sager T. M.; Wolfarth M. W.; Andrew M.; Hubbs A.; Friend S.; Chen T. H.; Porter D. W.; Wu N.; Yang F.; Hamilton R. F.; etal. Effect of Multi-Walled Carbon Nanotube Surface Modification on Bioactivity in the C57bl/6 Mouse Model. Nanotoxicology 2014, 8, 317–327. [DOI] [PMC free article] [PubMed] [Google Scholar]
- Xia T.; Malasarn D.; Lin S.; Ji Z.; Zhang H.; Miller R. J.; Keller A. A.; Nisbet R. M.; Harthorn B. H.; Godwin H. A.; etal. Implementation of a Multidisciplinary Approach to Solve Complex Nano EHS Problems by the UC Center for the Environmental Implications of Nanotechnology. Small 2012, 9, 1428–1443. [DOI] [PubMed] [Google Scholar]
- Wang X.; Xia T. A.; Ntim S. A.; Ji Z. X.; George S.; Meng H. A.; Zhang H. Y.; Castranova V.; Mitra S.; Nel A. E. Quantitative Techniques for Assessing and Controlling the Dispersion and Biological Effects of Multiwalled Carbon Nanotubes in Mammalian Tissue Culture Cells. ACS Nano 2010, 4, 7241–7252. [DOI] [PMC free article] [PubMed] [Google Scholar]
- Raffa V.; Ciofani G.; Vittorio O.; Riggio C.; Cuschieri A. Physicochemical Properties Affecting Cellular Uptake of Carbon Nanotubes. Nanomedicine (London, U.K.) 2010, 5, 89–97. [DOI] [PubMed] [Google Scholar]
- Porter A. E.; Gass M.; Muller K.; Skepper J. N.; Midgley P. A.; Welland M. Direct Imaging of Single-Walled Carbon Nanotubes in Cells. Nat. Nanotechnol. 2007, 2, 713–717. [DOI] [PubMed] [Google Scholar]
- Pantarotto D.; Singh R.; McCarthy D.; Erhardt M.; Briand J. P.; Prato M.; Kostarelos K.; Bianco A. Functionalized Carbon Nanotubes for Plasmid DNA Gene Delivery. Angew. Chem., Int. Ed 2004, 43, 5242–5246. [DOI] [PubMed] [Google Scholar]
- Jin H.; Heller D. A.; Sharma R.; Strano M. S. Size-Dependent Cellular Uptake and Expulsion of Single-Walled Carbon Nanotubes: Single Particle Tracking and a Generic Uptake Model for Nanoparticles. ACS Nano 2009, 3, 149–158. [DOI] [PubMed] [Google Scholar]
- Kam N. W.; Liu Z.; Dai H. Carbon Nanotubes as Intracellular Transporters for Proteins and DNA: An Investigation of the Uptake Mechanism and Pathway. Angew. Chem., Int. Ed. 2006, 45, 577–581. [DOI] [PubMed] [Google Scholar]
- Haniu H.; Saito N.; Matsuda Y.; Kim Y. A.; Park K. C.; Tsukahara T.; Usui Y.; Aoki K.; Shimizu M.; Ogihara N.; etal. Effect of Dispersants of Multi-Walled Carbon Nanotubes on Cellular Uptake and Biological Responses. Int. J. Nanomed. 2011, 6, 3295–3307. [DOI] [PMC free article] [PubMed] [Google Scholar]
- Yang S. T.; Luo J.; Zhou Q.; Wang H. Pharmacokinetics, Metabolism and Toxicity of Carbon Nanotubes for Biomedical Purposes. Theranostics 2012, 2, 271–282. [DOI] [PMC free article] [PubMed] [Google Scholar]
- Bihari P.; Vippola M.; Schultes S.; Praetner M.; Khandoga A. G.; Reichel C. A.; Coester C.; Tuomi T.; Rehberg M.; Krombach F. Optimized Dispersion of Nanoparticles for Biological in Vitro and in Vivo Studies. Part. Fibre Toxicol. 2008, 5, 14. [DOI] [PMC free article] [PubMed] [Google Scholar]
- Nel A. E.; Madler L.; Velegol D.; Xia T.; Hoek E. M. V.; Somasundaran P.; Klaessig F.; Castranova V.; Thompson M. Understanding Biophysicochemical Interactions at the Nano-Bio Interface. Nat. Mater. 2009, 8, 543–557. [DOI] [PubMed] [Google Scholar]
- Ruh H.; Kuhl B.; Brenner-Weiss G.; Hopf C.; Diabate S.; Weiss C. Identification of Serum Proteins Bound to Industrial Nanomaterials. Toxicol. Lett. 2012, 208, 41–50. [DOI] [PubMed] [Google Scholar]
- Gasser M.; Rothen-Rutishauser B.; Krug H. F.; Gehr P.; Nelle M.; Yan B.; Wick P. The Adsorption of Biomolecules to Multi-Walled Carbon Nanotubes Is Influenced by Both Pulmonary Surfactant Lipids and Surface Chemistry. J. Nanobiotechnol. 2010, 8, 31. [DOI] [PMC free article] [PubMed] [Google Scholar]
- Baisch B. L.; Corson N. M.; Wade-Mercer P.; Gelein R.; Kennell A. J.; Oberdorster G.; Elder A. Equivalent Titanium Dioxide Nanoparticle Deposition by Intratracheal Instillation and Whole Body Inhalation: The Effect of Dose Rate on Acute Respiratory Tract Inflammation. Part. Fibre Toxicol. 2014, 11, 5. [DOI] [PMC free article] [PubMed] [Google Scholar]
- Osier M.; Oberdorster G. Intratracheal Inhalation vs Intratracheal Instillation: Differences in Particle Effects. Fundam. Appl. Toxicol. 1997, 40, 220–227. [DOI] [PubMed] [Google Scholar]
- Shi X.; von dem Bussche A.; Hurt R. H.; Kane A. B.; Gao H. Cell Entry of One-Dimensional Nanomaterials Occurs by Tip Recognition and Rotation. Nat. Nanotechnol. 2011, 6, 714–719. [DOI] [PMC free article] [PubMed] [Google Scholar]
- Kostarelos K.; Lacerda L.; Pastorin G.; Wu W.; Wieckowski S.; Luangsivilay J.; Godefroy S.; Pantarotto D.; Briand J. P.; Muller S.; etal. Cellular Uptake of Functionalized Carbon Nanotubes Is Independent of Functional Group and Cell Type. Nat. Nanotechnol. 2007, 2, 108–113. [DOI] [PubMed] [Google Scholar]
- Cheng J.; Fernando K. A.; Veca L. M.; Sun Y. P.; Lamond A. I.; Lam Y. W.; Cheng S. H. Reversible Accumulation of Pegylated Single-Walled Carbon Nanotubes in the Mammalian Nucleus. ACS Nano 2008, 2, 2085–2094. [DOI] [PubMed] [Google Scholar]
- Bonner J. C. Nanoparticles as a Potential Cause of Pleural and Interstitial Lung Disease. Proc. Am. Thorac. Soc. 2010, 7, 138–141. [DOI] [PMC free article] [PubMed] [Google Scholar]
- Oberdorster G. Nanotoxicology: In Vitro-in Vivo Dosimetry. Environ. Health Perspect. 2012, 120, A13.author reply A13. [DOI] [PMC free article] [PubMed] [Google Scholar]
- Chen Y. H.; Mitra S. Fast Microwave-Assisted Purification, Functionalization and Dispersion of Multi-Walled Carbon Nanotubes. J. Nanosci. Nanotechnol. 2008, 8, 5770–5775. [DOI] [PubMed] [Google Scholar]
- Wang Y. B.; Iqbal Z.; Mitra S. Microwave-Induced Rapid Chemical Functionalization of Single-Walled Carbon Nanotubes. Carbon 2005, 43, 1015–1020. [Google Scholar]
- Wang Y. B.; Iqbal Z.; Mitra S. Rapidly Functionalized, Water-Dispersed Carbon Nanotubes at High Concentration. J. Am. Chem. Soc. 2006, 128, 95–99. [DOI] [PubMed] [Google Scholar]
- Chen Y.; Iqbal Z.; Mitra S. Microwave-Induced Controlled Purification of Single-Walled Carbon Nanotubes without Sidewall Functionalization. Adv. Funct. Mater. 2007, 17, 3946–3951. [Google Scholar]
- CDC Niosh Manual of Analytical Methods: Carbon Black (5000). http://www.cdc.gov/niosh/docs/2003-154/pdfs/5000.pdf (accessed January 2014).
- Niosh Manual of Analytical Methods: Elemental Carbon (Diesel Particulate) (5040), CDC, 1999. [Google Scholar]
- Silva R. M.; Teesy C.; Franzi L.; Weir A.; Westerhoff P.; Evans J. E.; Pinkerton K. E. Biological Response to Nano-Scale Titanium Dioxide (TiO2): Role of Particle Dose, Shape, and Retention. J. Toxicol. Environ. Health, Part A 2013, 76, 953–972. [DOI] [PMC free article] [PubMed] [Google Scholar]
- Han J. H.; Lee E. J.; Lee J. H.; So K. P.; Lee Y. H.; Bae G. N.; Lee S. B.; Ji J. H.; Cho M. H.; Yu I. J. Monitoring Multiwalled Carbon Nanotube Exposure in Carbon Nanotube Research Facility. Inhal. Toxicol. 2008, 20, 741–749. [DOI] [PubMed] [Google Scholar]
- Maynard A. D.; Kuempel E. D. Airborne Nanostructured Particles and Occupational Health. J. Nanopart. Res. 2005, 7, 587–614. [Google Scholar]
- Stone K. C.; Mercer R. R.; Gehr P.; Stockstill B.; Crapo J. D. Allometric Relationships of Cell Numbers and Size in the Mammalian Lung. Am. J. Respir. Cell Mol. Biol. 1992, 6, 235–243. [DOI] [PubMed] [Google Scholar]
- Raabe O. G.; Wong T. M.; Wong G. B.; Roxburgh J. W.; Piper S. D.; Lee J. I. C. Continuous Nebulization Therapy for Asthma with Aerosols of Beta(2) Agonists. Ann. Allergy Asthma Immunol. 1998, 80, 499–508. [DOI] [PubMed] [Google Scholar]
- Raabe O. G.; Bennick J. E.; Light M. E.; Hobbs C. H.; Thomas R. L.; Tillery M. I. Improved Apparatus for Acute Inhalation Exposure of Rodents to Radioactive Aerosols. Toxicol. Appl. Pharmacol. 1973, 26, 264–273. [DOI] [PubMed] [Google Scholar]
- Raabe O. G.Design and Use of the Mercer-Style Impactor for Characterization of Aerosol Size Distributions. In Aerosol Measurement; Lundgren D. A.; Harris F. S. Jr.; Marlow W. H.; Lippmann M.; Clark W. E. Durham M. D., Eds.; University of Presses of Florida: Gainesville, FL, 1979; pp 135–142. [Google Scholar]
- Vu V. D., Dutrow G. H.; Silva R.; Carlson D. B.; Pinkerton K. E. Evans J. E.. 3D Ultrastructural Evidence for Differential Carbon Nanotube Uptake and Cellular Localization Based on Physicochemical Characteristics. Manuscript in preparation. [Google Scholar]
- Toskala E.; Smiley-Jewell S. M.; Wong V. J.; King D.; Plopper C. G. Temporal and Spatial Distribution of Ciliogenesis in the Tracheobronchial Airways of Mice. Am. J. Physiol. Lung Cell Mol. Physiol. 2005, 289, L454–459. [DOI] [PMC free article] [PubMed] [Google Scholar]
- Sutherland K. M.; Edwards P. C.; Combs T. J.; Van Winkle L. S. Sex Differences in the Development of Airway Epithelial Tolerance to Naphthalene. Am. J. Physiol Lung Cell Mol. Physiol. 2012, 302, L68–81. [DOI] [PMC free article] [PubMed] [Google Scholar]
- Brain J. D.; Knudson D. E.; Sorokin S. P.; Davis M. A. Pulmonary Distribution of Particles Given by Intratracheal Instillation or by Aerosol Inhalation. Environ. Res. 1976, 11, 13–33. [DOI] [PubMed] [Google Scholar]
- Pritchard J. N.; Holmes A.; Evans J. C.; Evans N.; Evans R. J.; Morgan A. The Distribution of Dust in the Rat Lung Following Administration by Inhalation and by Single Intratracheal Instillation. Environ. Res. 1985, 36, 268–297. [DOI] [PubMed] [Google Scholar]
- CDC Current Intelligence Bulletin 65: Occupational Exposure to Carbon Nanotubes and Nanofibers. http://www.cdc.gov/niosh/docs/2013-145/pdfs/2013-145.pdf (accessed January 2014).
Associated Data
This section collects any data citations, data availability statements, or supplementary materials included in this article.