

Abstract
Automatic facial Action Unit (AU) detection from video is a long-standing problem in facial expression analysis. AU detection is typically posed as a classification problem between frames or segments of positive examples and negative ones, where existing work emphasizes the use of different features or classifiers. In this paper, we propose a method called Cascade of Tasks (CoT) that combines the use of different tasks (i.e., frame, segment and transition) for AU event detection. We train CoT in a sequential manner embracing diversity, which ensures robustness and generalization to unseen data. In addition to conventional frame-based metrics that evaluate frames independently, we propose a new event-based metric to evaluate detection performance at event-level. We show how the CoT method consistently outperforms state-of-the-art approaches in both frame-based and event-based metrics, across three public datasets that differ in complexity: CK+, FERA and RU-FACS.
1. Introduction
Facial expressions convey varied and nuanced meanings. Small variations in the timing and packaging of smiles, for instance, can communicate a polite greeting, felt enjoyment, embarrassment, or social discomfort [1, 14]. To analyze information afforded by facial expression, Ekman and Friesen proposed the Facial Action Coding System (FACS) [12]. FACS describes facial activity in terms of anatomically based action units. Action units can occur alone or in combinations to represent all possible facial expressions. Action units (AUs) have a temporal envelope that minimally include an an onset (or start) and an offset (or stop) and may include change in intensity. Depending on the version of FACS, 33 to 44 AUs are defined [8]. Because of its descriptive power, FACS has become widely used to study facial expression [13]. In computer vision, automated AU detection has become an active area of research [2, 6, 19, 27, 28, 31, 39] with a wide range of applications, such as marketing, mental health, instructional technology, and media arts [9].
Automatic AU detection is a challenging problem. Non-frontal pose and moderate to large head motion make facial image registration difficult; large variability occurs in the temporal scale of facial actions; individual differences occur in shape and appearance of facial features; many facial actions are inherently subtle; and the possible combinations of 30 to 40 or more AUs number in the thousands. Due to the latter, AU detection typically is decomposed to a binary classification problem on each AU.
Existing AU detection methods broadly fall into one of three types: frame-level, segment-level, and transition. Frame-level detection independently evaluates each video frame for the occurrence of one or more AUs. Segment-level detection seeks to detect contiguous occurrences of AU that ideally map onto what manual FACS coders perceive as an event. Transition detection seeks to detect the onset and offset of each segment, or event. Examples of frame-level detection are [2, 6, 18, 33, 36, 37, 39]. Examples of segment-level detection are [4, 26, 27, 30], and examples of transition detection are [11]. See [10, 21] for recent surveys.
With few exceptions, most approaches to AU detection are frame-level detectors. They consider each video frame as independent. Because this assumption ignores the inherent auto-correlation of behavioral data, AU detection tends to be noisy with classifiers firing on and off in proximal frames. By contrast, human observers do not evaluate video frames individually. They perceive AU as events that have a beginning (onset), an ending (offset), and a certain duration. Much effort in manual FACS coding consists of first perceiving an AU event and then identifying its precise onset and offset. Segment-level AU detection aspires to identify such events. Often, segment detectors miss AUs in the vicinity of onsets and offsets where discriminability is low. They do best when AUs are at high intensity and more poorly when at low intensity. We seek to detect AU events including onsets and offsets with high fidelity to human perception.
To achieve this goal, we propose a cascade of tasks (CoT). CoT detects AU events including their onsets and offsets, by sequentially integrating the three AU detection tasks: frame-level detection, segment-level detection, and detection of onsets and offsets. Fig. 1 illustrates the main idea of CoT. The first task detects AU at frame-level. The results of this task tend to be noisy, or less reliable, because frame-level detection fails to exploit the temporal dependencies among proximal frames. The second task combines the output of the frame-level detection with new segment-level features with segment-based classifier (see Fig. 1 second row). Observe that the segment-level detector gives a rough location of the AU event and reduces the frame-level false positives, but it is imprecise in the boundaries (i.e., onset and offset). The third and final task refines the onset and offset locations. By integrating the three tasks, CoT provides a more robust and precise detection of AUs than previous approaches that focus on only one or the other of these tasks.
Figure 1.

Detection of AU 12 (smile) from its onset to offset using our proposed CoT method. In the plots to the right above, thick grey lines indicate ground truth and thin lines indicate prediction results. First, CoT detects AU 12 in individual frames (Task 1). Because this step assumes that individual frames are independent, it is prone to error. Next, CoT uses the responses of the frame-level detector and segment-based features to detect a segment for AU 12 (Task 2). Finally, CoT more precisely estimates the onset and offset frames by learning transition detectors (Task 3).
Our contributions are two-fold. 1) To the best of our knowledge, CoT is the first approach to integrate multiple tasks for AU detection. Recall that most algorithms for AU detection emphasize the use of different features or classifier, or combine them with ensemble-type methods to solve one task. However, our approach combines different tasks. 2) CoT fully recovers AU events instead of isolated AU frames or incorrectly parsed segments. To evaluate AU detection performance at event-level, we propose a new event-based metric, as opposed to conventional frame-based metrics that evaluate frames independently.
2. Previous Work
We broadly categorize AU detection approaches into three types of task: frame-level, segment-level and transition. In the following we briefly review each in turn. Within each of these approaches, most research on AU detection differs on the methods for registration, feature representation, and classifier learning. Below we review some of the most recent work. Interested readers are referred to more complete surveys of these aspects [10, 19, 21, 31].
Frame-level methods detect AU occurrence in individual frames. The first AU detection challenge (FERA) [31] indicates that most approaches, including the winning one, were frame-based. Frame-level detection is done by extracting geometric or appearance features to represent each frame, and then feeds the features into static classifiers (e.g., SVM [5, 6] or AdaBoost [2, 39]). Geometric features contain information of facial feature shapes, including landmark locations [5,17,18] and geometry of facial components [38]; appearance features capture texture changes of the face, such as wrinkles and furrows, and can be typically represented by Gabor [2], LBP [16, 37] and DAISY/SIFT descriptors [39]. A recent notable trend in this area is fusing various features/classifiers. The intuition is that each feature brings unique information but also errors, and fusing various features generates more accurate and robust results than otherwise possible. As an example, [29] concatenated image features, including SIFT, Hierarchical Gaussianization and optical flow, as input to a SVM classifier. In [28], after classifiers were trained separately with several low-level image features, their outputs were fused using log sum. Frame-level detectors are shown to be able to detect subtle AU events because of the sensitivity to each frame. However, they are usually prone to noise due to the lack of temporal consistency.
Segment-level approaches seek to incorporate temporal information by using either dynamic features or temporal classifiers. Dynamic features aim to measure motions on a face, such as raising mouth corners. Recent work on exploiting dynamic features includes bag of temporal words [27] and temporal extensions of LBP and LPQ [16, 36]. Temporal classifiers model the AU state changes over time to improve recognition performance. Recent temporal classifiers include segment-based SVM [27], Dynamic Bayesian Networks (DBN) [30], Hidden Markov Model (HMM) [32] and Conditional Random Fields (CRF) [4,24]. Segment-level methods make better AU detection in form of a set of contiguous frames, which is closer to human perception. However, these methods tend to favor segments with high AU intensity, leading to mis-detection on AU boundaries and partial detection around the AU apex. Moreover, the segment-level data are more complicated to represent and have fewer training samples compared to frame-level detection. In consequence, segment-level methods usually perform poorly in detecting subtle AU events.
An important yet relatively unexplored task is to detect only AU transition (onsets and offsets), which is arguably challenging due to subtle changes between AU and non-AU frames. In previous approaches, accurate transition detection was detected with the help of additional information, such as an AU apex location [11]. To address the problems encountered in the above three tasks, this study proposes to integrate them in a sequential manner. We term this integration the Cascade of Tasks (CoT). To the best of our knowledge, CoT is the first work that jointly tackles multiple tasks.
3. Cascade of Tasks (CoT)
This section introduces the proposed Cascade of Tasks (CoT) for detecting facial AU events. Unlike previous AU detection methods that combine features and classifiers for one particular task, CoT sequentially integrates three different tasks: 1) Frame-level detection: detecting AU presence/absence on bases of information extracted from a single frame; 2) Segment-level detection: detecting AU segments from contiguous frames; 3) Transition detection: recognizing transitions between AU and non-AU frames. Below we explain each of the tasks in detail.
3.1. Frame-level Detection
For frame-level detector we used a Support Vector Machine (SVM) trained on appearance features (SIFT descriptors) following [39]. We trained the SVM using a leave-one-subject-out strategy. These frame-level detectors offer reasonable predictions for frames with AU presence, but often are prone to noise due to the lack of temporal consistency. Fig. 2(a) illustrates a frame-based detector on a video of 31 frames that contains the onset of an AU 12. Observe that the frame-level detector detects correctly the frames where the AU is present (12-31 frames) but has many false positives. While the frame-level detector may contain a large number of isolated false detected frames, they are fast and easy to train. We will use the output of the frame-level detector (ffrm) to improve the subsequent task (i.e., segment-level detection).
Figure 2.
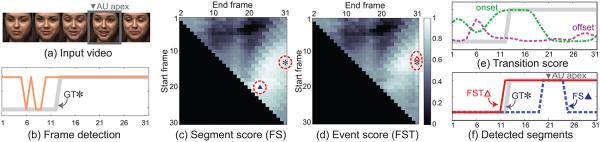
Example from the RU-FACS dataset [2]: (a) A video of subject 77, (b) Frame detection result in thin orange line and ground truth (GT) in thick gray line. (c) A segment score matrix for frame+segment (FS) detection. The higher the score is, the more likely that there is an AU in this segment. (d) Event score matrix for FS+transition (FST) detection. Using the transition score in (e) as a refinement, FST detector ( ) fires at (12,31), which better approaches the GT. (f) Detected segments.
3.2. Segment-level SVM
To eliminate isolated false detections while preserving the sensitivity of frame-level detectors, we will use the outputs of the frame-level detection in combination with new segment-based features.
Segment-level feature:
We divide each segment evenly into three sub-segments, and compute for each sub-segment a temporal bag of words [27] with geometric features [38], as a complement to the appearance features used in the frame-level detector. Introducing this geometric features promotes diversity among the tasks and hence produces more robust AU detection (as will be shown in Section 4). For each sub-segment, we also incorporate the statistics of the output scores from the frame-level detector ffrm. In particular, we include the maximum, minimum, mean and median over the frames that constitute the sub-segment. The final segment-level representation is a concatenation of the histograms of temporal words and frame score statistics from the three sub-segments.
Segment-level detector:
Given the segment-level features and the prediction scores from the frame-level detectors, we train the segment-level detector using a weighted margin SVM [34]:
| (1) |
where n is the number of training segments and are the slack variables. ψ(S[sk, ek]) denotes a segment-level feature for the kth segment, S[sk, ek], starting in the frame and ending in the frame. To simplify the notation, we concatenate the segment features ψ(S[sk, ek]) with 1 to compensate for the offset. yk ∈ {−1, 1} denote the labels. are confidence weights that give more importance to some segments than others. The higher νk the more important the segment will be in the classification process. Recall that in segment-level detection, the positive segments are the manually labelled AU events (of different length and intensity). The negative segments are sampled segments at random locations and temporal scales, and typically outnumber positive segments. For each segment S[sk, ek], we computed the confidence weight as the averaged absolute value of the frame-level detection scores, that is , where is the output of the frame-level detector in ith frame. With this definition of confidence weights, we give more importance to the segments that are more likely to contain many frames where the frame-level detector returns higher scores. Given a segment S[sk, ek], the decision value of segment-level detector is denoted as fseg(S[sk, ek])=w⊺ψ(S[sk, ek])/νk.
Segment-level detectors achieve more robust decision on contiguous frames, but often mis-detect subtle AU events due to insufficient positive events for training, specially in the onset and offset. Fig. 2(c) illustrates the score matrix (31×31) of the segment-level detector on a video of 31 frames. Each entry (i, j) of the matrix corresponds to the segment-level score that starts in the ith frame and ends in the jth frame. The higher the score the more likely that the segment contains an AU. In this particular case, the ground truth solution (GT (*)) is located at (13,31). However, the segment-based detector (FS detector) ( ) finds the maximum score at (20,24). The segment-level detection (blue dashed line in Fig. 2(f)) fires in a small region around AU apex, because it is where the signal is stronger. In order to improve the detection around the onset/offset, we will add the transition detection task.
3.3. Transition Detection
As discussed above, segment-level detections are often inaccurate in the boundaries (onsets and offsets) of AU events. In this section, we propose a transition detection to refine boundaries of the segments previously detected.
We train two detectors, one for onsets and the other for offsets, using linear SVM models. We denote the detectors as fon and foff. We construct positive samples by extracting segment-level features in segments centered in the offsets and onsets. We select a window of 6 frames before each onset/offset and 6 frames after, so our segments are of 13 frames. Negative samples are randomly generated as segments of different length that do not contain label changes. Fig. 2(e) shows an example of onset detector scores (green dotted line) and offset detector scores (purple dotted line). As it can be seen in Fig. 2(e) transition detectors are prone to noise and contain many false positives. However, a high response appears around the true onset, which allows CoT to refine the boundaries of detected segments with this partially correct information.
We linearly combine the transition and segment detection scores. Specifically, for any given segment S[s, e], we define the event score as fevent(S[s, e]) = αfseg(S[s, e]) + βfon(s)+(1−α−β)foff(e). The combining parameters α and β indicate confidence on detectors and are learned by cross-validation. In practice, AUs with larger facial movements, e.g., AU 12, tend to have larger values on the parameters for transition detectors. Fig. 2(d) shows the event score matrix of all possible segments in the input video. The maximal score entry ( ) provides a better estimate of the ground truth (*) compared to the one obtained by the segment-level score matrix without transition scores (Fig. 2(c)).
To detect multiple AU events in a given video, we apply Dynamic Programming (DP) [15] to the event score matrix. Recall that the original DP solution [15] could return a long segment that merged multiple events as a long event. However, using the transition score provides more accurate information about where the true boundaries are, and CoT avoids this under-segmentation problem.
4. Experiments
We evaluated CoT on three publicly available datasets, the extended Cohn-Kanade (CK+) [17], GEMEP-FERA (FERA) [31] and RU-FACS [2].
4.1. Experimental Settings
This section describes the feature extraction methods, the training/test setup and the methods used for comparison.
Datasets:
CK+ contains 593 posed facial expression sequences from 123 participants. Sequences vary in duration between 4 and 71 frames and the temporal structure of facial movements is predetermined. Each sequence begins with a neutral face and ends at peak intensity. Increases in AU intensity are monotonic. Pose is frontal with relatively little head motion.
In FERA, we used the image sequences from the FERA training set of 87 portrayals from 7 trained actors. Average duration is a little longer than 60 frames. AUs occur during emotional speech, and hence onset and offset of AU events are ambiguous, and AU may have multiple apexes. Increases in AU intensity are not necessarily monotonic. Pose is primarily frontal with moderate change in head movement.
RU-FACS is more challenging than the other two datasets, and it consists of facial behavior recorded during interviews. The interviews are about two minutes. Participants show moderate pose variation and speech-related mouth movements. Compared with the above two datasets, RU-FACS is more natural in timing, much longer, and the AUs are at lower intensity. For technical reasons, we selected from 29 of 34 participants with sequence length of about 7000 frames.
Face Registration:
For the CK+ and RU-FACS dataset person-specific Active Appearance Model [20] tracking of 66 facial landmarks was available. For FERA, we used the recently proposed supervised descent method [35]1 to track 49 landmarks. All tracked facial features points were registered to a reference face by a similarity transformation. Face images are then warped based on registered facial features.
Features:
At frame level we extracted the geometric features [38] and appearance features (SIFT descriptor) [39]. See Section 3 for segment-level features.
Training/Test spit:
We use a leave-one-subject-out strategy in the CK+ and FERA dataset. In RU-FACS, in order to compare with previously published results, we split the subject list into 19 subjects for training and 10 subjects for test. For more details on the training/testing spilt see [6].
Frame-based methods to compare:
We compared with three approaches that fuse shape [38] and appearance features [39]. For all methods we used the Radial Basis Function (RBF) kernel for shape features and concatenated features, and the Histogram Intersection Kernel (HIK) for SIFT features. The first method, Early Fusion (EF) [29], fuses features by concatenating feature vectors into a longer vector. Because different features have different range values, we normalized them to have zero mean and unitary variance. The second method, Late Fusion (LF) [28] combines outputs from classifiers trained on different features. Because the strength of features varies drastically across AUs, weighted averaging was used to obtain late fusion result, the weights were estimated by cross-validation. The third method for comparison was Multiple Kernel Learning (MKL) [25] that jointly estimates the SVM parameters and weights the contributions of different features.
Segment-based methods to compare:
For segment-based methods, we implemented the Joint Segmentation and Classification (JSC) [15]. Note that JSC can be seen as segment detection in CoT without the input of the frame-level detector. Comparing JSC and FS reveals the contribution of the frame-level detector to the segment-level detector. Temporal words were constructed for the shape and appearance features separately, and then two kinds of segment-level feature vectors were concatenated. We used a linear SVM for the JSC.
SVM:
For the linear and single kernel SVM we used the LIBSVM [3] and for MKL the SimpleMKL [23]. We did standard grid-search on the cross-validation parameters (including the C on the SVM).
4.2. Evaluation Metrics
We reported results using conventional metrics such as F1-Frame score. However, we argue that for many applications the F1-Frame score is less meaningful than an event-based metric.
F1-Frame:
F1-Frame is widely used (e.g., [31]) for its robustness to the imbalance of positive and negative samples, which is common in AU detection. It is defined as , where FR is the frame-level recall and FP is the frame-level precision.
F1-Frame ignores temporal information and fails to reflect event-based performance. As an illustration, a synthetic detection example on 100 frames is shown in Fig. 3. Two detections (det1 and det2) are shown along with ground truth. Note that det1 misses one event and generates multiple false positives, while det2 detects the correct number of events and roughly recovers their temporal locations. However, F1-Frame of det1 is 0.79 , which is higher than 0.75 of det2.
Figure 3.
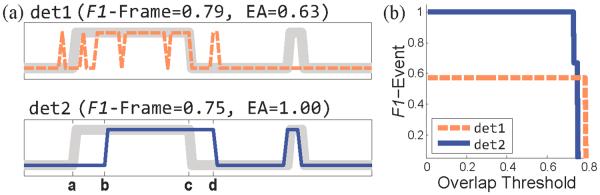
Two synthetic detections for the metrics F1-Frame, Event Agreement (EA) [22] and F1-Event. (a) shows ground truth (gray thick line) and two detections (thin lines). In F1-Frame, det1 scores higher although it has multiple false positives and misses a whole event. EA favors det2 as it is more desirable in detecting AU events. In (b), F1-Event curve reflects boundary misalignment in det2, which is ignored in Event Agreement.
Event Agreement:
To model the event-based performance, a metric called Event Agreement (EA) was proposed in [22]. EA measures the percentage of events that are correctly detected. For example, in the det2 (bottom figure of Fig. 3(a)), there is an overlap between the ground truth event [a, c] and the detected event [b, d], therefore EA considers that the event is correctly detected (even if the overlap is minimal). In this case, EA for det2 is . This is because, considering the thick line as ground truth two events are correctly detected (assuming a minimal overlap). Then, considering the thin line as ground truth two events are correctly detected. The EA is the ratio of events detected considering each of the signal as ground truth over the total number of events (in the two signals). For det1 (top figure in Fig. 3(a)), the EA is .
F1-Event Curve:
A major problem for EA to be used as a measure for AU detection, is that a single frame of overlap between the detected AU event and ground truth is considered as an event agreement. For example, in Fig. 3, although det2 gets full score in EA, it is not a perfect detection, especially in transition regions. To address this issue, we propose a novel event-based metric: , where Event-based Recall (ER) is the ratio of correctly detected events over the true events, while the Event-based Precision (EP ) is the ratio of correctly detected events over the the detected events. Unlike EA, F1-Event considers that there is an event agreement if the overlap is above a certain threshold, which can be set depending on specific applications. For the purpose of comparison the F1-Event curve is generated by varying the overlap threshold. For example, in Fig. 3 (b), F1-Event curves for det1 and det2 are shown. det2 for most thresholds has higher F1-Event score, except in the regions with extremely high threshold. This is because detected events of det1 are shorter and once they are agreed they tend to get high overlap ratio. It is interesting to note that when the overlap threshold is zero, F1-Event is very close to EA, as they are both “averaging” ER and EP.
4.3. Results
We reported results across all evaluation metrics (F1-Frame, EA, F1-Event). We also reported intermediate results, F (frame detection result) and FS (frame and segment detection without transition), in order to analyze the contribution of each task. To show the detection performance for all AUs, we reported the Average and Overall F1 scores. The Average F1 corresponds to the mean value of F1 scores for all AUs. The Overall F1 was calculated from an overall confusion matrix. The overall confusion matrix was computed by summing confusion matrices of all AUs. By doing so, we implicitly assigned larger weights to the AUs that appear more frequently. Because CK+ does not contain complete AU events, event-based metrics (i.e., EA and F1-Event) were only used in FERA and RU-FACS.
F1-Frame:
Results are shown in Table 1 (CK+), Table 2 (FERA) and Table 4 (RU-FACS). We also included the detection results on CK+ reported by Chew et al. [5] using Constrained Local Models (CLM). First, the final result of CoT (FST) outperforms all the other methods. In terms of overall F1-Frame, on CK+, the difference between FST and the second best method (MKL) is 4.3; on FERA, the difference between FST and the second best method (MKL) is 2.8; on CK+, the difference between FST and the second best method (JSC) is 6.1. Second, in our experiments the methods using multiple features did not necessarily perform better than the methods using single feature. This might be due to the redundancy of the features and possible normalization artifacts. For frame-based methods, MKL is the most stable and EF typically gets the lowest scores (even lower than F that only uses SIFT features).
Table 1.
F1-Frame on CK+ dataset
| AU | Frame | Seg | CoT | |||||
|---|---|---|---|---|---|---|---|---|
|
| ||||||||
| CLM2 | EF | MKL | LF | JSC | F | FS | FST | |
| 1 | 75 | 64.0 | 64.9 | 66.1 | 53.6 | 66.5 | 73.9 | 76.2 |
| 2 | 75 | 61.0 | 73.2 | 57.1 | 64.6 | 72.0 | 74.2 | 76.3 |
| 4 | 73 | 67.4 | 64.8 | 76.6 | 62.5 | 69.2 | 77.0 | 78.5 |
| 6 | 70 | 60.3 | 74.7 | 71.3 | 63.8 | 72.8 | 66.4 | 70.3 |
| 7 | 60 | 50.7 | 62.2 | 58.5 | 43.2 | 52.6 | 61.8 | 63.4 |
| 12 | 78 | 81.9 | 84.1 | 82.7 | 80.8 | 85.5 | 81.7 | 86.8 |
| 15 | 75 | 63.1 | 71.2 | 79.8 | 54.9 | 73.1 | 72.3 | 71.0 |
| 17 | 77 | 76.6 | 86.1 | 76.4 | 75.3 | 82.6 | 83.2 | 85.9 |
|
| ||||||||
| Average | 72.9 | 65.6 | 72.6 | 71.0 | 62.3 | 71.8 | 73.8 | 76.1 |
| Overall | – | 66.3 | 72.7 | 71.2 | 62.1 | 71.7 | 74.6 | 77.0 |
Table 2.
F1-Frame on FERA dataset
| AU | Frame | Seg | CoT | ||||
|---|---|---|---|---|---|---|---|
|
| |||||||
| EF | MKL | LF | JSC | F | FS | FST | |
| 1 | 57.6 | 61.1 | 54.9 | 50.9 | 55.9 | 62.5 | 64.2 |
| 2 | 49.4 | 54.4 | 52.6 | 49.0 | 49.8 | 56.0 | 57.2 |
| 4 | 43.6 | 45.4 | 47.2 | 44.3 | 36.8 | 46.7 | 46.6 |
| 6 | 62.3 | 67.0 | 72.8 | 70.1 | 66.0 | 72.1 | 72.9 |
| 7 | 61.3 | 65.1 | 67.0 | 66.0 | 61.5 | 65.5 | 67.4 |
| 12 | 71.5 | 75.4 | 77.9 | 76.8 | 70.8 | 77.0 | 78.3 |
| 15 | 38.9 | 44.3 | 37.5 | 33.3 | 38.0 | 44.6 | 46.7 |
| 17 | 30.1 | 36.7 | 34.9 | 30.7 | 33.4 | 38.7 | 38.6 |
|
| |||||||
| Average | 51.8 | 56.2 | 55.6 | 52.6 | 51.5 | 57.9 | 59.0 |
| Overall | 52.9 | 58.6 | 57.7 | 54.5 | 54.4 | 60.2 | 61.4 |
Table 4.
F1-Frame on RU-FACS dataset
| AU | Frame | Seg | CoT | ||||
|---|---|---|---|---|---|---|---|
|
| |||||||
| EF | MKL | LF | JSC | F | FS | FST | |
| 1 | 27.5 | 46.1 | 23.1 | 43.8 | 43.8 | 45.8 | 49.7 |
| 2 | 38.1 | 34.2 | 38.3 | 42.8 | 33.4 | 47.5 | 47.1 |
| 4 | 15.5 | 17.8 | 24.6 | 35.4 | 24.7 | 35.4 | 36.5 |
| 6 | 47.8 | 54.1 | 50.7 | 50.5 | 46.2 | 53.5 | 56.2 |
| 12 | 63.4 | 72.5 | 70.6 | 68.7 | 69.9 | 73.4 | 77.5 |
| 14 | 19.0 | 38.4 | 23.0 | 53.2 | 41.2 | 57.7 | 59.2 |
| 15 | 26.8 | 42.4 | 32.0 | 34.1 | 29.0 | 38.0 | 43.0 |
| 17 | 37.1 | 38.3 | 42.9 | 38.9 | 29.2 | 40.5 | 42.5 |
|
| |||||||
| Average | 34.4 | 43.0 | 38.1 | 45.9 | 39.7 | 49.0 | 51.5 |
| Overall | 37.4 | 49.1 | 40.7 | 52.3 | 43.9 | 56.0 | 58.4 |
Event Agreement:
Results are shown in Table 3 (FERA) and Table 5 (RU-FACS). First, the advantage of segment-based methods (JSC, FS, FST) over frame-based methods (EF, MKL, LF, F) is clear. On FERA and RUFACS, mean overall EA differences between segment-based and frame-based methods are 19.8 and 24.3, respectively. Second, FS consistently outperforms JSC. This shows how frame detection helps in segment detection stage. Third, because EA does not consider the overlap ratio, the performance improvement done by using the transition task is not well reflected with the metric. This explains why under EA the advantage of FST over FS is insignificant, and in some cases when transition detection is highly noisy, FS is even better.
Table 3.
Event Agreement on FERA dataset
| AU | Frame | Seg | CoT | ||||
|---|---|---|---|---|---|---|---|
|
| |||||||
| EF | MKL | LF | JSC | F | FS | FST | |
| 1 | 40.2 | 52.3 | 22.6 | 56.2 | 49.5 | 65.5 | 65.3 |
| 2 | 49.5 | 49.2 | 25.1 | 66.4 | 42.5 | 63.6 | 71.4 |
| 4 | 29.4 | 29.0 | 33.9 | 53.6 | 39.4 | 49.6 | 48.9 |
| 6 | 45.7 | 53.8 | 42.9 | 67.5 | 51.7 | 67.7 | 64.6 |
| 7 | 38.4 | 47.4 | 61.1 | 63.4 | 45.7 | 57.8 | 63.6 |
| 12 | 56.4 | 65.0 | 67.8 | 73.6 | 70.2 | 78.1 | 79.9 |
| 15 | 32.6 | 37.7 | 14.8 | 38.6 | 35.7 | 46.7 | 48.6 |
| 17 | 29.7 | 40.6 | 25.2 | 53.0 | 42.7 | 59.3 | 58.1 |
|
| |||||||
| Average | 40.2 | 46.9 | 36.7 | 59.0 | 47.2 | 61.0 | 62.5 |
| Overall | 39.2 | 46.3 | 32.5 | 58.8 | 47.2 | 61.4 | 62.9 |
Table 5.
Event Agreement on RU-FACS dataset
| AU | Frame | Seg | CoT | ||||
|---|---|---|---|---|---|---|---|
|
| |||||||
| EF | MKL | LF | JSC | F | FS | FST | |
| 1 | 21.7 | 56.7 | 31.3 | 36.6 | 25.1 | 38.7 | 47.5 |
| 2 | 23.6 | 37.1 | 35.7 | 45.7 | 23.3 | 53.1 | 52.7 |
| 4 | 6.6 | 15.0 | 13.3 | 36.4 | 8.0 | 28.5 | 33.7 |
| 6 | 19.0 | 41.7 | 53.7 | 68.8 | 27.5 | 71.1 | 71.2 |
| 12 | 49.5 | 65.8 | 71.4 | 71.4 | 48.7 | 75.9 | 70.5 |
| 14 | 15.2 | 20.3 | 14.3 | 62.6 | 35.3 | 65.6 | 68.6 |
| 15 | 12.6 | 28.4 | 24.1 | 39.1 | 22.6 | 53.3 | 59.7 |
| 17 | 20.3 | 26.7 | 33.2 | 35.5 | 17.5 | 40.4 | 44.1 |
|
| |||||||
| Average | 21.1 | 36.5 | 34.6 | 49.5 | 26.0 | 53.3 | 56.0 |
| Overall | 20.1 | 38.4 | 32.2 | 49.8 | 25.0 | 53.1 | 56.7 |
F1-Event Curve:
Results are shown in Fig. 4(a) (FERA) and Fig. 4(b) (RU-FACS). First, the top three lines on both datasets are segment-based methods (solid lines), which best shows segment-based method’s advantage in detecting AU events. Second, because most AU events in RU-FACS are complete, opposed to lots of incomplete events in FERA, RU-FACS contains more AU transitions. Hence transition detection (only in FST) plays a more important role, which is revealed by the gap between the top two curves. In some cases in FERA, false transition detection even results in worse FST results than FS.
Figure 4.

Overall F1-Event on (a) FERA and (b) RU-FACS dataset. Overlap threshold varies from 0.01 to 1. Solid and dotted lines denote segment- and frame-based methods, respectively.
Across the three metrics, CoT (FST) consistently performed the best among all AU detection methods for comparison. An increasingly performance improvement within CoT was observed while new task(s) being integrated. This improvement is more obvious on RU-FACS where more complete AU events were present.
5. Conclusion
This paper proposes a novel approach to detect facial AU events from image sequences. In a sequential manner, we use a cascade to combine three complementary detection tasks, as opposed to merely combining different features or classifiers aimed at single task. Our approach combines information from different time scales and detects complete AU events. With simple algorithms in each task, our method outperforms state-of-the-art methods in three public datasets with diverse facial expression dynamics. The advantage is consistent in both frame-based and event-based evaluation metrics. The idea of using a cascade to combine tasks for detection is general, and one future work is to extend this to other temporal detection problems such as human activity detection in videos. In addition, another future work is to extend CoT with an efficient search over segments using techniques such as branch-and-bound [7] that are more efficient than dynamic programming.
Acknowledgments
Research reported in this publication was supported in part by the National Institute of Mental Health of the National Institutes of Health under Award Number MH096951 and the National Science Foundation under the grant RI-1116583. The content is solely the responsibility of the authors and does not necessarily represent the official views of the National Institutes of Health or the National Science Foundation. X. Ding and Q. Wang are supported by Life and Health Science Foundation of Jiangsu of China, under Grant No. BL2012025.
Footnotes
For each AU, Chew et al. [5] reported multiple results from different features. We selected the best ones and compute the average F1.
References
- Ambadar Z, Cohn JF, Reed LI. All smiles are not created equal: Morphology and timing of smiles perceived as amused, polite, and embarrassed/nervous. Journal of nonverbal behavior. 2009;33(1):17–34. doi: 10.1007/s10919-008-0059-5. [DOI] [PMC free article] [PubMed] [Google Scholar]
- Bartlett MS, Littlewort GC, Frank MG, Lainscsek C, Fasel IR, Movellan JR. Automatic recognition of facial actions in spontaneous expressions. Journal of Multimedia. 2006;1(6):22–35. [Google Scholar]
- Chang C-C, Lin C-J. LIBSVM: A library for support vector machines. ACM Transactions on Intelligent Systems and Technology. 2011;2(3):27:1–27:27. [Google Scholar]
- Chang KY, Liu TL, Lai SH. Learning partially-observed hidden conditional random fields for facial expression recognition. CVPR. 2009 [Google Scholar]
- Chew S, Lucey P, Lucey S, Saragih J, Cohn JF, Sridharan S. Person-independent facial expression detection using constrained local models. AFGR. 2011 Others. [Google Scholar]
- Chu W-S, De la Torre F, Cohn JF. Selective transfer machine for personalized facial action unit detection. CVPR. 2013 doi: 10.1109/CVPR.2013.451. [DOI] [PMC free article] [PubMed] [Google Scholar]
- Chu W-S, Zhou F, De la Torre F. Unsupervised temporal commonality discovery. ECCV. 2012 [Google Scholar]
- Cohn JF, Ambadar Z, Ekman P. Observer-based measurement of facial expression with the Facial Action Coding System. Oxford University Press Series in Affective Science; New York, NY: Oxford University: 2007. [Google Scholar]
- Cohn JF, De la Torre F. Handbook of affective computing. Oxford; New York, NY: Automated face analysis for affective computing. (In press) [Google Scholar]
- De la Torre F, Cohn JF. Facial expression analysis. Visual Analysis of Humans: Looking at People. 2011:377. [Google Scholar]
- De la Torre F, Simon T, Ambadar Z, Cohn JF. FAST-FACS: A computer-assisted system to increase speed and reliability of manual FACS coding. Affective Computing and Intelligent Interaction (ACII) 2011 [Google Scholar]
- Ekman P, Friesen WV, Hager JC. Facial action coding system: Research Nexus. Network Research Information; Salt Lake City, UT: 2002. [Google Scholar]
- Ekman P, Rosenberg E. What the face reveals. 2nd Oxford; New York, NY: 2005. [Google Scholar]
- Fairbairn CE, Sayette MA, Levine JM, Cohn JF, Creswell KG. The effects of alcohol on the emotional displays of Whites in interracial groups. Emotion. 2013;13(3):468–477. doi: 10.1037/a0030934. [DOI] [PMC free article] [PubMed] [Google Scholar]
- Hoai M, Lan Z-Z, De la Torre F. Joint segmentation and classification of human actions in video. CVPR. 2011 [Google Scholar]
- Jiang B, Valstar MF, Pantic M. Action unit detection using sparse appearance descriptors in space-time video volumes. AFGR. 2011 [Google Scholar]
- Lucey P, Cohn JF, Kanade T, Saragih J, Ambadar Z, Matthews I. The Extended Cohn-Kanade Dataset (CK+): A complete dataset for action unit and emotion-specified expression. CVPR Workshops. 2010 [Google Scholar]
- Lucey S, Ashraf AB, Cohn JF. Investigating spontaneous facial action recognition through AAM representations of the face. Face Recognition. 2007:275–286. [Google Scholar]
- Martinez A, Du S. A model of the perception of facial expressions of emotion by humans: research overview and perspectives. Journal of Machine Learning Research. 2012;13:1589–1608. [PMC free article] [PubMed] [Google Scholar]
- Matthews I, Baker S. Active appearance models revisited. IJCV. 2004;60(2):135–164. [Google Scholar]
- Pantic M, Bartlett MS. Machine analysis of facial expressions. Face Recognition. 2007;2(8):377–416. [Google Scholar]
- Park S, Mohammadi G, Artstein R, Morency L-P. Crowdsourcing micro-Level multimedia nnnotations : The challenges of evaluation and interface. Proceedings of the ACM multimedia workshops. 2012 [Google Scholar]
- Rakotomamonjy A, Bach F, Canu S, Grandvalet Y. SimpleMKL. Journal of Machine Learning Research. 2008;9:2491–2521. Others. [Google Scholar]
- Rudovic O, Pavlovic V, Pantic M. Kernel Conditional Ordinal Random Fields for Temporal Segmentation of Facial Action Units. ECCV Workshops. 2012 [Google Scholar]
- Senechal T, Rapp V, Salam H, Seguier R, Bailly K, Prevost L. Facial action recognition combining heterogeneous features via multikernel learning. Systems, Man, and Cybernetics, Part B: Cybernetics, IEEE Transactions on. 2012 May;42(4):993–1005. doi: 10.1109/TSMCB.2012.2193567. [DOI] [PubMed] [Google Scholar]
- Shang L. Nonparametric discriminant HMM and application to facial expression recognition. CVPR. 2009 [Google Scholar]
- Simon T, Nguyen MH, De la Torre F, Cohn JF. Action unit detection with segment-based SVMs. CVPR. 2010 [Google Scholar]
- Tariq U, Huang T. Features and fusion for expression recognitionA comparative analysis. CVPR. 2012 [Google Scholar]
- Tariq U, Lin K-H, Li Z, Zhou X, Wang Z, Le V, Huang TS, Lv X, Han TX. Emotion recognition from an ensemble of features. AFGR. 2011 Mar; [Google Scholar]
- Tong Y, Chen J, Ji Q. A unified probabilistic frame-work for spontaneous facial action modeling and understanding. PAMI. 2010;32(2):258–273. doi: 10.1109/TPAMI.2008.293. [DOI] [PubMed] [Google Scholar]
- Valstar MF, Mehu M, Jiang B, Pantic M, Scherer K. Meta-Analysis of the first facial expression recognition challenge. IEEE Transactions on Systems, Man, and Cybernetics, Part B. 2012;42(4):966–979. doi: 10.1109/TSMCB.2012.2200675. [DOI] [PubMed] [Google Scholar]
- Valstar MF, Pantic M. Fully automatic recognition of the temporal phases of facial actions. IEEE Transactions on Systems, Man, and Cybernetics, Part B: Cybernetics. 2012;42(1):28–13. doi: 10.1109/TSMCB.2011.2163710. [DOI] [PubMed] [Google Scholar]
- Wu T, Butko NJ, Ruvolo P, Whitehill J, Bartlett MS, Movellan JR. Multilayer architectures for facial action unit recognition. Systems, Man, and Cybernetics, Part B: Cybernetics, IEEE Transactions on. 2012;42(4):1027–1038. doi: 10.1109/TSMCB.2012.2195170. [DOI] [PubMed] [Google Scholar]
- Wu X, Srihari R. SIGKDD. ACM Press; 2004. Incorporating prior knowledge with weighted margin support vector machines. [Google Scholar]
- Xiong X, De la Torre F. Supervised descent method and its applications to face alignment. CVPR. 2013 [Google Scholar]
- Zhao G, Pietikäinen M. Boosted multi-resolution spatiotemporal descriptors for facial expression recognition. Pattern Recognition Letters. 2009 Sep;30(12):1117–1127. [Google Scholar]
- Zhong L, Liu Q, Yang P, Liu B, Huang J, Metaxas DN. Learning active facial patches for expression analysis. CVPR. 2012 [Google Scholar]
- Zhou F, De la Torre F, Cohn JF. Unsupervised discovery of facial events. CVPR. 2010 Jun; [Google Scholar]
- Zhu Y, De la Torre F, Cohn JF, Zhan Y-J. Dynamic cascades with bidirectional bootstrapping for action unit detection in spontaneous facial behavior. IEEE Transactions on Affective Computing. 2011:1–14. doi: 10.1109/T-AFFC.2011.10. [DOI] [PMC free article] [PubMed] [Google Scholar]