

Abstract
Genome wide complex trait analysis (GCTA) is extended to include environmental effects of the maternal genotype on offspring phenotype (“maternal effects”, M-GCTA). The model includes parameters for the direct effects of the offspring genotype, maternal effects and the covariance between direct and maternal effects. Analysis of simulated data, conducted in OpenMx, confirmed that model parameters could be recovered by full information maximum likelihood (FIML) and evaluated the biases that arise in conventional GCTA when indirect genetic effects are ignored. Estimates derived from FIML in OpenMx showed very close agreement to those obtained by restricted maximum likelihood using the published algorithm for GCTA. The method was also applied to illustrative perinatal phenotypes from ∼4,000 mother-offspring pairs from the Avon Longitudinal Study of Parents and Children. The relative merits of extended GCTA in contrast to quantitative genetic approaches based on analyzing the phenotypic covariance structure of kinships are considered.
Keywords: Maternal effects, Genome wide complex trait analysis, GCTA, Twins, Heritability, Bias, Genetic relatedness, Covariance, Environment, SNPs
Background
The recent history of human quantitative genetics has witnessed a remarkable convergence between views of complex trait genetics emerging from approaches that rely on comparing phenotypic resemblance between relatives sharing different degrees of genetic relatedness (see e.g. Fisher 1918; Mather and Jinks 1982; Falconer and McKay 1996) and those made possible by direct characterization of genetic variation at the genomic level, notably genome wide association analysis (GWAS) and genome wide complex trait analysis (GCTA, Yang et al. 2010, 2011a, 2011b). Although there are qualifications and nuances that reflect the relative strength and weaknesses of these two paradigms, their common heuristic recognizes that the heritable contribution to individual differences in quantitative traits reflects the cumulative action of variation at large numbers of genetic variants of small individual effect, widely dispersed across the genome. Such astonishing convergence of quite different approaches may provide historians and philosophers of science with a model system to illustrate theories of scientific progress and controversy in biology.
Genome wide complex trait analysis has played a central role in facilitating the convergence of classical biometrical genetics and recent genomic approaches to polygenic inheritance. GCTA uses genome-wide genetic identity by state between SNPs in apparently unrelated pairs of individuals to estimate the degree of genetic relatedness between pairs. In large samples of such pairs, small variations in the degree of relatedness around the expected value provide the information to estimate the contribution of genetic factors (currently “additive genetic effects”) to the outcome phenotype.
In the past, the application of genetics to human behavior has stimulated the development of quantitative methods to address the consequences of the prolonged developmental interplay between the human genome and ecosystem resulting from family structure and social behavior, language and learning. Such extensions of the human phenotype (c.f. Dawkins 1989) create a variety of effects of genes on behavior that have not been captured by the classical focus of human quantitative genetics on estimating the direct additive contribution of polygenic effects on the behavioral phenotype (e.g. Cavalli-Sforza and Feldman 1973; Eaves 1976; Cloninger et al. 1979; Truett et al. 1994).
The recent application of GCTA to human behavioral traits (e.g. Trzaskowski et al. 2013) challenges behavior-geneticists once more to examine how the basic approach of GCTA may be extended to test for, and estimate, the contributions of such indirect effects of the human genotype.
This paper represents one attempt to extend the dialogue between the classical quantitative genetic approach to the subtleties of genetic effects based on analysis of the correlations between relatives and the relatively novel approach of GCTA. In particular, we consider how GCTA might be extended to include the environmental effects of the maternal genotype as well as those of offspring on offspring development (M-GCTA). “Maternal effects arise when the mother makes a contribution to the phenotype of her progeny over and above that which results from the genes she contributes to the zygote” (Mather and Jinks 1982, p. 301) and are likely to be especially important for traits measured early in development. Maternal effects may be mediated through a number of mechanisms including the effect of the maternal genotype on the cytoplasm she contributes to her children, the quality of nutrition she provides before and after birth or the quality of the learning environment she provides for her children. Our model focuses on the effects of the maternal nuclear genotype and does not consider mitochondrial inheritance.
Maternal effects have long been recognized as a component of quantitative genetic systems in experimental and commercial plant and animal species (e.g. Mather and Jinks 1982; Meyer 1989; Falconer and McKay 1996) and most of the models applied in humans are merely extensions of these to specific human family structures such as those derived from kinships involving twins and their relatives. In classical twin studies such effects contribute to estimates of the “shared environment” and, inter alia, inflate the correlations of maternal half-siblings relative to those of paternal half siblings. There is an extensive theoretical and empirical literature on modeling maternal effects in human kinships and resolving them from the direct effects of the offspring genotype. Such models have been especially important in resolving the contributions of maternal and fetal genotype to pre- and peri-natal outcomes (Corey and Nance 1978; York et al. 2009, 2010, 2013). Our extension of GCTA to include the effects of the maternal genotypes builds on much of this classical work.
We outline and illustrate the approach to dyadic outcomes measured in studies where genome-wide SNP data have been collected from large samples of unrelated mother-offspring pairs. In theory, the same approach may be developed further to the multivariate case, and to incorporate the indirect effects of other relatives such as fathers and siblings. We show how such maternal effects might be resolved from the direct effects of the offspring's own genotype. Typically, correct estimation of genetic and environmental components of family resemblance depends on correct specification of the underlying model. Misspecification, for example by omission of salient model parameters, often results in biased estimates of remaining effects. We examine the extent to which estimates of genetic variance obtained in conventional GCTA are biased if indirect genetic effects, such as those of the maternal genotype, are ignored. We also indicate some potential limitations of the approach and indicate some areas for further inquiry.
There is an extensive theoretical and empirical literature on modeling maternal effects in human kinships and resolving them from the direct effects of the offspring genotype. Such models have been especially important in resolving the contributions of maternal and fetal genotype to pre- and peri-natal outcomes (Corey and Nance 1978; York et al. 2009, 2010, 2013). Our extension of GCTA to include the effects of the maternal genotypes builds on much of this classical work.
Basic components of variance model for maternal effects
The simple linear model, ignoring non-additive genetic contributions, sex differences in gene expression, non-random mating, GxE interaction, other indirect genetic effects such as those of fathers and sibings, and correlated errors, partitions the phenotypic variance among individuals, V, as follows:
| (1) |
where G is the additive genetic variance due to the direct effects of genetic differences on the phenotype, M is the “environmental” variance due to the indirect effects of the maternal genotype on offspring phenotype (“maternal effects”) and E is the variance due to (random, residual, individual-unique environmental effects). Parameter Q will be zero if there is no net genetic correlation between the direct and indirect effects, for example if different loci contribute to maternal and fetal genetic influences. Q may differ significantly from zero (positive or negative) if the direct effects of genes on the individual phenotype are correlated with indirect effects of the maternal genotype (“genotype-environment covariance”, see path model below). Haley et al. (1981) distinguish “one character” from “two character” models for maternal effects. The “two character” model implies that different SNPs contribute to G and M so that there is no correlation between the direct and indirect maternal effects (Q = 0). The “one character” model implies that the same genes contribute to direct and indirect effects so that Q ≠ 0. More generally, some genes may have both direct and indirect effects and some genes may contribute only to direct or maternal effects and thus combine elements of the one- and two-character models of Haley et al.
Within the classical quantitative-genetic paradigm, estimation of G, M and Q depends on measuring constellations of collateral and inter-generational relationships whose covariances reflect different contributions of direct and indirect effects. For outcomes that depend markedly on age, such as pre- and peri-natal outcomes or assessments of early development, studies have focused on the phenotypes of collateral relatives such as offspring related through mothers of different degrees of genetic relationship, e.g., maternal and paternal half siblings and offspring of male and female twins and siblings (Corey and Nance 1978; York et al. 2009, 2010, 2013). Although such approaches can estimate direct (G) and maternal effects (M + Q), instances where intergenerational phenotypic data are not available preclude the resolution of maternal effects (M) from those of genotype-environmental covariance (Q). Extension of the kinship study to include intergenerational data (such as parent-offspring and avuncular data) can, in theory, resolve a variety of direct and indirect effects (see e.g. Truett et al. 1994) but such designs are prone to bias from the interaction of genetic effects with intergenerational age and environmental differences.
Basic components of variance model in GCTA
The basic GCTA formulation assumes M = Q = 0 and reduces (1) to:
| (2) |
where G is the additive genetic variance, and E the residual (unique environmental) variance. The covariance, Wij between individuals i and j is expected to be βijG where βij is the genetic correlation between individuals i and j. In the usual quantitative genetic approach the genetic correlation is obtained theoretically from the expected degree of genetic relatedness between pairs of relatives that share a known degree of common ancestry based on pedigree structure. In GCTA the genetic relatedness is estimated empirically from identity by state inferred from the pattern of similarity in genome-wide SNP patterns between biologically unrelated individuals. The regression of intra-pair phenotypic variances, Δij, on values of βij over large numbers of unrelated pairs from population-based samples is expected to be a function of the (narrow) heritability of individual differences in the phenotype that is captured from SNPs using currently available genotyping platforms Full details of the basic GCTA model, estimation of the βij, from genome-wide SNP data are given in, e.g., Yang et al. (2011a) who provide an efficient algorithm for REML estimation of the variance components and a number of ancillary analyses, including partitioning the genetic variance, G, into the additive contributions of separate chromosomes, including the X chromosome thus:
| (3) |
where Σ is the expected phenotypic covariance matrix among the N unrelated individuals in the sample, Bi is the N × N matrix of the empirical estimates of the genetic relatedness based on SNPs on the ith chromosome and Gi is the additive component of genetic variance contributed by loci on the ith chromosome (Yang et al. 2011b). Yang et al.'s algorithm provides a platform for the rapid estimation of the Bi from the SNP data on each chromosome and REML estimation of the genetic and environmental components of variance, Gi and E.
Extending GCTA to include indirect effects of the maternal genotype (“M-GCTA”)
The basic elements of the model follow those of the classical “biometrical genetic” model for the effects of maternal and offspring genotypes on quantitative phenotypes (see introduction above). Such models have been implemented in extended animal pedigrees and, most recently, have been applied by York et al. (2010, 2013) to gestational age in large samples of Swedish and American births from female twin, sibling and half-sibling mothers and the spouse of male twins, sibling and half-siblings.
The basic M-GCTA model (Fig. 1) assumes additive gene action (i.e. no dominance, epistasis, or mother-fetal genetic incompatibility), random mating, and autosomal inheritance with no sex-differences in gene effect.
Fig. 1.
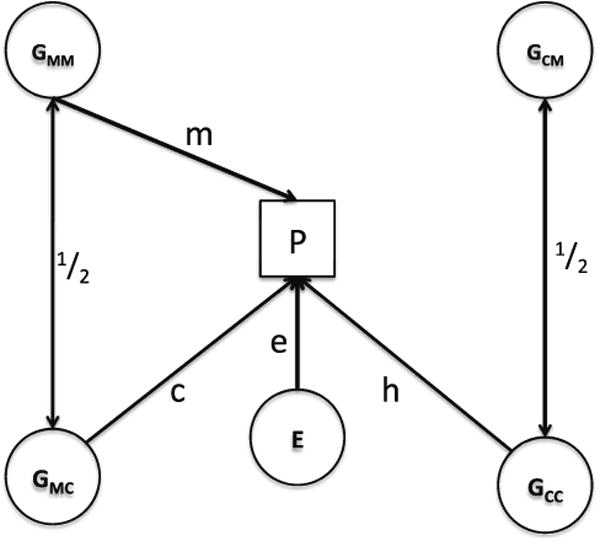
Basic path model for fetal and maternal effects in mother– child dyads. P measured phenotype (dyadic, influenced by both offspring and maternal genotypes, E random environment (residual), GMM maternal genotype for loci that have an environmental (“maternal”) effect on P, GCM maternal genotype for loci that have no environmental effect on P but have a direct effect when present in offspring (“offspring-specific” effects), GMC offspring genotype for loci that contribute to the maternal effect, GCC offspring genotype that affect P directly but do not contribute to the maternal effect (“offspring-specific” genes)
Following the convention of path analysis, the measured phenotype (P) is shown as a square and the hypothetical latent causal variables denoted by circles. Latent variables are the random residual effects of the environment (E) operating through causal path (one-headed arrow) “e” and two sources of genetic variation —“fetal” genetic effects that contribute directly to the phenotype of the offspring (GCC) through the causal path “h” and “maternal” genetic effects that, when expressed in the mother have an indirect “environmental” effect on the offspring phenotype through path “m”. The figure shows that the two sets of genes are present in both mothers and offspring (GMM and GMC) for genes having “indirect” maternal effects and (GCM and GCC) for genes having “direct” fetal effects. We note that although the genes contributing maternal and fetal effects are independent within individuals they are correlated (on average 0.5) between mothers and their children (denoted by the double-headed arrow in Fig. 1). An additional feature of the M-GCTA model that has implications for its implementation in GCTA is the fact that the genes contributing to the indirect maternal effect when present in the mother (GMM) may also exercise a direct effect when present in the fetus (GMC) through the causal path “c” in the Figure. The possibility that the “maternal” genes may also have a direct effect in the offspring vitiates any attempt to implement the estimation of maternal and fetal genetic effects by two stages in GCTA and requires the classical biometrical genetic model using information on the genetic relationship between pairs of mothers and pairs of children simultaneously to estimate the paths h,m,c and e (or their corresponding variance components h2, c2, m2 and e2). Haley and Jinks “one character” model for maternal effects implies that h = 0, i.e. that there are no genes affecting offspring directly that do not also have an indirect maternal effect. Their “two-character” model implies that c = 0, i.e. that quite different sets of genes contribute to direct and indirect effects on the offspring phenotype.
Figure 2 shows how this basic model (Fig. 1) extends to the general case of two mother–child pairs (i and j) from a study of “unrelated” families characterized by genome-wide SNP data on mothers and singleton children. It is critical to recognize that the correlations (α, β etc.) between the latent genetic variables are assumed to be estimated without bias or error from identity by state of relatives for the genome-wide SNP data. This may not be the case, and estimates of maternal and offspring genetic variance components will be biased if the genetic correlations for the effects of variants affecting the phenotype are not those estimated from the SNPs because, for example, they are not in perfect linkage disequilibrium (see e.g, discussion by Yang et al. (2011b) in the context of classical GCTA).
Fig. 2. Model in Fig. 1 extended to include “unrelated” pairs of mothers and children.
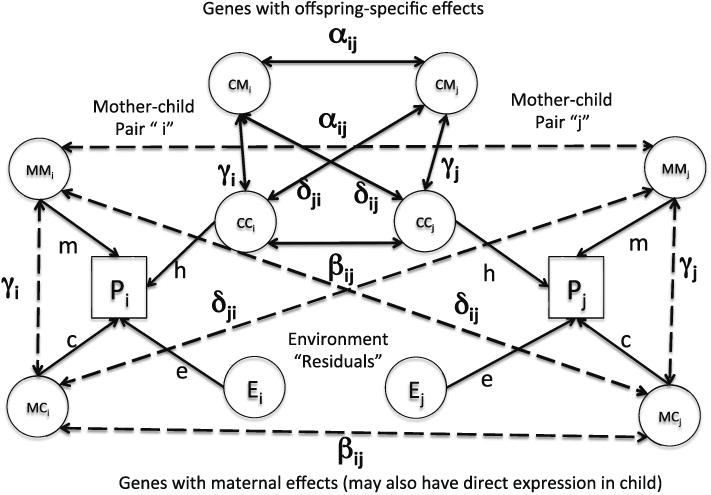
We define: αij = αji = ε(A) = the coefficient of relat-edness (estimated from the SNPs) between the mothers of the ith and jth mother–child pairs; βij = βji =ε (B) = the coefficient of relatedness between the children of the ith and jth mother–child pairs; δij = ε(D) = the coefficient of relatedness between the ith mother and the jth child (δii = γi in Fig. 2).
From these matrices we can construct G, the matrix of genetic relationships between the maternal and genetic components of mothers and offspring. The structure of this partitioned matrix is summarized in Table 1. Note that, for clarity, the table partitions the SNPs of mothers and children explicitly into those that contribute to direct and indirect effects (since children also carry but might not express the genes that contribute to indirect effects and vice versa). However, the component genetic relatedness matrices, A, B and D may be estimated empirically from the genome-wide SNP data in actual mother–child pairs using the approach of Yang et al. (2011a) on the assumption that the genes having direct and indirect effects are not clustered differently across the genome.
Table 1. Components of genetic relatedness matrix for mothers and offspring (see text and Fig. 2 for definition of component matrices).
| Relationship | Genetic component | Mothers | Offspring | ||
|---|---|---|---|---|---|
|
|
|
||||
| MM | CM | MC | CC | ||
| Mothers | MM | A | 0 | D | 0 |
| CM | 0 | A | 0 | D | |
| Offspring | MC | D′ | 0 | B | 0 |
| CC | 0 | D′ | 0 | B | |
Key to genetic components (c.f. Fig. 2): MM maternal copies of genes having indirect maternal effects (m) when present in the mother, CM maternal copies of genes having direct effects (h) when present in offspring, MC offspring copies of genes having indirect maternal effects (m) when present in the mother (may also have a direct effect, c > 0, on offspring when present in offspring), CC offspring copies of genes having direct effects (h) when present in offspring. Component matrices are N × N where N number of mother–child pairs in the sample
Expected variances within, and covariances between, dyadic phenotypes of “unrelated” mother-offspring pairs
The phenotypic value of the offspring in the ith family is:
| (3) |
(MMi) is the ith mother's deviation for her indirect maternal genetic effect on her child. (CCi) is the ith child's deviation for his/her direct offspring genetic effect on the phenotype. (MCi) is the deviation of the ith child for the influence of genes that contribute to both indirect genetic influences when present in the mother and direct genetic effects when expressed in the child (c.f. Fig. 2).
For simplicity we assume that the variances of the latent genetic components are all unity (true on average in the absence of inbreeding). This assumption can be relaxed without affecting the main thrust of the argument.
The covariance between offspring in the ith and jth families is expected to be (c.f. Wright 1921):
| (4) |
which becomes 1 = m2 + (c2 + h2) + mc when i = j since aii ∼ 1, βii ∼ 1 and δii ∼ ½. Writing M = m2, G = (c2 + h2) and Q = mc, (4) may be written in matrix form to yield the linear structural model for the expected phenotypic covariance matrix between N subjects:
| (5) |
The analogy between (5) and the linear structural model for the additive genetic contribution of multiple chromosomes in GCTA (Eq. 2, above, Yang et al., 2011b) is clear and suggests that the current GCTA algorithm may be adapted to the current application to estimate indirect genetic effects. Matrices A and B are defined above and Δ = D + D′. A, B and D can be extracted from the joint mother–offspring genetic relatedness matrix computed from the genome-wide SNPs of mothers and children simultaneously using GCTA software.
Application to simulated data
The model parameterized in Fig. 2 and Eq. (5) was implemented in a series of simulations designed to prove the principle of extending GCTA to include indirect genetic effects and to examine the consequences of ignoring indirect genetic effects in classical GCTA. To minimize complications, we simulated relatively small samples of subjects (N = 1000 pairs of mothers and offspring) with a total of 200 SNPs that explained all of the direct and indirect genetic effects (G and M) and their covariance (Q). The 200 genes were apportioned variously into those having only direct effects, only maternal effects or both direct and indirect effects. The model assumed that all genetic effects were additive (i.e. heterozygotes at the SNPs were intermediate between their corresponding homozygotes) and no interaction between maternal and offspring genotypes. To maximize the transparency of the conceptual and methodological conclusions, we assumed that increasing allele frequencies were all high, uniformly distributed between 0.4 and 0.6, and all increasing allele effects were large, U[0.45,0.55], for all variants that contributed to direct and/or indirect effects. For example, in the simulation of model 4 (see Table 2 below) SNPs 1–125 were assumed to have direct effects on the phenotype when present in the offspring and SNPs 76–200 were assumed to contribute to maternal effects. Thus, 75 SNPs (1–75) had offspring-specific effects, 75 (126–200) contributed only to maternal effects, and 50 SNPs (76–125) contributed both to maternal and offspring effects.
Table 2. Results of fitting “GCTA” model for direct and maternal effects to simulated offspring phenotypes in random samples of genotyped mother–child pairs (N = 1000).
| Model | μ | G | M | Q | E | −2lnl | χ2 | d.f. | P% | |
|---|---|---|---|---|---|---|---|---|---|---|
| 1 | Simulated | 100.29 | 25.12 | 0 | 0 | 3.86 | – | – | – | – |
| Full | 100.19 | 24.23 | −0.19 | 0.63 | 4.20 | 4904.71 | – | – | – | |
| Q = 0 | 100.19 | 24.93 | −0.14 | 0 | 4.16 | 4907.34 | 2.63 | 1 | ||
| M =Q=0 | 100.19 | 24.91 | 0 | 0 | 4.05 | 4908.31 | 3.60 | 2 | 17 | |
| G =Q=0 | 100.25 | 0. | 7.23 | 0 | 22.94 | 6152.00 | 1247.29 | 2 | <10−6 | |
| M =G=Q= 0 | 100.29 | 0. | 0 | 0 | 30.25 | 6247.31 | 1342.60 | 3 | <10−6 | |
| 2 | Simulated | 99.88 | 12.34 | 12.37 | -0.14 | 3.86 | – | – | – | – |
| Full | 99.79 | 11.74 | 12.28 | 1.05 | 4.02 | 5212.25 | – | – | – | |
| Q = 0 | 99.79 | 11.87 | 12.40 | 0 | 4.00 | 5213.44 | 1.19 | 1 | 55 | |
| M =Q=0 | 99.78 | 15.58 | 0 | 0 | 13.32 | 5797.36 | 575.11 | 2 | <10−6 | |
| G =Q=0 | 99.85 | 0 | 16.43 | 0 | 12.61 | 5759.37 | 547.12 | 2 | <10−6 | |
| M =G=Q= 0 | 99.88 | 0 | 0 | 0 | 29.07 | 6207.51 | 995.26 | 3 | <10−6 | |
| 3 | Simulated | 100.50 | 0 | 25.74 | 0 | 3.86 | – | – | – | – |
| Full | 100.41 | −0.20 | 24.66 | 0.57 | 4.14 | 4891.65 | – | – | – | |
| Q = 0 | 100.41 | −0.17 | 25.27 | 0 | 4.12 | 4893.93 | 2.28 | 1 | 13 | |
| M =Q=0 | 100.49 | 7.81 | 0 | 0 | 23.03 | 6164.98 | 1273.33 | 2 | <10−6 | |
| G =Q=0 | 100.42 | 0 | 25.21 | 0 | 3.99 | 4895.57 | 3.92 | 2 | 14 | |
| M =G=Q= 0 | 100.50 | 0 | 0 | 0 | 30.67 | 6261.20 | 1369.55 | 3 | <10−6 | |
| 4 | Simulated | 125.77 | 15.71 | 15.78 | 5.89 | 3.86 | – | – | – | – |
| Full | 125.55 | 15.41 | 15.89 | 6.50 | 4.02 | 5284.08 | – | – | – | |
| Q = 0 | 125.56 | 16.04 | 16.43 | 0 | 3.98 | 5314.57 | 30.49 | 1 | <10−6 | |
| M =Q=0 | 125.62 | 25.87 | 0 | 0 | 16.38 | 6054.66 | 770.58 | 2 | <10−6 | |
| G =Q=0 | 125.63 | 0 | 25.94 | 0 | 15.44 | 6005.47 | 729.39 | 2 | <10−6 | |
| M =G=Q= 0 | 125.77 | 0 | 0 | 0 | 42.45 | 6586.25 | 1302.17 | 3 | <10−6 |
Model parameters are: G variance due to direct genetic (“offspring/fetal”) effects, M variance due to indirect genetic effects on offspring phenotype (“maternal effects”), Q phenotypic variance due to covariance of direct and indirect genetic effects, E residual (“unique environmental effects”), μ mean. See text. Significance levels of Chi square assume all variance component estimates are unbounded (“two-tail test”) and are, thus, conservative in the case of M and G. Q may be positive or negative subject to the −1 < r 1 constraint on the genetic correlation, r, between direct and indirect effects
The simulations and analyses of simulated data were conducted in R on a 2.3 GHz Intel Core i7 processor with 8 GB 1,333 MHz DDR3 memory. Genetic relatedness matrices, A, B and Δ = (D + D′) were computed from the pair-wise SNP patterns at the 200 independent simulated SNPs in mothers and offspring using the formulae provided by Yang et al. (2011a). Full information maximum-likelihood estimation of the population mean (l) and components of variance, G, M, E and the genotype-environment covariance, Q, was conducted for the 1,000 simulated subjects in OpenMx (Boker et al. 2011, 2012). Code for the simulations and OpenMx estimation can be obtained from the corresponding author. Typically, ML estimation in OpenMx required about 2 min for each model with these data dimensions. Although the implementation of FIML in OpenMx can handle larger samples (e.g. 5,000 mother– child pairs) on more powerful systems, the CPU time required is currently prohibitive (Neale, 2013, personal communication). For the illustrative examples with real data we implemented the model in Yang et al's (2011a) software for classical GCTA by adapting their linear model for our application to resolve G, M, Q and E
Application to real data
We were also interested in how M-GCTA might perform on “real” data derived from a genome-wide association study of mothers and children. The Avon Longitudinal Study of Parents and Children (ALSPAC) is a population-based birth cohort study consisting of 14,541 women and their children recruited in the county of Avon, UK, in the early 1990s (Boyd et al. 2013; Fraser et al. 2013). Both mothers and children have been extensively followed from the eighth gestational week onwards using a combination of self-reported questionnaires, medical records and physical examinations. Biological samples including DNA have been collected from the participants. Ethical approval was obtained from the ALSPAC Law and Ethics Committee and relevant local ethics committees, and written informed consent provided by all parents. The study website contains details of all the data that is available through a fully searchable data dictionary (http://www.bris.ac.uk/alspac/researchers/data-access/data-dictionary).
We applied our method to two phenotypes from AL-SPAC, maternal self reported stature, and birth length (crown-heel length) of the new-born infant. Stature is a paradigm of polygenic inheritance in both classical (e.g. Fisher, 1918) and GCTA approaches (see e.g. Yang et al., 2010) to the genetic analysis of continuous human variation. Mothers' height should be independent of child's genotype given her own genotype so analysis of maternal stature provides a “positive control” for the method (i.e. we should find a large maternal genetic variance component and no offspring genetic variance-similar to Model 3 in the simulations). Conversely, crown-heel length is a perinatal outcome that might be expected to be influenced by both child's genotype and mother's genotype via environmental effects in utero. Maternal self-reported height was determined by postal questionnaire at 12 week gestation. Birth length was measured by ALSPAC staff using a Harpenden neonatometer (Holtain Ltd., Crymych, United Kingdom). Birth length was inverse normal transformed before analysis.
ALSPAC mothers and children were genotyped on the Illumina 660 and 550 K SNP chips respectively. Geno-typing and data cleaning protocols have been described extensively elsewhere (Evans et al. 2013; Fatemifar et al. 2013). Mothers' and children's datasets were cleaned independently yielding 8,365 unrelated individuals in the children's dataset and 8,340 individuals in the mothers' dataset. Combining the two datasets yielded 5,504 mother offspring pairs (the reduced number of complete pairs is a consequence of the fact that individuals were excluded independently from either dataset during cleaning, thus yielding a high number of “singleton” mothers and children). The presence of cryptically related individuals within a GCTA analysis can disproportionately influence estimates of the amount of genetic variance explained by common SNPs (Yang et al. 2010). We therefore removed one individual from each pair of putatively related individuals on the basis of the maternal genetic relatedness matrix (related defined here as having standardized genome-wide IBS > 0.025), did the same for the children's genetic relatedness matrix, and similarly one individual from each pair of putatively related individuals from the matrix of mother-offspring genetic relatedness matrix (i.e. children that exhibited excessive relatedness with mothers not their own). This yielded a combined dataset of 4,625 mother–offspring pairs for analysis. Of these pairs, 4,163 had data on maternal height, and 3,536 had data on birth length.
The pedigree file containing the genotype data was arranged so that mothers were ordered according to personal identifier, and their offspring were placed below them in exactly the same order. We used the GCTA software to estimate the genetic relationship between each individual in the dataset (Yang et al. 2010). The top left quadrant of the matrix produced by this analysis is equivalent to the genetic relationship matrix describing the relationship between mothers (i.e. the A matrix defined in the previous section), the bottom right quadrant represents the genetic relationship matrix between children (the B matrix), and the lower left matrix plus its transpose represents the Δ matrix. We extracted these components of the overall genetic relationship matrix and used them to fit a linear mixed model in the GCTA software.
Results
Table 2 summarizes the simulation results for four contrasting data sets: (1) all the genes have only direct genetic effects (G); (2) half the genes have only direct effects (G), half have only indirect, maternal, effects (M) and none have effects on both (Q = 0); (3) all the genes have indirect maternal effects only (M); (4) 75 genes have direct effects only, 75 have only maternal effects, and 50 have both direct and maternal effects. The fact that effect sizes were chosen to be deliberately large compared with those of the residual environment means the simulated findings are obviously consistent with the theory developed above. In each case the “best” model based on parsimony and likelihood-ratio Chi square is that used to simulate the data and the estimated variance components correspond well to those used to simulate the corresponding data set.
Parallel analysis of the simulated “Model 4” example confirmed that estimates of model parameters and test statistics obtained from OpenMx and Yang et al's software were in very close agreement (Table 3).
Table 3. Comparison of estimates obtained from simulated data by FIML in OpenMx and REML in GCTA.
| μ | G | M | Q | E | −2(L + C1) | χ2 | d.f. | P% | |
|---|---|---|---|---|---|---|---|---|---|
| Open Mx results | |||||||||
| Simulated | 125.77 | 15.71 | 15.78 | 5.89 | 3.86 | – | – | – | – |
| Full | 125.55 | 15.41 | 15.89 | 6.50 | 4.02 | 5284.08 | – | – | – |
| Q = 0 | 125.56 | 16.04 | 16.43 | 0 | 3.98 | 5314.57 | 30.49 | 1 | <10−6 |
| M = Q = 0 | 125.62 | 25.87 | 0 | 0 | 16.38 | 6054.66 | 770.58 | 2 | <10−6 |
| G = Q = 0 | 125.63 | 0 | 25.94 | 0 | 15.44 | 6005.47 | 729.39 | 2 | <10−6 |
| M = G = Q = 0 | 125.77 | 0 | 0 | 0 | 42.45 | 6586.25 | 1302.17 | 3 | <10−6 |
| GCTA results | |||||||||
| Simulated | 125.77 | 15.71 | 15.78 | 5.89 | 3.86 | – | – | – | – |
| Full | 125.55 | 15.41 | 15.89 | 6.50 | 4.02 | 3451.22 | – | – | – |
| Q = 0 | 125.56 | 16.04 | 16.43 | 0 | 3.99 | 3481.28 | 30.66 | 1 | <10−6 |
| M = Q = 0 | 125.62 | 25.87 | 0 | 0 | 16.40 | 4220.68 | 769.46 | 2 | <10−6 |
| G = Q = 0 | 125.63 | 0 | 25.94 | 0 | 15.46 | 4171.56 | 720.34 | 2 | <10−6 |
| M = G = Q = 0 | NA | 0 | 0 | 0 | 42.49 | 4751.54 | 1300.32 | 3 | <10−6 |
The results from the ALSPAC study (Table 4) agree with the expectation that only the maternal genotype (M) contributes significantly to variation in maternal stature. Deleting the contributions of M and Q from the model led to a highly significant change in likelihood ( , P < 10−10) whereas omitting the effects of the offspring genotype (G = Q = 0) results in a non-significantly worse fit ( , P = 38 %). The estimate of the genetic variance in maternal stature is 0.72 ±0.11 which is larger than the value (0.45) reported for stature by Yang et al. (2010) in GCTA of stature for a sample of 3,925 unrelated individuals. We attempted to reduce possible influence of extreme values in the ALSPAC data by excluding 124 mothers with reported values <150 or >180 cm, resulting in a modestly lower estimate of 0.65 ± 0.12 for the proportion of genetic variance. By contrast to the results for stature, none of the changes in likelihood for the birth length data reach significance at the 5 % level but the results illustrate what is expected for a trait that is influenced both by maternal and fetal genotype with different genes contributing to the maternal and fetal effects (Q = 0). This finding is expected under the “two character” model for fetal and maternal effects noted by Haley et al. (1981). In this model, the contributions of G and M approach statistical significance at the 5 % level (one-tail test) and explain 13 and 11 %, respectively, of the variance in birth length.
Table 4. Results of fitting “GCTA” model for direct and maternal effects to maternal stature and birth length data in the ALSPAC cohort. Results are presented as standardized variance components.
| Model | G | M | Q | E | −2lnl | χ2 | d.f. | P% | |
|---|---|---|---|---|---|---|---|---|---|
| Maternal stature | Full | 0.15 (0.11) | 0.72 (0.11) | -0.08 (0.09) | 0.21 (0.12) | 19825.526 | – | – | – |
| Q = 0 | 0.09 (0.08) | 0.66 (0.09) | – | 0.25 (0.10) | 19826.412 | 0.886 | 1 | 35 | |
| M = Q = 0 | 0.24 (0.08) | – | – | 0.76 (0.09) | 19881.294 | 55.768 | 2 | 8 × 10⁻¹¹ | |
| G=Q= 0 | – | 0.68 (0.08) | – | 0.32 (0.08) | 19827.480 | 1.954 | 2 | 38 | |
| M = G = Q = 0 | – | – | – | 1 | 19889.516 | 63.99 | 3 | 8 × 10⁻¹² | |
| Birth length | Full | 0.13 (0.13) | 0.11 (0.13) | 0.06 (0.10) | 0.70 (0.14) | 3553.870 | – | – | – |
| Q = 0 | 0.18 (0.10) | 0.16 (0.10) | – | 0.66 (0.13) | 3554.242 | 0.37 | 1 | 54 | |
| M = Q = 0 | 0.22 (0.10) | – | – | 0.78 (0.10) | 3556.624 | 2.75 | 2 | 25 | |
| G=Q= 0 | – | 0.20 (0.10) | – | 0.80 (0.10) | 3557.646 | 3.78 | 2 | 15 | |
| M = G = Q = 0 | – | – | – | 1 | 3561.774 | 7.90 | 3 | 5 |
Model parameters are: G variance due to direct genetic (“offspring/fetal”) effects, M variance due to indirect genetic effects on offspring phenotype (“maternal effects”), Q phenotypic variance due to covariance of direct and indirect genetic effects, E residual (“unique environmental effects”)
Implications, limitations and further directions
The above theoretical treatment, illustrated by two traits with different a priori expectations, demonstrates how the approach of GCTA can be extended to incorporate the effects of the maternal genotype on individual differences when genome-wide polymorphisms are obtained on both mothers and their children. The underlying model is identical to that used for maternal effects in the analysis of extended kinship studies such as those involving the children of twins. Application of the model to maternal height and offspring birth length yield estimates of the maternal and fetal components that are consistent with the a priori expectation that maternal height is affected only by the maternal genotype and offspring birth length by both maternal and fetal genotypes, with the added implication that different genes contribute to the maternal and fetal effects (Q = 0).
The results for Model 4 from the simulated data provide the greatest insight about the implications of including maternal effects in the GCTA model or, more seriously, of ignoring them when they are present. First, extending GCTA to include indirect genetic effects is quite feasible. Our analyses show that including the SNPs of relatives (mothers in our case) allows us to resolve indirect effects of relatives' genotypes from direct effects within the framework offered by GCTA. In theory, M-GCTA is able to resolve effects of the genotype-environment covariance (Q) from the contribution of maternal effects to phenotypic variation (M) although we suspect the power will be low. In contrast, the classical approach based on phenotypic covariances between collateral relatives can detect the joint effects of M and Q and resolve them from the direct genetic effects, G, but cannot separate M from Q. Intergenerational data can resolve these effects in theory but they may be confounded with cohort differences in genetic effects.
That being said, however, the results offer a cautionary codicil to any claim that GCTA applied to unrelated subjects has supplanted other approaches (e.g. studies of twins and the kinships of twins) that do not exploit direct genomic information and might be “biased” by the effects of the shared environment and other factors. We note that an incompletely specified GCTA model for unrelated subjects that ignores the covariance structure created by the indirect environmental influences of relatives' genotypes may also contribute to significant bias on GCTA estimates of genetic variance. Thus, for example, in Model 4 (Table 2), ignoring the indirect effects of the maternal genotype inflates estimates of the genetic component by more than 60 %. Similarly, if all the variation is due to the indirect effects of the maternal genotype (Model 3) fitting a misspecified model with M = 0 and G > 0 will yield a positive estimate of G even when the true value of zero. This is not the case in the classical twin study, maternal effects and the contributions of M and Q contribute to the estimate of shared environmental effects, C, whereas the effects of G contribute to estimates of the additive genetic variance component, A. We also note that, in the classical twin study, the genetic consequences of assortative mating and population stratification are confounded with estimates of C. The effects of assortative mating on parameters estimated from M-GCTA, including estimates of maternal effects, have still to be explored.
As with the classical model for maternal effects in quantitative genetics, M-GCTA does not require explicit specification of the features of the maternal phenotype that mediates the maternal influence. That is, the detection of maternal effects depends only on demonstrating that the maternal genotype has an impact over and above its effect through the zygotes of her offspring. In principle, the univariate model we have developed can be extended to incorporate the effects of hypothesized mediating variables such as features of the maternal phenotype. Such developments currently await the provision of more flexible structural modeling features in the GCTA software or the further evolution of structural modeling software such as OpenMX to incorporate problems of the dimensions posed by large genetic relatedness matrices. An interim approach would be the incorporation of maternal features as fixed covariates in the classical GCTA model. However, this approach suffers from the problem that fixed covariates may only be error-prone, partial, indices of the latent source of maternal influence.
All the limitations of GCTA enumerated in the literature apply, mutatis mutandis, to any extension to maternal effects and the environmental effects of other relatives' genotypes. In so far as the genetic relatedness coefficients derived from the genome wide SNP data do not reflect the underlying genetic correlations for the variants contributing to phenotypic differences, estimates of the genetic components may be biased (Yang et al., 2011b). Further theoretical study is needed to discover how far this complication may generate spurious maternal or offspring effects in models incorporating other genetic effects on the extended phenotype including environmental effects of other relatives and the genetic causes and consequences of non-random mate selection. It is evident from our application to ALSPAC data that power may be low and large samples are likely to be required for this, as for most other, approaches to the modeling of complex genetic effects in humans.
The current model and analyses do not take into account the effects of population stratification. In principle, some of the effects might be removed by partialling out the principal components of population structure as is currently done in standard GCTA. The extent to which this approach is adequate to deal with stratification in M-GCTA is a subject for further inquiry, especially if future population studies extend to the inclusion of genome-wide SNP data on both mothers and fathers of target subjects.
The application of GCTA to maternal effects is likely to be important for the study of early development but does not exhaust the potential for further theoretical work that includes other genetic features of the extended phenotype, including the indirect genetic effects of fathers, spouses, siblings and peers. In the last analysis, each approach and circumstance has to be viewed in the light of its specific merits and none is likely to be definitive given what has emerged in the last 50 years about the subtlety of genetic and environmental influences in kinship studies of behavior and from animal models where maternal and fetal genotypes may be controlled by breeding and cross-fostering. We hope that the current work will encourage further theoretical extension of GCTA and its more sophisticated application to the complexities of human behavior to incorporate genome-wide information from relatives of primary subjects.
Acknowledgments
This work was partly conducted in the Medical Research Council Integrative Epidemiology Unit, a research unit supported by the Medical Research Council (MC_UU_12013 to GDS). The study was supported by a Benjamin Meaker visiting professorship at the University of Bristol Institute for Advanced Studies, UK (LJE), an Australian Research Council Future Fellowship (FT130101709, DME), a Medical Research Council Programme Grant (MC_UU_12013/4, DME), National Institute of Health grants P60MD002256 (York, Eaves) and R01AA018333 (Eaves, York) and an Autism Speaks grant (7132,BStP). We thank Peter Visscher and Matthew Robinson for insightful comments on an earlier draft of this paper. We are extremely grateful to all the families who took part in the study, the midwives for their help in recruiting them, and the whole ALSPAC team, which includes interviewers, computer and laboratory technicians, clerical workers, research scientists, volunteers, managers, receptionists and nurses. The UK Medical Research Council and the Wellcome Trust (Grant ref: 092731) and the University of Bristol provide core support for ALSPAC. This publication is the work of the authors and D.M.E will serve as guarantor for the contents of this paper.
Contributor Information
Lindon J. Eaves, Email: eaves.lindon@gmail.com, Department of Human and Molecular Genetics, Virginia, Institute for Psychiatric and Behavioral Genetics, Virginia, Commonwealth University School of Medicine, Richmond, VA, USA.
Beate St. Pourcain, MRC Integrative Epidemiology Unit, University of Bristol, Bristol, UK; School of Oral and Dental Sciences, University of Bristol, Bristol, UK; School of Experimental Psychology, University of Bristol, Bristol, UK
George Davey Smith, MRC Integrative Epidemiology Unit, University of Bristol, Bristol, UK; School of Social and Community Medicine, University of Bristol, Bristol, UK.
Timothy P. York, Department of Human and Molecular Genetics, Virginia, Institute for Psychiatric and Behavioral Genetics, Virginia, Commonwealth University School of Medicine, Richmond, VA, USA
David M. Evans, MRC Integrative Epidemiology Unit, University of Bristol, Bristol, UK; School of Social and Community Medicine, University of Bristol, Bristol, UK; Translational Research Institute, University of Queensland, Diamantina Institute, Brisbane, QLD, Australia
References
- Boker SM, Neale MC, Maes HH, Wilde MJ, Spiegel M, Timothy R, Brick TR, Spies J, Estabrook R, Kenny S, Bates TC, Mehta P, Fox J. OpenMx: an open source extended structural equation modeling framework. Psychometrika. 2011;76:306–317. doi: 10.1007/s11336-010-9200-6. [DOI] [PMC free article] [PubMed] [Google Scholar]
- Boker SM, Neale MC, Maes HH, Wilde MJ, Spiegel M, Timothy R, Brick TR, Spies J, Estabrook R, Bates TC, Mehta P, Fox J, von Oertzen T, Gore RJ, Hunter MD, Hackett DC, Karch J, Brandmaier AM. OpenMx 999.0 User Guide 2012 [Google Scholar]
- Boyd A, Golding J, Macleod J, Lawlor DA, Fraser A, Henderson J, Molloy L, Ness A, Ring S, Davey Smith G. Cohort profile: the ‘children of the 90s’–the index offspring of the Avon Longitudinal Study of Parents and Children. Int J Epidemiol. 2013;42:111–127. doi: 10.1093/ije/dys064. [DOI] [PMC free article] [PubMed] [Google Scholar]
- Cavalli-Sforza LL, Feldman MW. Cultural versus biological inheritance: phenotypic transmission from parents to children. (A theory of the effect of parental phenotypes on children's phenotypes) Am J Hum Genet. 1973;25:618–637. [PMC free article] [PubMed] [Google Scholar]
- Cloninger CR, Rice J, Reich T. Multifactorial inheritance with cultural transmission and assortative mating. II. a general model of combined polygenic and cultural inheritance. Am J Hum Genet. 1979;31:176–198. [PMC free article] [PubMed] [Google Scholar]
- Corey LA, Nance WE. The monozygotic half-sib model: a tool for epidemiologic research. Prog Clin Biol Res. 1978;24A:201–209. [PubMed] [Google Scholar]
- Dawkins R. The extended phenotype. Oxford University Press; Oxford; 1989. [Google Scholar]
- Eaves LJ. A model for sibling effects in man. Heredity. 1976;36:205–214. doi: 10.1038/hdy.1976.25. [DOI] [PubMed] [Google Scholar]
- Evans DM, Zhu G, Dy V, Heath AC, Madden PA, Kemp JP, McMahon G, Pourcain B, Timpson NJ, Golding J, Lawlor DA, Steer C, Montgomery GW, Martin NG, Smith GD, Whitfield JB. Genome-wide association study identifies loci affecting blood copper, selenium and zinc. Hum Mol Genet. 2013;22:3807–3817. doi: 10.1093/hmg/ddt239. [DOI] [PMC free article] [PubMed] [Google Scholar]
- Falconer DS, McKay TFC. Introduction to quantitative genetics. 4th. Pearson Education; Harlow: 1996. [Google Scholar]
- Fatemifar G, Hoggart CJ, Paternoster L, Kemp JP, Prokopenko I, Horikoshi M, Wright VJ, Tobias JH, Richmond S, Zhurov AI, Toma AM, Pouta A, Taanila A, Sipila K, Läki R, Pillas D, Geller F, Feenstra B, Melbye M, Nohr EA, Ring SM, Pourcain B, Timpson NJ, Davey Smith G, Jarvelin MR, Evans DM. Genome-wide association study of primary tooth eruption identifies pleiotropic loci associated with height and craniofacial distances. Hum Mol Genet. 2013;22:3807–3817. doi: 10.1093/hmg/ddt231. [DOI] [PMC free article] [PubMed] [Google Scholar]
- Fisher RA. The correlation between relatives on the supposition of Mendelian inheritance. Philol Trans Roy Soc Edinb. 1918;52:399–433. [Google Scholar]
- Fraser A, Macdonald-Wallis C, Tilling K, Boyd A, Golding J, Davey Smith G, Henderson J, Macleod J, Molloy L, Ness A, Ring S, Nelson SM, Lawlor DA. Cohort profile: the Avon Longitudinal Study of Parents and Children: ALSPAC mothers cohort. Int J Epidemiol. 2013;42:97–110. doi: 10.1093/ije/dys066. [DOI] [PMC free article] [PubMed] [Google Scholar]
- Haley CS, Jinks JL, Last K. The monozygotic twin half-sib method for analysing maternal effects and sex-linkage in humans. Heredity. 1981;46:227–238. doi: 10.1038/hdy.1981.30. [DOI] [PubMed] [Google Scholar]
- Mather K, Jinks JL. Biometrical genetics: the study of continuous variation. 3rd. Chapman-Hall; London: 1982. [Google Scholar]
- Meyer K. Restricted maximum likelihood to estimate variance components for animal models with several random effects using a derivative-free algorithm. Genet Sci Evol. 1989;21:317–340. [Google Scholar]
- Truett KR, Eaves LJ, Walters EE, Heath AC, Hewitt JK, Meyer JM, Silberg J, Neale MC, Martin NG, Kendler KS. A model system for analysis of family resemblance in extended kinships of twins. Behav Genet. 1994;24:35–49. doi: 10.1007/BF01067927. [DOI] [PubMed] [Google Scholar]
- Trzaskowski M, Davis OS, Defries JC, Yang J, Visscher PM, Plomin R. DNA evidence for strong genome-wide pleiotropy of cognitive and learning abilities. Behav Genet. 2013;43:267–273. doi: 10.1007/s10519-013-9594-x. [DOI] [PMC free article] [PubMed] [Google Scholar]
- Wright S. Correlation and Causation. J Agr Res. 1921;20:557–585. [Google Scholar]
- Yang J, Benjamin B, McEvoy BP, Gordon S, Henders AK, Nyholt DR, Madden PA, Heath AC, Martin NG, Montgomery GW, Goddard ME, Visscher PM. Common SNPs explain a large proportion of the heritability for human height. Nat Genet. 2010;42:565–569. doi: 10.1038/ng.608. [DOI] [PMC free article] [PubMed] [Google Scholar]
- Yang JS, Lee H, Goddard ME, Visscher PM. GCTA: a Tool for genome-wide complex trait analysis. Am J Hum Genet. 2011a;88:76–82. doi: 10.1016/j.ajhg.2010.11.011. [DOI] [PMC free article] [PubMed] [Google Scholar]
- Yang J, Manolio TA, Pasquale LR, Boerwinkle E, Caporaso N, Cunningham JM, de Andrade M, Feenstra B, Feingold E, Hayes MG, Hill WG, Landi MT, Alonso A, Lettre G, Lin P, Ling H, Lowe W, Mathias RA, Melbye M, Pugh E, Cornelis MC, Weir BS, Goddard ME, Visscher PM. Genome partitioning of genetic variation for complex traits using common SNPs. Nat Genet. 2011b;43:519–525. doi: 10.1038/ng.823. [DOI] [PMC free article] [PubMed] [Google Scholar]
- York TP, Strauss JF, 3rd, Neale MC, Eaves LJ. Estimating fetal and maternal genetic contributions to premature birth from multiparous pregnancy histories of twins using MCMC and maximum-likelihood approaches. Twin Res Hum Genet. 2009;12:333–342. doi: 10.1375/twin.12.4.333. [DOI] [PMC free article] [PubMed] [Google Scholar]
- York TP, Strauss JF, 3rd, Neale MC, Eaves LJ. Racial differences in genetic and environmental risk to preterm birth. PLoS One. 2010;5(8):e12391. doi: 10.1371/journal.pone.0012391. [DOI] [PMC free article] [PubMed] [Google Scholar]
- York TP, Eaves LJ, Lichtenstein P, Neale MC, Svensson A, Latendresse S, Långstörm N, Strauss JF., 3rd Fetal and maternal genes' influence on gestational age in a quantitative genetic analysis of 244,000 swedish births. Am J Epidemiol. 2013;178:543–550. doi: 10.1093/aje/kwt005. [DOI] [PMC free article] [PubMed] [Google Scholar]