Abstract
Cyclic nucleotide phosphodiesterases (PDEs) regulate the intracellular concentrations and effects of adenosine 3’,5’-cyclic monophosphate (cAMP) and guanosine 3’,5’-cyclic monophosphate (cGMP). The role of PDEs in malignant tumor cells is still uncertain. The role of PDEs, especially PDE2, in human malignant melanoma PMP cell line was examined in this study. In PMP cells, 8-bromo-cAMP, a cAMP analog, inhibited cell growth and invasion. However, 8-bromo-cGMP, a cGMP analog, had little or no effect. PDE2 and PDE4, but not PDE3, were expressed in PMP cells. Growth and invasion of PMP cells were inhibited by erythro-9-(2-Hydroxy-3-nonyl) adenine (EHNA), a specific PDE2 inhibitor, but not by rolipram, a specific PDE4 inhibitor. Moreover, cell growth and invasion were inhibited by transfection of small interfering RNAs (siRNAs) specific for PDE2A and a catalytically-dead mutant of PDE2A. After treating cells with EHNA or rolipram, intracellular cAMP concentrations were increased. Growth and invasion were stimulated by PKA14-22, a PKA inhibitor, and inhibited by N6-benzoyl-c AMP, a PKA specific cAMP analogue, whereas 8-(4-chlorophenylthio)-2’-O-methyl-cAMP, an Epac specific cAMP analogue, did not. Invasion, but not growth, was stimulated by A-kinase anchor protein (AKAP) St-Ht31 inhibitory peptide. Based on these results, PDE2 appears to play an important role in growth and invasion of the human malignant melanoma PMP cell line. Selectively suppressing PDE2 might possibly inhibit growth and invasion of other malignant tumor cell lines.
Keywords: Human malignant melanoma, Phosphodiesterase 2, Cell growth, Invasion, Cyclic AMP
1. Introduction
Cyclic nucleotide phosphodiesterases (PDEs) play an important role in signal transduction by modulating intracellular levels of cyclic nucleotides. These ubiquitous enzymes lower the intracellular concentrations of cyclic nucleotides by hydrolyzing adenosine 3’,5’-cyclic monophosphate (cAMP) and guanosine 3’,5’-cyclic monophosphate (cGMP) to their respective 5’nucleoside monophosphates [1]. The PDE superfamily represents 11 gene families (PDE1 to PDE11), which differ in their biochemical properties, their regulation, and their sensitivity to pharmacological agents [2]. PDE inhibitors affect many pathological conditions, but their use as anticancer agents has not been completely developed.
cGMP-stimulated phosphodiesterase (PDE2), a homodimer of two 105-kDa subunits, is found in association with intracellular membranes as well as in cytosolic fractions. PDE2 enzymatic activity was first described in rat liver extracts [3] and was subsequently purified to apparent homogeneity from various tissues, including bovine heart and adrenal gland [4], calf liver [5], bovine brain [6], rat liver [7], and rabbit brain [8]. Although cGMP is the preferred substrate and effector molecule for this enzyme, PDE2 hydrolyzes both cGMP and cAMP with positively cooperative kinetics. At physiological concentrations of cyclic nucleotides, PDE2 responds to elevated cGMP with increased hydrolysis of cAMP. Therefore, PDE2, which is sometimes referred to as a cGMP-stimulated cAMP PDE, can provide crosstalk between cAMP and cGMP signaling pathways [9].
cAMP is a positive intracellular signal for cell proliferation in many differentiated cells [10,11]. In many tumor cells, however, cAMP is a negative messenger for proliferation, with lower basal cAMP concentrations in some tumor cells than in normal cells [11]. Various agents that increase cAMP have previously been found to inhibit tumor cell growth in vitro. However, PDE inhibitors, especially those of the methylxanthine type, display growth inhibition only at rather high concentrations [11–18]. Elevation of intracellular cAMP levels can regulate the metastatic ability of tumor cells either positively [19–21] or negatively [22–25], depending upon the cell type.
cGMP regulates smooth muscle relaxation, platelet aggregation, and neurotransmission. It has been reported that increasing intracellular cGMP induces apoptosis in a colon tumor cell line [26]; however, it has also been reported that the cGMP analogs did not inhibit proliferation in a malignant glioma cell line [25].
cAMP and cGMP exist in all cells; by catalyzing hydrolysis of these second messengers, PDEs are thought to play important roles in regulation of their signals. However, the role of PDE2 is still unclear in malignant tumor cells. In this study, the role of PDE2 in growth and invasion of a malignant melanoma cell line was examined using a specific PDE2 inhibitor and PDE2A small interfering RNAs (siRNAs).
2. Materials and methods
2.1. Cell culture
Human malignant melanoma PMP cells [27] were established from a 65-y-old patient with primary palatal malignant melanoma who was treated in our department in 1986. PMP cells had a polygonal shape and were amelanotic. PMP cells were maintained in RPMI 1640 medium (Invitrogen, Carlsbad, CA) supplemented with 5% fetal bovine serum (FBS) (Sigma, St. Louis, MO). HMG cells (which expressed PDE3A, PDE3B and PDE4D, and were used as positive control for PDE3A, PDE3B and PDE4D RT-PCR) were maintained in RPMI 1640 medium supplemented with 10% FBS, and KB cells (which expressed PDE4A and were used as positive control for PDE4A immunoblots) were maintained in RPMI 1640 medium supplemented with 10% FBS at 37°C in a humidified 5% CO2 atmosphere.
2.2. Cell growth assays
Cells were plated at 400 cells/well in 96-well plates, allowed to adhere for 24 h, and then cultured in the absence or presence of different concentrations of reagents for 3 or 5 days. MTS [3-(4,5-dimethylthiazol-2-yl)-5-(3-carboxymethoxyphenyl)-2-(4-sulfophenyl)-2H-tetrazolium] assays were performed using CellTiter 96 Aqueous One Solution Cell Proliferation Assay (Promega, Madison, WI), and cell numbers were calculated.
2.3. In vitro invasion assays
PMP cells (4 × 10⁴ cells) in RPMI 1640 medium containing 0.1% FBS were transferred to 8 µm pore Matrigel pre-coated inserts (BD Bioscience, Bedford, MA). The inserts were placed in companion wells containing RPMI 1640 medium supplemented with 10% FBS as a chemoattractant. Following 16 h incubation, the inserts were removed, and the noninvading cells on the upper surface were removed with a cotton swab. Cells on the lower surface of the membrane were fixed and stained with May-Grünwald-Giemsa stain or Diff-Quik™ (Sysmex, Kobe, Japan). The number of stained cells was counted under a microscope or calculated using a MacSCOPE X image processing software (Mitani Corp., Fukui, Japan).
2.4. cAMP PDE activity assays
PMP cells were seeded at 1.5 × 10⁶ cells/100-mm dish. After 3 days, the cells were washed twice with PBS, harvested with a rubber policeman, and homogenized in 1 ml of ice-cold homogenization buffer [100 mM TES (pH 7.4), 10 µg/ml each of pepstatin, leupeptin, and aprotinin, 1 mM benzamidine, 0.5 mM pefabloc, 1 mM EDTA, 0.1 mM EGTA, 5 mM MgSO4, 10% glycerol]. cAMP PDE activity was assayed using a modification of a previously described procedure [28]. Samples were incubated at 30°C for 10 min in a total volume (0.3 ml) containing 50 mM Hepes (pH 7.4), 0.1 mM EGTA, 8.3 mM MgCl2, and 0.1 µM (3H)cAMP (18,000 cpm) with or without each PDE inhibitor: a specific PDE2 inhibitor erythro-9-(2-hydroxy-3-nonyl)adenine (EHNA); a specific PDE3 inhibitor (cilostamide); a specific PDE4 inhibitor (rolipram); and cGMP (which stimulates PDE2 and inhibits PDE3).
2.5. Reverse transcription-PCR
Cells were seeded at 1 × 10⁶ cells/25-cm2 flask. After 3 days, total RNA was isolated with the QuickGene RNA kit for cultured cells (Fuji Photo Film Co., Tokyo, Japan). First-strand cDNA was synthesized using total RNA with TaqMan reverse transcription reagents (Applied Biosystems, Foster City, CA). PCR was performed with specific primer pairs for PDE2, PDE3, and PDE4 isoforms (Table 1). The reverse transcription (RT) product (2 µl) was added to a PCR reaction, which included PCR buffer [10 mM Tris-HCl (pH 8.3), 50 mM KCl, 1.5 mM MgCl2, 0.01% gelatin], 0.2 mM dNTPs, 1 µM primers, and 5 units of Taq DNA polymerase (Applied Biosystems). Thirty PCR cycles were followed by denaturation at 94°C, annealing at 55°C, and extension at 72°C with a 2720 thermal cycler (Applied Biosystems). Reaction products were analyzed by electrophoresis of 5 µl samples in 2% agarose gels. The amplified DNA fragments were visualized by SYBR Green I staining.
Table 1.
Sequences of specific primer pairs for PDE2, PDE3, and PDE4 used in RT-PCR analysis.
| Gene | Sequence of primer pairs |
|---|---|
| PDE2A | 5’-GCA TGT GTC ATG ACC TGG AC-3’ |
| 5’-AGC ATG CGC TGA TAG TCC TT-3’ | |
| PDE3A | 5’-TCA CCT CTC CAA GGG ACT CCT-3’ |
| 5’-CAG CAT GTA AAA CAT CAG TGG C-3’ | |
| PDE3B | 5’-AAT TCT TCC AAC CAT CGA CC-3’ |
| 5’-GCA TGT AGC ACA TCT GTG GC-3’ | |
| PDE4A | 5’-AAC AGC CTG AAC AAC TCT AAC-3’ |
| 5’-CAA TAA AAC CCA CCT GAG ACT-3’ | |
| PDE4B | 5’-AGC TCA TGA CCC AGA TAA GTG-3’ |
| 5’-ATA ACC ATC TTC CTG AGT GTC-3’ | |
| PDE4C | 5’-TCG ACA ACC AGA GGA CTT AGG-3’ |
| 5’-GGA TAG AAG CCC AGG AGA AAG-3’ | |
| PDE4D | 5’-CGG AGA TGA CTT GAT TGT GAC-3’ |
| 5’-CGT TCC TGA AAA ATG GTG TGC-3’ |
2.6. Western blotting
Human full-length PDE3A recombinant protein was synthesized by a previously described procedure [29]. PDE3B recombinant protein and PDE4D recombinant protein (Signal Chem, Richmond, Canada) were purchased. PMP and KB cells were suspended in NuPAGE LDS sample buffer (Invitrogen). Gel electrophoresis [NuPAGE 4–12% Bis-Tris gel (Invitrogen)] was carried out in XCell SureLock Mini-Cell (Invitrogen). Following electrophoresis, proteins were transferred to iBlot Transfer stack PVDF membranes using iBlot (Invitrogen) or Trans-Blot®Turbo™ Transfer System transfer Pack (PVDF membranes) using Trans-Blot®Turbo™ Transfer System (Bio-Rad labo. Hercules, CA), and the membranes were blocked by incubation with PBST (0.1% Tween 20 in PBS) or supplemented with 2% ECL Advance blocking agent (GE Healthcare UK Ltd., Little Chalfont, Bockinghamshire, UK) for 1 h. The blots were incubated with each primary rabbit polyclonal antibody; PDE2A (FabGennix, Frisco, TX), PDE3A and PDE3B (from Dr. Manganiello), PDE4A (Abcam plc, Cambridge, UK), PDE4B (FabGennix), PDE4C and PDE4D (Abcam) overnight at 4°C or β-actin (Millipore, Billerica, MA) for 1h at RT and rinsed five times with PBST. Rinsed blots were incubated with horseradish peroxidase-conjugated donkey anti-rabbit IgG (GE Healthcare UK Ltd.) for 1 h and rinsed with PBST. Immunoreactivity was detected by chemiluminescence using ImmunoStar®LD (Wako Pure Chemical Industries Ltd., Osaka, Japan) or ECL Advance western blotting detection kits (GE Healthcare UK Ltd.). The protein content was determined using BCA protein assay kits (Pierce, Rockford, IL).
2.7. siRNA transfections
Silencer Pre-designed siRNAs (Applied Biosystems) specific for PDE2A (siRNA ID #4336 and #143734) were used in this study. Silencer negative control #1 siRNA (Applied Biosystems) was also used as a control siRNA. Transient transfection of siRNA was carried out using Lipofectamine RNAiMAX (Invitrogen). Diluted siRNA (final concentration 5 nM) in 100 µl Opti-MEM® I reduced-serum medium (Invitrogen) and 1 µl of Lipofectamine RNAiMAX were added to 24-well plates which were incubated for 20 min at room temperature to ensure complex formation. Into each well, cells were plated at 2.5 × 10⁴ cells/well in 0.5 ml of RPMI 1640 medium with 5% FBS. The cells were assayed after 2 days.
2.9. Quantitative real-time PCR
After transfection with siRNA, total RNA was isolated from PMP cells with the QuickGene RNA kit for cultured cells. cDNA synthesis was performed using 200 ng of total RNA primed with random hexamers as described in the TaqMan Gold RT-PCR kit (Applied Biosystems). The expression of PDE2A mRNA was quantified using real-time quantitative PCR (Applied Biosystems 7300 real-time PCR system, Applied Biosystems). Experiments were performed using TaqMan Universal PCR Master Mix (Applied Biosystems) with each primer and probe set (TaqMan Gene Expression Assays, Applied Biosystems). Expression of 18S rRNA was used as an internal control; 18S rRNA expression was not significantly different between control and treatments (data not shown).
2.10. cAMP content of PMP cells
PMP cells were plated at 1 × 10⁴ cells/well in 96-well plates, and allowed to adhere for 24 h. The cells were then incubated with medium containing indicated concentrations of EHNA and rolipram for 15 min. Intracellular cAMP content was determined using the cAMP Biotrak enzyme immunoassay (EIA) system (GE Healthcare UK Ltd.).
2.11. Transfection of monomeric red fluorescent protein (mRFP)-tagged dnPDE2A
The catalytically dead mutant of PDE2A (dnPDE2A) was a kind gift from Manuela Zaccolo, Institute of Neuroscience and Psychology, University of Glasgow, Glasgow, Scotland, UK [30]. PMP cells were seeded at 2 × 10⁵ cells/12.5 cm2 flask. After 2 days, transfection of the plasmids was carried out using Lipofectamine 2000 (Invitrogen). The plasmids (6.6 µg) and Lipofectamine 2000 (16.5 µl) in 330 µl Opti-MEM® I reduced-serum medium (Invitrogen) were added to 12.5 cm2 flask, and incubated for 48 hours at 37°C in a humidified 5% CO2 atmosphere. After 48 hours, the cells were harvested with trypsin solution (Invitrogen). Cell number was counted under fluorescence microscope and the efficiency of transfected of plasmid DNA into PMP cells was calculated.
2.12. Immunocytochemistry
PMP cells were seeded at 2 × 10³ cells/chamber in 8 Chamber Polystyrene Vessel Tissue Culture Treated Glass Slide (BD, Bedford, MA). After 5 days, the cells were washed 3 times with PBS (−) at 4°C, fixed in methanol for 5 min at −30°C, and then washed 3 times with PBS (−). The fixed cells were incubated with 3% H2O2 for 10min, and washed 3 times with PBS (−) at RT. To block endogenous biotin, Biotin Blocking System (Dako, Glostrup, Denmark) was used. The cells were incubated with Avidin Solution for 10 min, washed 3 times with PBS (−) at RT, and then incubated with Biotin Solution for 10 min, washed 3 times with PBS (−) at RT. Slides were preincubated in 5% skim milk in PBS (−) for 10min at RT, and incubated with primary antibodies diluted in PBS (−) overnight at 4°C, washed 3 × 5 min with PBS (−), incubated with secondary antibody for 10 min at RT, and washed 3 × 5 min with PBS (−). To visualize, DAB (diaminobenzidine) was used. The nuclei were stained with hematoxylin.
2.14. Statistical analysis
All experiments were repeated three times. The difference in multiple group comparisons were analyzed using Tukey-Kramer multiple comparisons test, and the difference in two group comparisons were analyzed using Student’s t-test. Significance was defined as a calculated P value of less than 0.05.
3. Results
3.1. Effects of 8-bromo-cAMP and 8-bromo-cGMP on cell growth and invasion
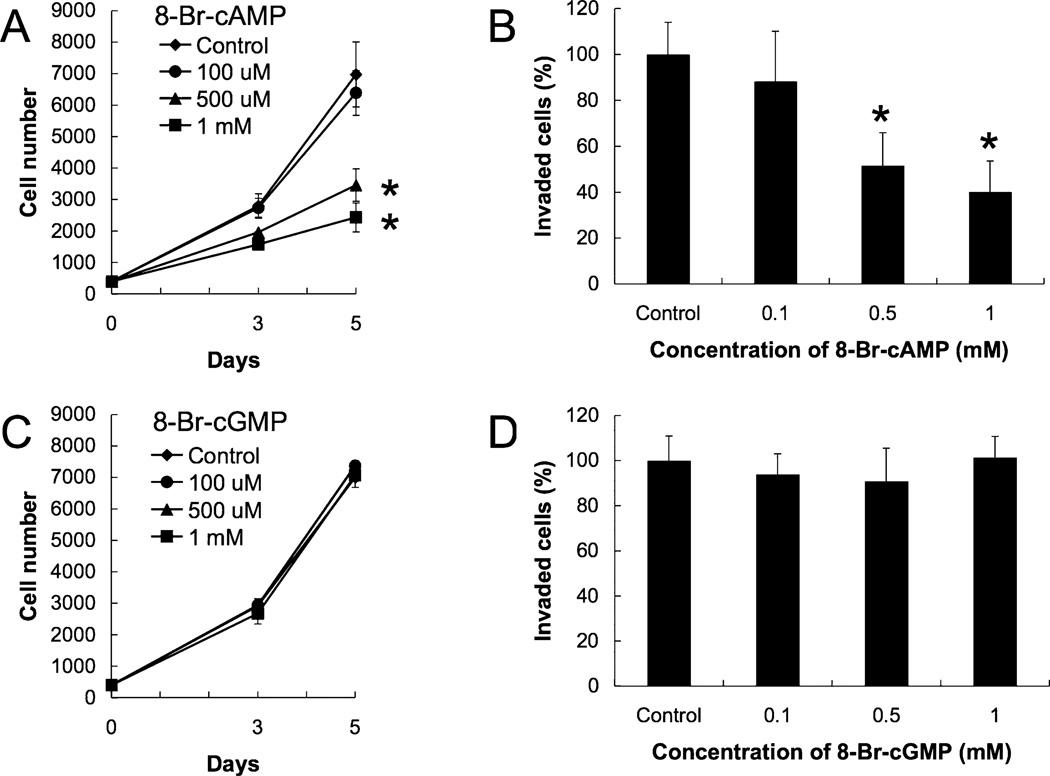
8-bromo-cAMP (8-Br-cAMP) suppressed cell growth and cell invasion in a dose-dependent manner (Fig. 1A and B). However, 8-bromo-cGMP (8-Br-cGMP) had no significant effect on cell growth or cell invasion (Fig. 1C and D).
Fig. 1.
Effects of 8-Br-cAMP or 8-Br-cGMP on cell growth and invasion. Cell growth was measured using the MTS assay. Cells were cultured in the absence or presence of 8-Br-cAMP (0.1 to 1 mM) or 8-Br-cGMP (0.1 to 1 mM) for 5 days. Cell invasion was examined by in vitro Matrigel invasion assays. Cells were transferred to 8 µm pore Matrigel pre-coated inserts, and 8-Br-cAMP (0.1 to 1 mM) or 8-Br-cGMP (0.1 t 1 mM) was added. After a 16 h incubation, invaded cells were stained with May-Grünwald-Giemsa stain and counted. Data in graphs are means of three independent experiments, each performed in duplicate. (A) Effect of 8-Br-cAMP on cell growth. (B) Effect of 8-Br-cAMP on cell invasion. (C) Effect of 8-Br-cGMP on cell growth. (D) Effect of 8-Br-cGMP on cell invasion. The error bars represent means ± SD, n = 3. The treatments that differ significantly from control are noted (*, P < 0.01).
3.2. Identification of PDEs in PMP cells
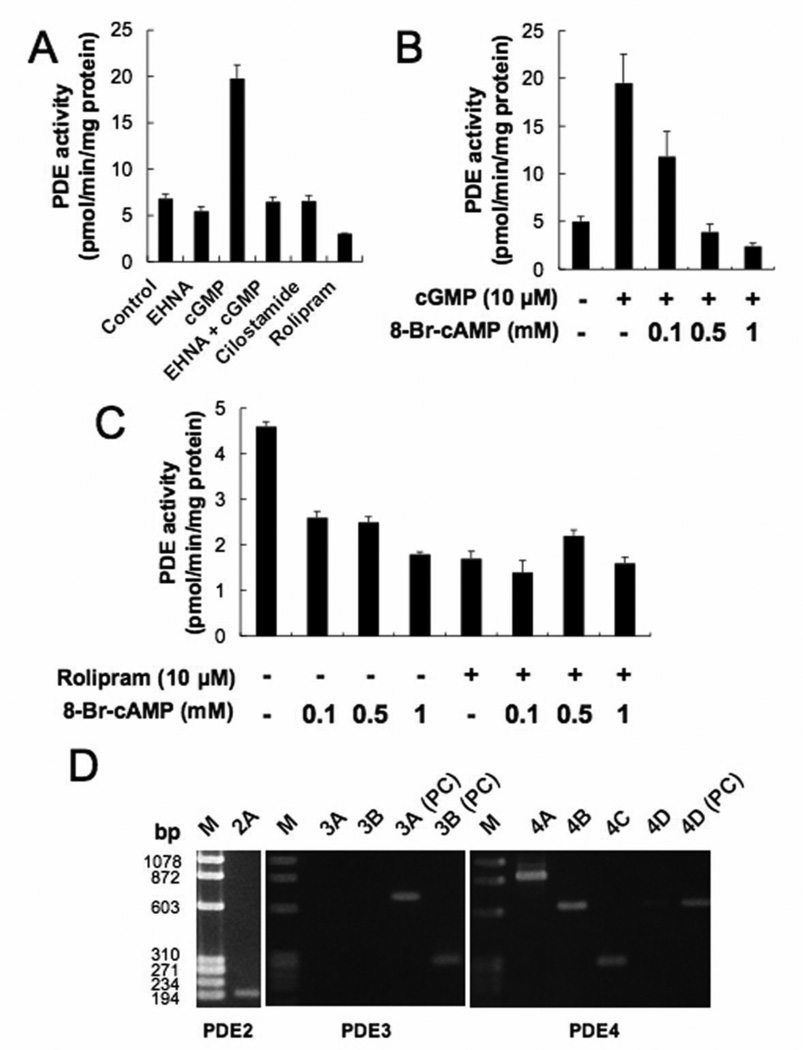
Total cAMP PDE activity in PMP cell homogenates was inhibited about 20% by EHNA, but was stimulated about three-fold by cGMP, indicating the presence of PDE2. This increase was suppressed by EHNA, a PDE2 inhibitor. PDE activity was minimally affected by cilostamide (PDE3 inhibitor), but was inhibited by about 55% by rolipram (PDE4 inhibitor) (Fig. 2A). Therefore, PMP cells exhibited PDE2 and PDE4 activities, but PDE3 activity was very low. Stimulated PDE activity was suppressed about 40% by 0.1 mM 8-Br-cAMP, 80% by 0.5 mM 8-Br-cAMP and 90% by 1 mM 8-Br-cAMP (Fig. 2B). Total cAMP PDE activity was suppressed about 45% by 0.1 mM and 0.5 mM 8-Br-cAMP, and 60% by 1 mM 8-Br-cAMP. 8-Br-cAMP did not add to the inhibitory effect of rolipram on PDE activity (Fig. 2C). Furthermore, RT-PCR was performed to ascertain the expression of PDE2, PDE3, and PDE4 mRNAs (Fig. 2D). Bands were seen for PDE2A, 4A, 4B, and 4C mRNAs. However, bands for PDE3A, 3B, and 4D were not seen.
Fig. 2.
Expression of PDEs and effects of 8-Br-cAMP on PDE activity in PMP cells. Data in graphs are means of three independent experiments, each performed in triplicate. (A) PDE activities were analyzed by cAMP PDE activity assay with or without each specific PDE inhibitor. The error bars represent means ± SD (n = 3). The concentrations of each reagents were: EHNA, 20 µM; cGMP, 10 µM; cilostamide, 0.5 µM; rolipram, 10 µM. (B) Effect of 8-Br-cAMP on cGMP-stimulated PDE activity in PMP cells. cGMP (10 µM) and 8-Br-cAMP (0.1 to 1 mM) were used. The error bars represent means ± SD, n = 3. (C) Effect of 8-Br-cAMP with or without rolipram on PDE activity in PMP cells. Rolipram (10 µM) and 8-Br-cAMP (0.1 to 1 mM) were used. (D) Expression of PDE mRNAs in PMP cells. RT-PCR analysis for PDE2, PDE3, and PDE4 mRNAs were performed. HMG cells derived from human gingival malignant melanoma were used as the positive control (PC) for PDE3A, 3B, and 4D mRNAs. Experiments were repeated three times, and similar results were obtained. 2A = PDE2A; 3A = PDE3A; 3B = PDE3B; 4A = PDE4A; 4B = PDE4B; 4C = PDE4C; 4D = PDE4D; M = molecular markers.
3.3. Western blotting of PDE3s and PDE4s
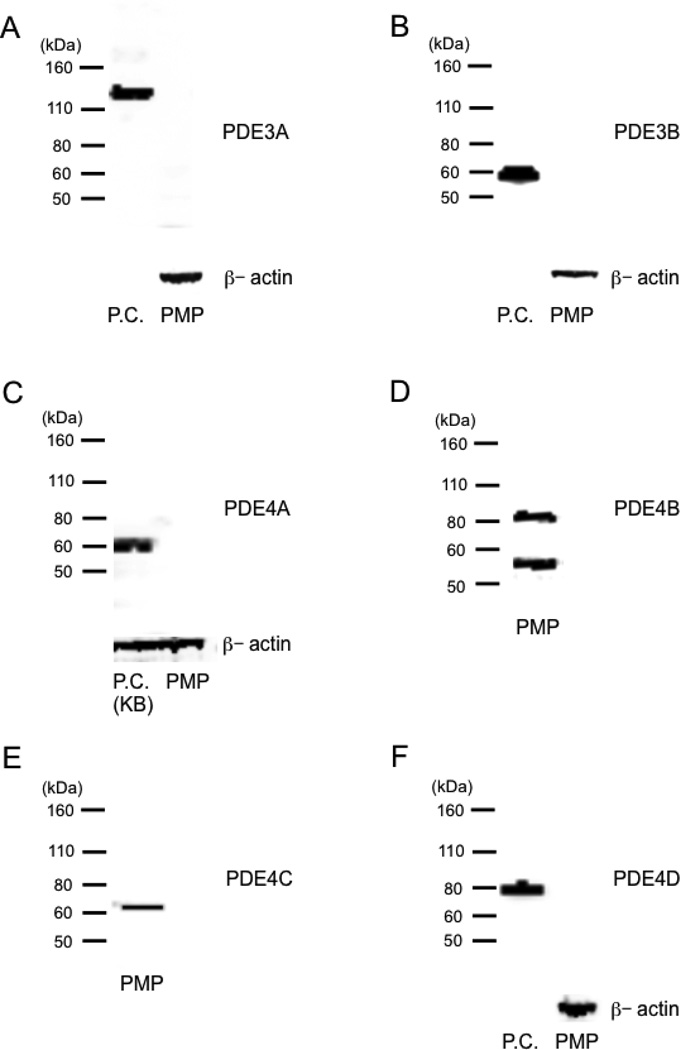
To confirm PDE3 and PDE4 mRNA findings we performed western blotting (Fig. 3). Bands were seen for PDE4B (~84 kDa and ~58 kDa) and 4C (~64 kDa), but not PDE3A, 3B and 4D, suggesting little or no expression of these isoforms (Fig. 3A, 3B, 3F). Except for PDE4A, these findings were consistent with the mRNA findings. PDE4A was not detected using western blotting (Fig. 3C). PDE4A antibody reacts with the C-TERMINAL region of PDE4A, and this region was detected using RT-PCR (data not shown). Taken together, these data suggested that expression of PDE4A was minimal in PMP cells. Since PDE4B and PDE4C in PMP cells were short forms which do not contain PKA phosphorylation sites, this may explain why cAMP PDE activity was not stimulated by 8-Br-cAMP (Fig. 2B, 2C).
Fig. 3.
Western blotting of PDE3s and PDE4s. Experiments were repeated two times, and similar results were obtained. (A) Western blotting of PDE3A. Positive control (P.C.) was human full-length PDE3A recombinant protein. (B) Western blotting of PDE3B. Positive control (P.C.) was human PDE3B recombinant protein from Signal Chem.. (C) Western blotting of PDE4A. Positive control (P.C.) was KB cells. (D) Western blotting of PDE4B. (E) Western blotting of PDE4C. (F) Western blotting of PDE4D. Positive control (P.C.) was human PDE4D recombinant protein from Signal Chem.. The positions of marker proteins and their sizes in kDa are given left on each panel.
3.3. Suppressive effects of PDE2A siRNA
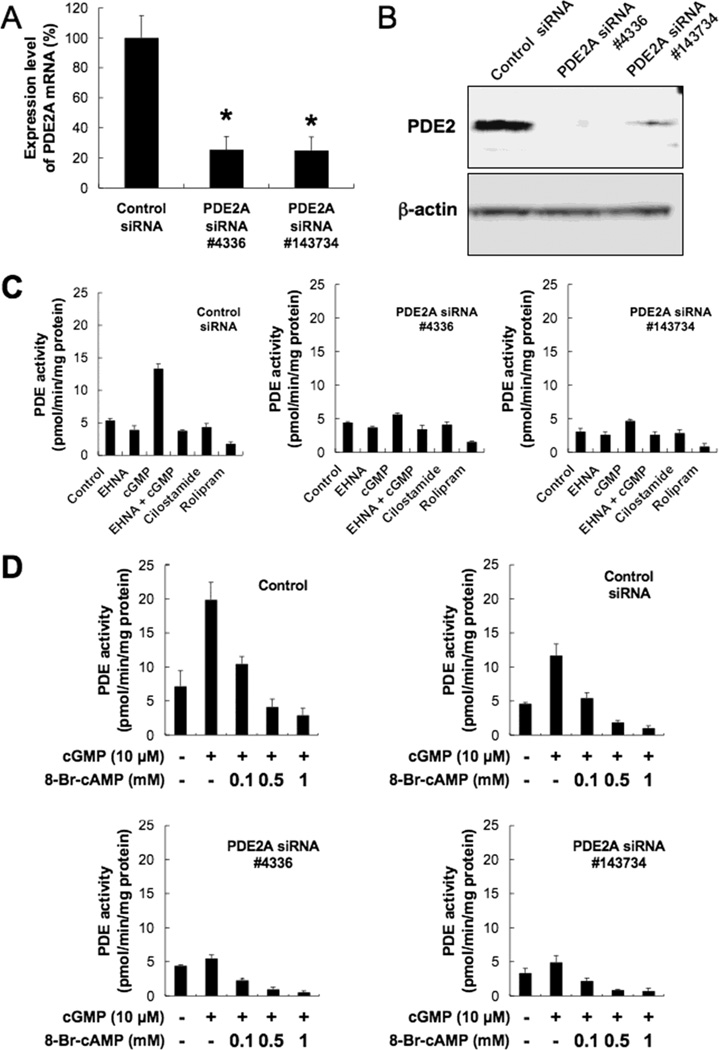
The suppressive effects of PDE2A siRNA on PDE2 expression were investigated. Quantitative real-time PCR was performed to quantitatively measure the expression of PDE2A mRNA after transfecting cells with PDE2A siRNA (Fig. 4A). PDE2A siRNA significantly suppressed the expression of PDE2A mRNA by about 75%. Similar results were obtained using two types of PDE2A siRNA. The expression of PDE2 protein was also ascertained using western blotting and PDE activity (Fig. 4B, 4C). The expression of PDE2A protein was decreased by siRNA transfection, thus demonstrating that the expression of PDE2 protein was suppressed, using two types of PDE2A siRNA. Furthermore, PDE2 activity were decreased by siRNA transfections, but PDE3 and PDE4 activities were not changed by the siRNAs (Fig. 4C). PDE activity stimulated by cGMP before and after siRNA treatments was suppressed by 8-Br-cAMP (Fig. 4D).
Fig. 4.
Effect of PDE2A siRNA transfection (5 nM of siRNA). Data in graphs are means of three independent experiments, each performed in triplicate. (A) Expression levels of PDE2A mRNA analyzed by quantitative real-time PCR. The error bars represent means ± SD, n = 3. A significant treatment effect is noted (*, P < 0.01 compared with control siRNA treatment). (B) Expression of PDE2 protein analyzed by western blotting. Experiments were repeated three times, and similar results were obtained. (C) Effect of PDE2A siRNA on PDE activity in PMP cells. The concentrations of each reagents were: EHNA, 20 µM; cGMP, 10 µM; cilostamide, 0.5 µM; rolipram, 10 µM. (D) Effect of 8-Br-cAMP on PDE2 A siRNA inhibited PDE activity in PMP cells. cGMP (10 mM) and 8-Br-cAMP (0.1 to 1 µM) were used.
3.4. Effects of PDE inhibitors and siRNA on cell growth
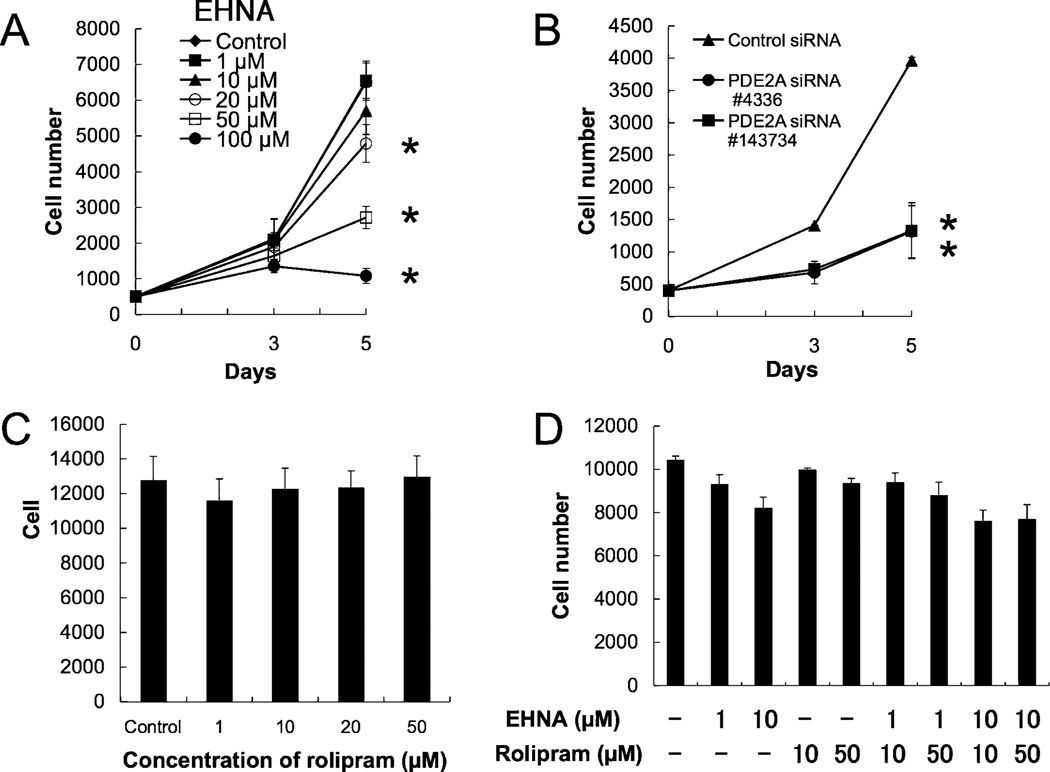
The effects of specific inhibitors of PDE2 and PDE4, as well as PDE2A siRNA, on cell growth were investigated. EHNA suppressed cell growth in a dose-dependent manner (Fig. 5A). Additionally, PDE2A siRNA significantly suppressed cell growth (Fig. 5B). Similar results were obtained using the two types of PDE2A siRNA, #4336 and #143734. However, rolipram (50 µM) had no significant effects on cell growth (Fig. 5C). The combined effect of EHNA and rolipram was also assessed. Rolipram (10, 50 µM) did not potentiate the suppressive effect of EHNA (1, 10 µM) (Fig. 5D). These findings demonstrate that PDE2 inhibition suppresses cell growth, but PDE4 inhibition does not result in marked changes in cell growth.
Fig. 5.
Effects of EHNA, rolipram, or PDE2A siRNA transfection on cell growth. Data in graphs are means of three independent experiments, each performed in triplicate. (A) Effect of EHNA on cell growth. PMP cells were cultured in the absence or presence of EHNA (1 to 100 µM) for 5 days. The error bars represent means ± SD, n = 3. The treatments that differ significantly from control are noted (*, P < 0.01 ). (B) Effect of PDE2A siRNA on cell growth. Cells were transfected with 5 nM siRNA, and, after 48 h, plated at 400 cells/well in a 96-well plate. The error bars represent means ± SD, n = 3. A significant treatment effect is noted (*, P < 0.01 compared with control siRNA treatment). (C) Effect of rolipram on cell growth. Five days after the addition of rolipram, the number of cells was measured. The error bars represent means ± SD, n = 3. (D) Combined effects of EHNA and rolipram on cell growth. Five days after addition of EHNA (1, 10 µM) and rolipram (10, 50 µM), the number of cells was measured.
3.5. Effects of PDE inhibitors and siRNA on cell invasion
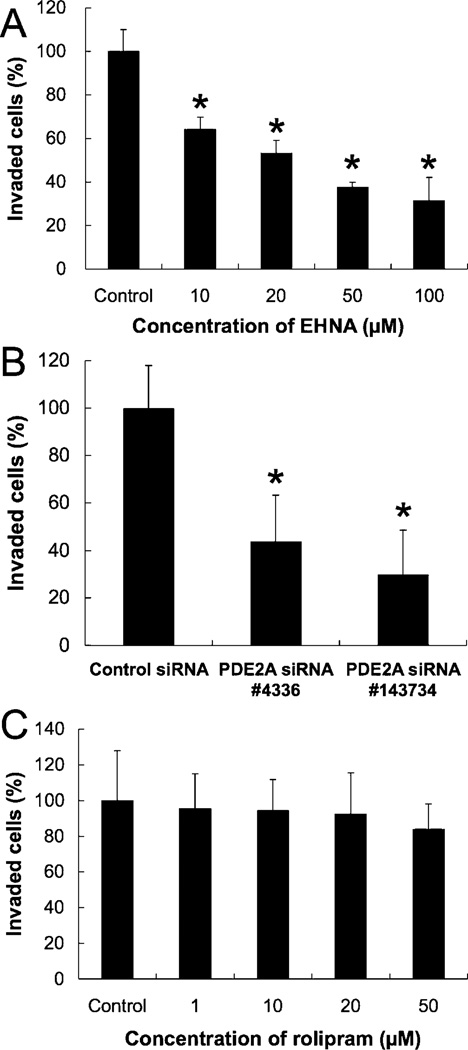
The effects of specific inhibitors of PDE2 and PDE4, as well as PDE2A siRNA, on cell invasion were examined. EHNA suppressed cell invasion in a dose-dependent manner (Fig. 6A). In addition, PDE2A siRNA transfection suppressed cell invasion. When compared to control siRNA transfection, the number of invading cells for the two types of PDE2A siRNA was significantly lower (44% and 30%, Fig. 6B). However, rolipram (50 µM) had no significant effects on cell invasion (Fig. 6C). These results show that PDE2 A inhibition suppresses PMP cell invasion, but PDE4 is not involved with cell invasion.
Fig. 6.
Effects of EHNA, rolipram, or PDE2A siRNA transfection on cell invasion. Data in graphs are means of three independent experiments, each performed in triplicate. (A) Effect of EHNA on cell invasion examined by in vitro Matrigel invasion assays. The error bars represent means ± SD, n = 3. The treatments that differ significantly from control are noted (*, P < 0.01). (B) Effect of PDE2A siRNA on cell invasion. Cells were transfected with 5 nM siRNA, and cell invasion was examined after 2 days. The error bars represent means ± SD, n = 3. A significant treatment effect is noted (*, P < 0.01 compared with control siRNA treatment). (C) Effect of rolipram on cell invasion. The error bars represent means ± SD, n = 3.
3.6 Effects of PDE inhibitors on intracellular cAMP concentrations
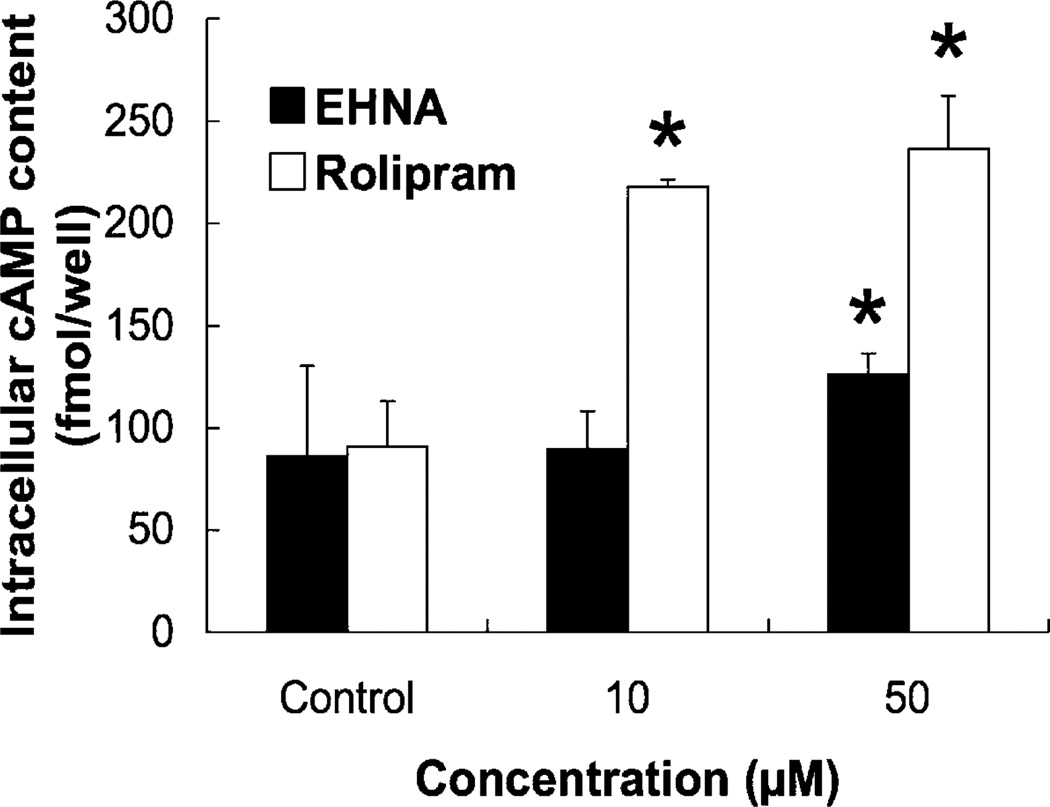
Although 8-Br-cAMP suppressed PMP cell growth and invasion, rolipram did not. Therefore, in order to verify the efficacy of rolipram, intracellular cAMP content was measured after treating cells with EHNA or rolipram. After 15 min, intracellular cAMP concentrations were significantly increased by 50 µM EHNA or rolipram at 10 and 50 µM. With rolipram, the increase was about 2.4-fold with 10 µM and 2.6-fold with 50 µM (Fig. 7). These results suggest that although rolipram suppresses PDE4 and increases intracellular cAMP, the cAMP “pool” controlled by EHNA/PDE2, not PDE4, seems to be important in regulation of growth and invasion of PMP cells.
Fig. 7.
Effect of EHNA and rolipram on intracellular cAMP content. PMP cells were incubated with medium containing EHNA (10 and 50 µM) or rolipram (10 and 50 µM) for 15 min, and intracellular cAMP content was determined using the enzyme immunoassay kit. Data are means of three independent experiments, each performed in triplicate. The error bars represent means ± SD, n = 3. A significant treatment effect is noted (*, P < 0.01 compared with control).
3.7. Effect of mRFP-tagged dnPDE2A on cell growth and invasion
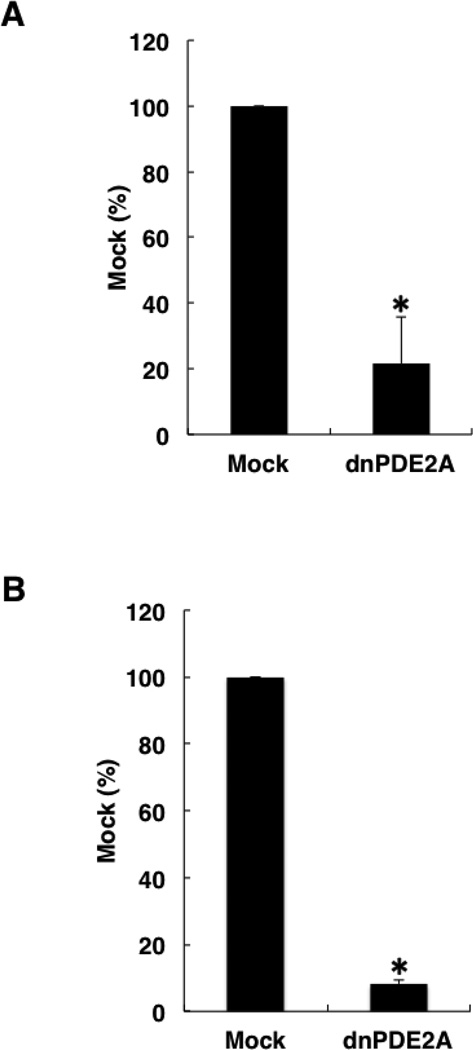
To recapitulate the effect of PDE2 siRNAs, we examined the effect of mRFP-tagged dnPDE2A on cell growth and invasion (Fig. 8). mRFP-tagged dnPDE2A, which is catalytically inactive, decreased the growth and invasion of PMP cells.
Fig. 8.
Effects of mRFP-tagged dnPDE2A (catalytically dead mutant) on cell growth and invasion. Data in graphs are means of three independent experiments, each performed in triplicate. (A) Effects of mRFP-tagged dnPDE2A on cell growth. Cells were transfected with mRFP-tagged dnPDE2A, and, after 48 h, plated at 400 cells/well in a 96-well plate. The error bars represent means ± SD, n = 3. A significant treatment effect is noted (*, P < 0.01 compared with Mock treatment). (B) Effects of mRFP-tagged dnPDE2A on cell invasion. Cells were transfected with mRFP-tagged dnPDE2A, and cell invasion was examined after 16 h. The error bars represent means ± SD, n = 3. A significant treatment effect is noted (*, P < 0.01 compared with mock treatment).
3.8. Immunocytochemistry of PDE2A
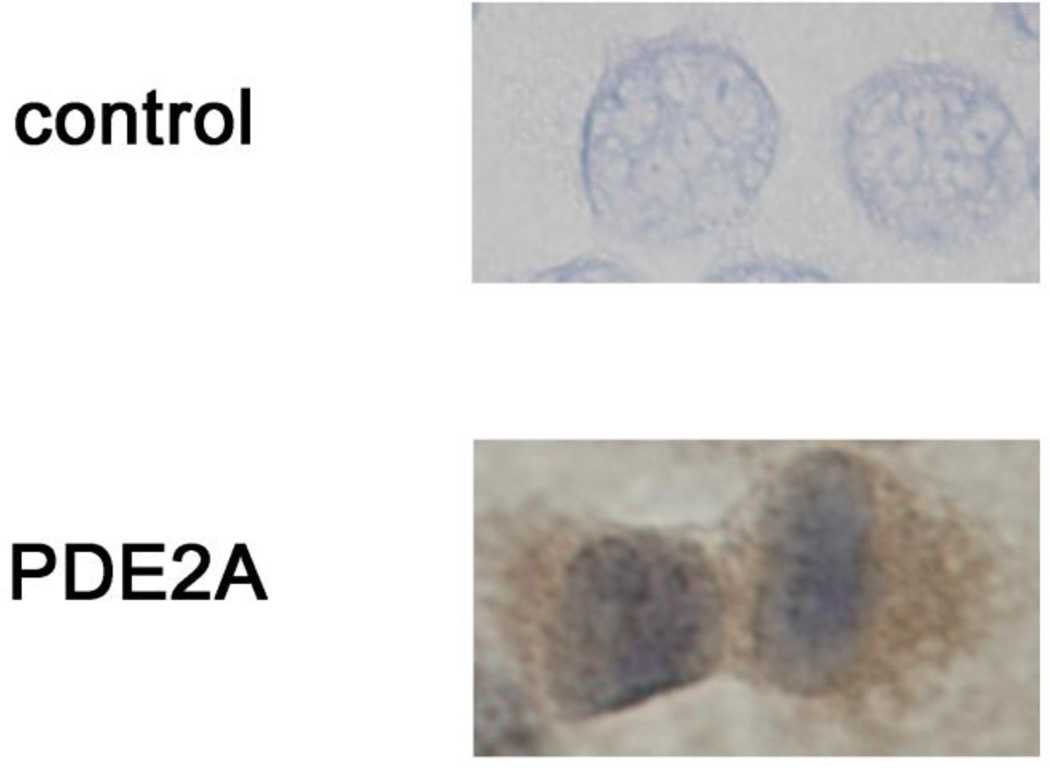
To confirm the location of PDE2A in PMP cells, we carried out immunocytochemistry (Fig. 9). The cytoplasm was stained by PDE2A antibody, suggested that PDE2A was not located in a specific region of PMP cells.
Fig. 9.
Immunocytochemistry of PDE2A. Immunocytochemistry was performed as described in Material and methods. Experiments were repeated two times, and similar results were obtained.
3.9. Effects of agents which regulate PKA and activate Epac on cell growth
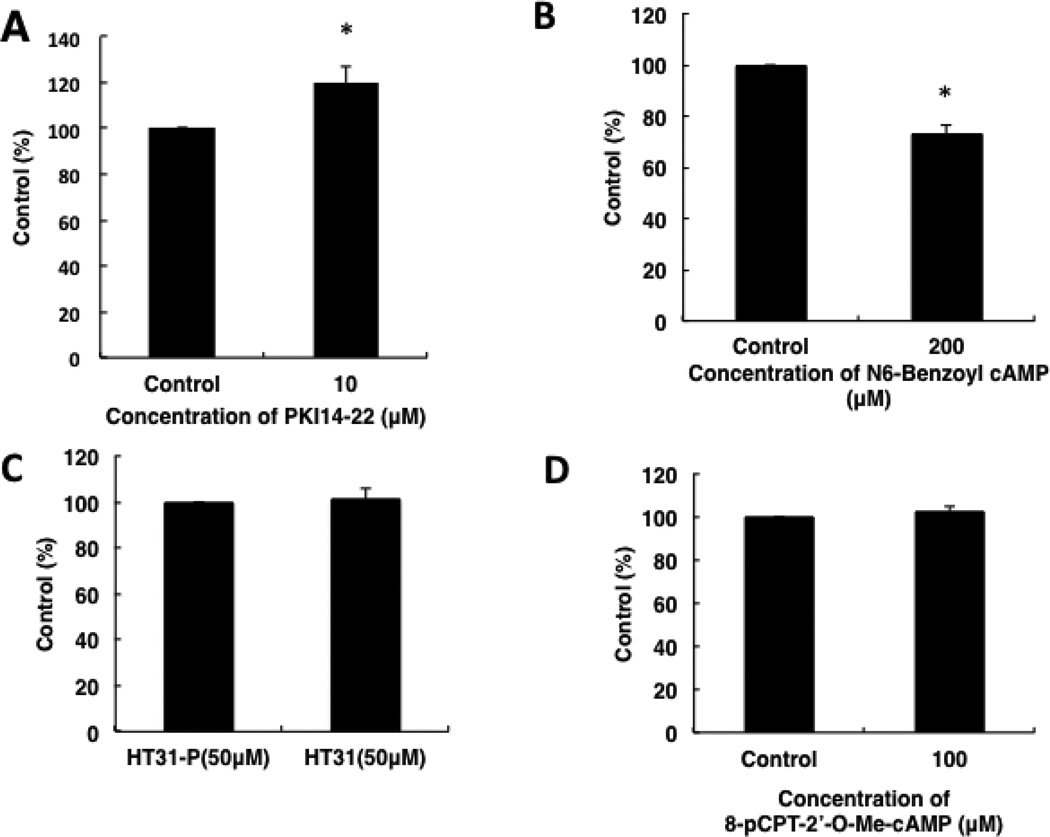
The effects of PKA-related reagents and a cAMP analogue which stimulated Epac were investigated. The PKA inhibitor PKI14–22 increased cell growth (Fig. 10A), but the cAMP analogue N6-Benzoyl-cAMP, which specifically activates PKA, decresed cell growth (Fig. 10B). However, InCELLect™ AKAP St-Ht31 Inhibitor Peptide (Promega, Madison, Wl) and 8-pCPT-2’-O-Me-cAMP, a cAMP analogue which activates Epac, had no significant effects on cell growth (Fig. 10C, 10D).
Fig. 10.
Effects of PKA related reagents and 8-pCPT-2’-O-Me-cAMP on cell growth. Cells were cultured in each reagent for 5 days. Cell growth was analyzed by MTS assay. (A) Effect of PKI14–22 on cell growth. (B) Effect of N6-Benzoyl-cAMP on cell growth. (C) Effect of HT-31 on cell growth. (D) Effect of 8-pCPT-2’-O-Me-cAMP on cell growth. Data in graphs are means of three independent experiments, each performed in triplicate. The error bars represent means ± SD, n = 3. The treatments that differ significantly from control are noted (*, P < 0.01).
3.10. Effects of agents which regulate PKA and activate Epac on cell invasion
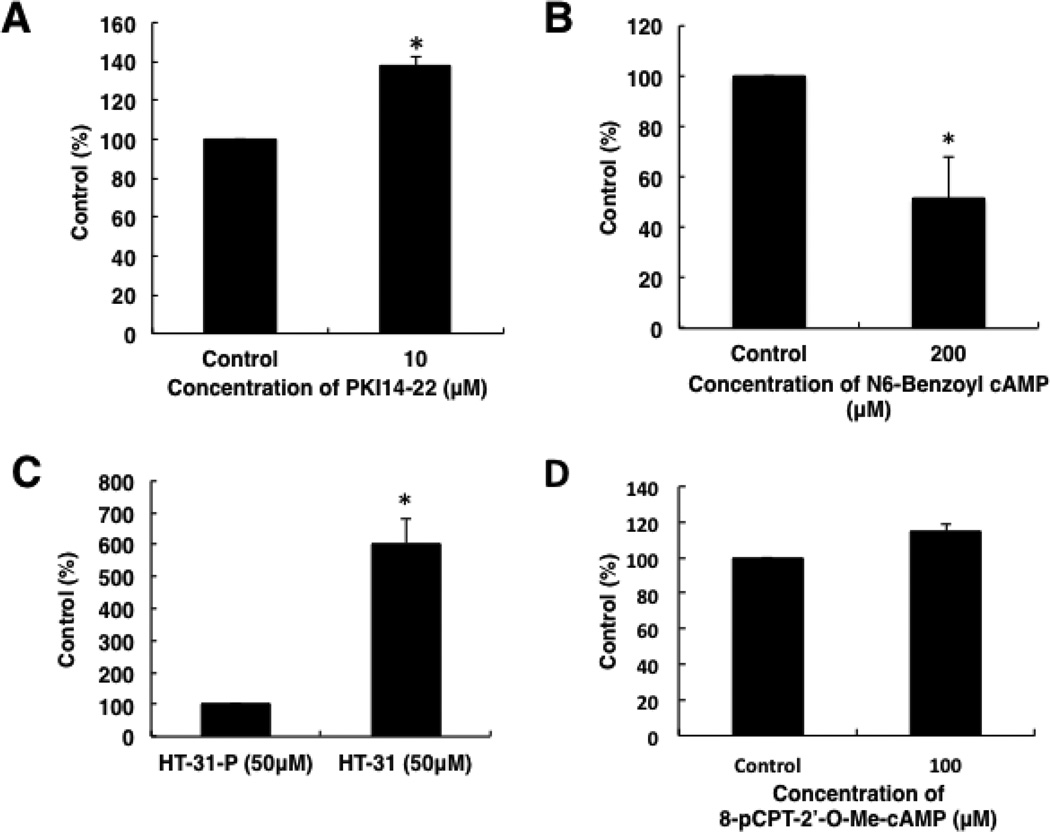
The effects of PKA related reagents and a cAMP analogue which activates Epac were investigated. The PKA inhibitor PKI14–22 increased cell invasion (Fig. 11A), but the cAMP analogue N6-Benzoyl-cAMP, which specifically activates PKA, decreased cell invasion (Fig. 11B). InCELLect™ AKAP St-Ht31 Inhibitor Peptide (Promega) increased cell invasion (Fig. 11C). However, the cAMP analogue 8-pCPT-2’-O-Me-cAMP, which activated Epac, had no significant effects on cell invasion (Fig. 11D).
Fig. 11.
Effects of PKA related reagents and 8-pCPT-2’-O-Me-cAMP on cell invasion. Cell invasion was examined by in vitro Matrigel invasion assays. Cells were transferred to 8 µm pore Matrigel pre-coated inserts, and each reagents was added. After a 16 h incubation, invaded cells were stained with Diff-Quik™ and counted. Data in graphs are means of three independent experiments, each performed in triplicate. (A) Effect of PKI14–22 on cell invasion. (B) Effect of N6-Benzoyl-cAMP on cell invasion. (C) Effect of HT-31 on cell invasion. (D) Effect of 8-pCPT-2’-O-Me-cAMP on cell invasion. The error bars represent means ± SD, n = 3. The treatments that differ significantly from control are noted (*, P < 0.01).
4. Discussion
Both cell growth and invasion play important roles in the progression of cancer, and new anticancer therapies that block them are required. First, we investigated the effects of cAMP and cGMP on growth and invasion of human malignant melanoma PMP cells. When PMP cells were treated with a cAMP analog, growth and invasion were suppressed. Although there was some degree of crosstalk between cGMP and cAMP, a cGMP derivative had no marked effects on cell growth and invasion. Of the various PDEs that regulate the intracellular concentrations of cAMP and cGMP, studies have shown that a PDE4-specific inhibitor hinders the growth of murine melanoma cells, human mammary carcinoma cells [31], and osteosarcoma cells [32], while a PDE3-specific inhibitor (cilostamide) hinders the growth of human neoplastic submandibular gland cells [33] and squamous cell carcinoma cells [34]. Since PDE2 and PDE4, but not PDE3, are relatively highly expressed in PMP cells, their role in growth and invasion of PMP cells were investigated.
Specific inhibitors of different PDE isozymes have allowed researchers to study the expression and function of different isozymes in cells. Growth and invasion of PMP cells were suppressed by EHNA, a PDE2-specific inhibitor. Although PDE2A, and not other PDE families, is selectively inhibited by EHNA with an IC50 value of 1 µM [9], EHNA also inhibits adenosine deaminase (ADA, [Ki] = 7 nM) [35]. Therefore, it is difficult to be certain if effects of EHNA in intact cells are related to inhibition of PDE2 or ADA. Although ADA has been considered a marker of malignancy, and decreased ADA activity has been found in several carcinomas, recent data suggest that the correlation with cancer progression is not absolute [36]. Furthermore, 10 µM EHNA did not increase cAMP content in PMP cells. Therefore, studies using only EHNA cannot demonstrate the function of PDE2. For this reason, the present study examined the effects of EHNA, PDE2A siRNA and calalytically-dead mutant of PDE2A. The function of target genes can be clarified by hindering specific gene expression using siRNA. In the present study, PDE2A siRNA and calalytically-dead mutant were used to block PDE2, and the results showed that PMP cell growth and invasion were suppressed. On the other hand, rolipram, a PDE4-specific inhibitor, did not affect cell growth or invasion. This suggests that PMP cell growth and invasion were suppressed via cAMP-PDE signals involving PDE2.
cAMP can induce cell growth arrest by blocking the cell cycle of non-neoplastic and neoplastic cells [11]. Various studies have been conducted on the suppressive effects of cAMP on tumor cell growth [37,38]. It has been shown that cAMP can inhibit the expression of growth-associated genes such as c-myc and the transferin receptor gene [39,40], and can induce negative growth regulator genes such as the transforming growth factor β2 gene [41]. However, previous studies on the relationship between PDE2 and tumor cell growth have only shown that a high level of EHNA (50 µM) suppressed the growth of colon cancer cells [42].
Furthermore, studies have reported that tumor cell invasion is suppressed by an increase in intracellular cAMP [19–21,25]. However, the mechanism has remained unclear. It has been reported that an increase in intracellular cAMP induces the expression of tissue inhibitors of metalloproteinases (TIMPs) in human fibrosarcoma cells [43], but not in human malignant glioma cells. To the best of our knowledge, there have been no studies investigating the relationship between invasion and PDEs, and the present study is the first to report that cancer cell invasion is suppressed by the selective inhibition of PDE2.
Although rolipram increases accumulation of cAMP, it has little or no effect on inhibition of cell growth and invasion, suggesting that PDE2 and PDE4 regulate different intracellular pools of cAMP, and that the cAMP-signaling microdomain(s) regulated by PDE2, not PDE4, is intimately involved in growth and invasion of PMP cells. By immunocytochemistry of PDE2A, it was suggested that PDE2A localized in cytoplasm. Furthermore, reagents which directly regulated PKA affected growth and invasion in PMP cells. It would be of interest to study the subcellular localization of PDE2 and its interacting partners within this microdomain(s).
The role of PDE2 in malignant tumor cells has received little attention. The present study is the first to use specific inhibitors, siRNA, and a dominant negative PDE2A mutant to demonstrate that PDE2 is involved in growth and invasion of human malignant melanoma PMP cells. By selectively suppressing PDE2, it may be possible to suppress the growth and invasion of other melanoma and malignant tumor cell lines. Further investigations of these mechanisms are warranted.
5. Conclusion
We have reported that PDE2 appears to play an important role in the growth and invasion of human malignant melanoma PMP cells.
Highlights.
The role of PDEs, especially PDE2, in malignant tumor cells is still uncertain.
Inhibition of PDE2 reduces cell growth and invasion of PMP cells.
PKA signaling pathways are involved in growth and invasion of PMP cells.
PDE2 serves as a new therapeutic target for malignant melanoma.
Acknowledgements
This work was supported by a Grant-in-Aid for Scientific Research (B) from Japan Society for the Promotion of Science 16390585 (T.T.), a Grant-in-Aid for Scientific Research (B) from Japan Society for the Promotion of Science 18390537 (T.M.) and the Intramural Research Program in National Heart, Lung, and Blood Institute, National Institutes of Health (V.C.M.).
Abbreviations
- cAMP
adenosine 3’,5’-cyclic monophosphate
- cGMP
guanosine 3’,5’-cyclic monophosphate
- dnPDE2A
a catalytically-dead mutant of PDE2
- EHNA
erythro-9-(2-hydroxy-3-nonyl)adenine
- FBS
fetal bovine serum
- MTS
3-(4,5-dimethylthiazol-2-yl)-5-(3-carboxymethoxyphenyl)-2-(4-sulfophenyl)-2 H-tetrazolium
- PBS
phosphate-buffered saline
- PDE
phosphodiesterase
- RT-PCR
reverse transcription-polymerase chain reaction
- siRNA
small interfering RNA
- 8-Br-cAMP
8-bromoadenosine 3’,5’-cyclic monophosphate
- 8-Br-cAMP
8-bromoguanosine 3’,5’-cyclic monophosphate
Footnotes
Publisher's Disclaimer: This is a PDF file of an unedited manuscript that has been accepted for publication. As a service to our customers we are providing this early version of the manuscript. The manuscript will undergo copyediting, typesetting, and review of the resulting proof before it is published in its final citable form. Please note that during the production process errors may be discovered which could affect the content, and all legal disclaimers that apply to the journal pertain.
Conflict of interest
The authors declare that they have no competing interests.
Authors’ contributions
T.M. designed the experiments; K.H., T.M., and K.S. carried out the experiments; K.H., T.M., and K.S. analyzed the data; K.H., T.M., and K.S. wrote the manuscript. All authors have read and commented on the manuscript.
References
- 1.Manganiello VC, Degerman E. Cyclic nucleotide phosphodiesterases (PDEs): diverse regulators of cyclic nucleotide signals and inviting molecular targets for novel therapeutic agents. Thromb. Haemost. 1999;82:407–411. [PubMed] [Google Scholar]
- 2.Lugnier C. Cyclic nucleotide phosphodiesterase (PDE) superfamily: a new target for the development of specific therapeutic agents. Pharmacol. Ther. 2006;109:366–398. doi: 10.1016/j.pharmthera.2005.07.003. [DOI] [PubMed] [Google Scholar]
- 3.Beavo JA, Hardman JG, Sutherland EW. Hydrolysis of cyclic guanosine and adenosine 3’,5’-monophosphates by rat and bovine tissues. J. Biol. Chem. 1970;245:5649–5655. [PubMed] [Google Scholar]
- 4.Martins TJ, Mumby MC, Beavo JA. Purification and characterization of a cyclic GMP-stimulated cyclic nucleotide phosphodiesterase from bovine tissues. J. Biol. Chem. 1982;257:1973–1979. [PubMed] [Google Scholar]
- 5.Yamamoto T, Manganiello VC, Vaughan M. Purification and characterization of cyclic GMP-stimulated cyclic nucleotide phosphodiesterase from calf liver. Effects of divalent cations on activity. J. Biol. Chem. 1983;258:12526–12533. [PubMed] [Google Scholar]
- 6.Murashima S, Tanaka T, Hockman S, Manganiello V. Characterization of particulate cyclic nucleotide phosphodiesterases from bovine brain: purification of a distinct cGMP-stimulated isoenzyme. Biochemistry. 1990;29:5285–5292. doi: 10.1021/bi00474a010. [DOI] [PubMed] [Google Scholar]
- 7.Pyne NJ, Cooper ME, Houslay MD. Identification and characterization of both the cytosolic and particulate forms of cyclic GMP-stimulated cyclic AMP phosphodiesterase from rat liver. Biochem. J. 1986;234:325–334. doi: 10.1042/bj2340325. [DOI] [PMC free article] [PubMed] [Google Scholar]
- 8.Whalin ME, Strada SJ, Thompson WJ. Purification and partial characterization of membrane-associated type II (cGMP-activatable) cyclic nucleotide phosphodiesterase from rabbit brain. Biochim. Biophys. Acta. 1988;972:79–94. doi: 10.1016/0167-4889(88)90105-x. [DOI] [PubMed] [Google Scholar]
- 9.Bender AT, Beavo JA. Cyclic nucleotide phosphodiesterases: molecular regulation to clinical use. Pharmacol. Rev. 2006;58:488–520. doi: 10.1124/pr.58.3.5. [DOI] [PubMed] [Google Scholar]
- 10.Dumont JE, Jauniaux JC, Roger PP. The cyclic AMP-mediated stimulation of cell proliferation. Trends. Biochem. Sci. 1989;14:67–71. doi: 10.1016/0968-0004(89)90046-7. [DOI] [PubMed] [Google Scholar]
- 11.Boynton AL, Whitfield JF. The role of cyclic AMP in cell proliferation: A critical assessment of the Evidence. Adv. Cyclic Nucleotide Res. 1983;15:193–294. [Google Scholar]
- 12.Prasad KN, Sheppard JR. Inhibitors of cyclic-nucleotide phosphodiesterase induce morphological differentiation of mouse neuroblastoma cell culture. Exp. Cell Res. 1972;73:436–440. doi: 10.1016/0014-4827(72)90069-9. [DOI] [PubMed] [Google Scholar]
- 13.Janik P, Assaf A, Bertram JS. Inhibition of growth of primary and metastatic Lewis lung carcinoma cells by the phosphodiesterase inhibitor isobutylmethylxanthine. Cancer Res. 1980;40:1950–1954. [PubMed] [Google Scholar]
- 14.Biddle W, Montagna RA, Leong SS, Horoszewicz J, Gastpar H, Ambrus JL. Antineoplastic effect of the pyrimido-pyrimidine derivative: RA 233. Pathol. Biol. 1984;32:9–13. [PubMed] [Google Scholar]
- 15.Bertram JS, Faletto MB. Requirements for and kinetics of growth arrest of neoplastic cells by confluent 10T1/2 fibroblasts induced by a specific inhibitor of cyclic adenosine 3’:5’-phosphodiesterase. Cancer Res. 1985;45:1946–1952. [PubMed] [Google Scholar]
- 16.Lichtner RB, Goka TJ, Butcher RW, Nicolson GL. Direct effects of the pyrimido-pyrimidine derivative RA 233 (Rapenton) on rat 13762NF mammary tumor cell clones in vitro. Cancer Res. 1987;47:1870–1877. [PubMed] [Google Scholar]
- 17.Lichtner RB, Nicolson GL. The pyrimido-pyrimidine derivatives RA 233 and RX-RA 85 affect growth and cytoskeletal organization of rat mammary adenocarcinoma cells. Eur. J. Cancer Clin. Oncol. 1987;23:1269–1275. doi: 10.1016/0277-5379(87)90107-6. [DOI] [PubMed] [Google Scholar]
- 18.Fontana JA, Miksis G, Miranda DM, Durham JP. Inhibition of human mammary carcinoma cell proliferation by retinoids and intracellular cAMP-elevating compounds. J. Natl. Cancer Inst. 1987;78:1107–1112. [PubMed] [Google Scholar]
- 19.Sheppard JR, Koestler TP, Corwin SP, Buscarino C, Doll J, Lester B, Greig RG, Poste G. Experimental metastasis correlates with cyclic AMP accumulation in B16 melanoma clones. Nature. 1984;308:544–547. doi: 10.1038/308544a0. [DOI] [PubMed] [Google Scholar]
- 20.Hill SE, Rees RC, MacNeil S. A positive association between agonist-induced cyclic AMP production in vitro and metastatic potential in murine B16 melanoma and hamster fibrosarcoma. Clin. Exp. Metastasis. 1990;8:461–474. doi: 10.1007/BF00058156. [DOI] [PubMed] [Google Scholar]
- 21.De Vos H, Verschueren H, Convents A, De Baetselier P, Vauquelin G. Cyclic AMP content and invasive capacity of metastatic variants of the BW-5147 murine T-cell lymphoma. Life. Sci. 1990;46:497–505. doi: 10.1016/0024-3205(90)90005-c. [DOI] [PubMed] [Google Scholar]
- 22.Agarwal KC, Parks RE., Jr Forskolin: a potential antimetastatic agent. Int. J. Cancer. 1983;32:801–804. doi: 10.1002/ijc.2910320622. [DOI] [PubMed] [Google Scholar]
- 23.Iwamoto Y, Reich R, Nemeth G, Yamada Y, Martin GR. Cyclic AMP decreases chemotaxis, invasiveness and lung colonization of H-ras transformed mouse fibroblasts. Clin. Exp. Metastasis. 1993;11:492–501. doi: 10.1007/BF00054940. [DOI] [PubMed] [Google Scholar]
- 24.Ormerod EJ, Hart IR. Different growth responses to agents which elevate cAMP in human melanoma cell lines of high and low experimental metastatic capacity. Clin. Exp. Metastasis. 1989;7:85–95. doi: 10.1007/BF02057183. [DOI] [PubMed] [Google Scholar]
- 25.Chen TC, Hinton DR, Zidovetzki R, Hofman FM. Hofman, Up-regulation of the cAMP/PKA pathway inhibits proliferation, induces differentiation, and leads to apoptosis in malignant gliomas. Lab. Invest. 1998;78:165–174. [PubMed] [Google Scholar]
- 26.Thompson WJ, Piazza GA, Li H, Liu L, Fetter J, Zhu B, Sperl G, Ahnen D, Pamukcu R. Exisulind induction of apoptosis involves guanosine 3’ 5’-cyclic monophosphate phosphodiesterase inhibition protein kinase G activation and attenuated beta-catenin. Cancer Res. 2000;60:3338–3342. [PubMed] [Google Scholar]
- 27.Kamei T, Inui M, Nakamura S, Okumura K, Goto A, Tagawa T. Interferon-gamma and anti-Fas antibody-induced apoptosis in human melanoma cell lines and its relationship to bcl-2 cleavage and bak expression. Melanoma Res. 2003;13:153–159. doi: 10.1097/00008390-200304000-00007. [DOI] [PubMed] [Google Scholar]
- 28.Murata T, Taira M, Manganiello VC. Differential expression of cGMP-inhibited cyclic nucleotide phosphodiesterases in human hepatoma cell lines. FEBS Lett. 1996;390:29–33. doi: 10.1016/0014-5793(96)00410-3. [DOI] [PubMed] [Google Scholar]
- 29.Kenan Y, Murata T, Shakur Y, Degerman E, Manganiello VC. Functions of the N-terminal region of cyclic nucleotide phosphodiesterase 3 (PDE 3) isoforms. J Biol Chem. 2000;275:79–83. doi: 10.1074/jbc.275.16.12331. [DOI] [PubMed] [Google Scholar]
- 30.Stangherlin A, Gesellchen F, Zoccarato A, Terrin A, Fields LA, Berrera M, Surdo NC, Craig MA, Smith G, Hamilton G, Zaccolo M. cGMP signals modulate cAMP levels in a compartment-specific manner to regulate catecholamine-dependent signaling in cardiac myocytes. Circ Res. 2011;108:929–939. doi: 10.1161/CIRCRESAHA.110.230698. [DOI] [PMC free article] [PubMed] [Google Scholar]
- 31.Drees M, Zimmermann R, Eisenbrand G. 3’,5’-Cyclic nucleotide phosphodiesterase in tumor cells as potential target for tumor growth inhibition. Cancer Res. 1993;53:3058–3061. [PubMed] [Google Scholar]
- 32.Narita M, Murata T, Shimizu K, Sugiyama T, Nakagawa T, Manganiello VC, Tagawa T. Phosphodiesterase 4 in osteoblastic osteosarcoma cells as a potential target for growth inhibition. Anticancer Drugs. 2003;14:377–381. doi: 10.1097/00001813-200306000-00009. [DOI] [PubMed] [Google Scholar]
- 33.Murata T, Sugatani T, Shimizu K, Manganiello VC, Tagawa T. Phosphodiesterase 3 as a potential target for therapy of malignant tumors in the submandibular gland. Anticancer Drugs. 2001;12:79–83. doi: 10.1097/00001813-200101000-00011. [DOI] [PubMed] [Google Scholar]
- 34.Shimizu K, Murata T, Okumura K, Manganiello VC, Tagawa T. Expression and role of phosphodiesterase 3 in human squamous cell carcinoma KB cells. Anticancer Drugs. 2002;13:875–880. doi: 10.1097/00001813-200209000-00014. [DOI] [PubMed] [Google Scholar]
- 35.Cristalli G, Eleuteri A, Volpini R, Vittori S, Camaioni E, Lupidi G. Adenosine deaminase inhibitors: synthesis and structure-activity relationships of 2-hydroxy-3-nonyl derivatives of azoles. J. Med. Chem. 1994;37:201–205. doi: 10.1021/jm00027a026. [DOI] [PubMed] [Google Scholar]
- 36.Spychala J. Tumor-promoting functions of adenosine. Pharmacol. Ther. 2000;87:161–173. doi: 10.1016/s0163-7258(00)00053-x. [DOI] [PubMed] [Google Scholar]
- 37.Cho-Chung YS. Role of cyclic AMP receptor proteins in growth, differentiation, and suppression of malignancy: new approaches to therapy. Cancer Res. 1990;50:7093–7100. [PubMed] [Google Scholar]
- 38.Yokozaki H, Tortora G, Pepe S, Maronde E, Genieser HG, Jastorff B, Cho-Chung YS. Unhydrolyzable analogues of adenosine 3’:5’-monophosphate demonstrating growth inhibition and differentiation in human cancer cells. Cancer Res. 1992;52:2504–2508. [PubMed] [Google Scholar]
- 39.Slungaard A, Confer DL, Schubach WH. Rapid transcriptional down-regulation of c-myc expression during cyclic adenosine monophosphate-promoted differentiation of leukemic cells. J. Clin. Invest. 1987;79:1542–1547. doi: 10.1172/JCI112987. [DOI] [PMC free article] [PubMed] [Google Scholar]
- 40.Trepel JB, Colamonici OR, Kelly K, Schwab G, Watt RA, Sausville EA, Jaffe ES, Neckers LM. Transcriptional inactivation of c-myc and the transferrin receptor in dibutyryl cyclic AMP-treated HL-60 cells. Mol. Cell. Biol. 1987;7:2644–2648. doi: 10.1128/mcb.7.7.2644. [DOI] [PMC free article] [PubMed] [Google Scholar]
- 41.Bang YJ, Kim SJ, Danielpour D, O’Reilly MA, Kim KY, Myers CE, Trepel JB. Cyclic AMP induces transforming growth factor beta 2 gene expression and growth arrest in the human androgen-independent prostate carcinoma cell line PC-3. Proc. Natl. Acad. Sci. USA. 1992;89:3556–3560. doi: 10.1073/pnas.89.8.3556. [DOI] [PMC free article] [PubMed] [Google Scholar]
- 42.Murata K, Sudo T, Kameyama M, Fukuoka H, Muka M, Doki Y, Sasaki Y, Ishikawa O, Kimura Y, Imaoka S. Cyclic AMP specific phosphodiesterase activity and colon cancer cell motility. Clin. Exp. Metastasis. 2000;18:599–604. doi: 10.1023/a:1011926116777. [DOI] [PubMed] [Google Scholar]
- 43.Tanaka K, Iwamoto Y, Ito Y, Ishibashi T, Nakabeppu Y, Sekiguchi M, Sugioka Y. Cyclic AMP-regulated synthesis of the tissue inhibitors of metalloproteinases suppresses the invasive potential of the human fibrosarcoma cell line HT1080. Cancer Res. 1995;55:2927–2935. [PubMed] [Google Scholar]


