Abstract
Objective
Solid renal masses are most often incidentally detected at imaging as small (≤ 4 cm), localized lesions. These lesions comprise a wide spectrum of benign and malignant histologies, but are largely treated with surgical resection given the limited ability of imaging to differentiate among them with consistency and high accuracy. Numerous studies have thus examined the ability of CT and MRI techniques to separate benign lesions from malignancies, and predict renal cancer histologic grade and subtype. This article synthesizes the evidence regarding renal mass characterization at CT and MRI, provides diagnostic algorithms for evidence-based practice, and highlights areas of further research needed to drive imaging-based management of renal masses.
Conclusion
Despite extensive study of morphological and quantitative criteria at conventional imaging, no CT or MR imaging techniques can reliably distinguish solid benign tumors such as oncocytoma and lipid-poor angiomyolipoma from malignant renal tumors. Larger studies are required to validate recently developed techniques, such as diffusion weighted imaging. Evidence-based practice includes MRI to assess renal lesions in situations where CT is limited and to help guide management in patients who are considered borderline surgical candidates.
CLINICAL VIGNETTE
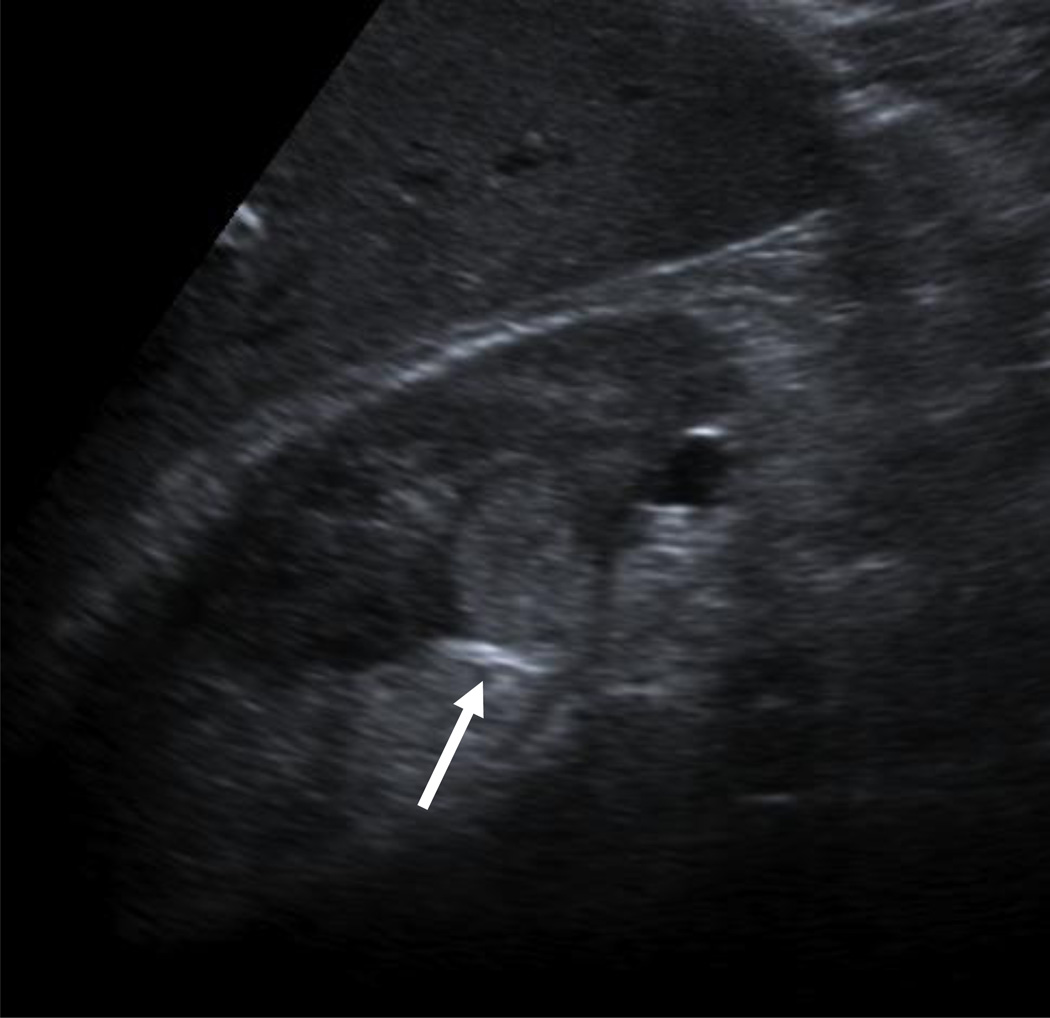
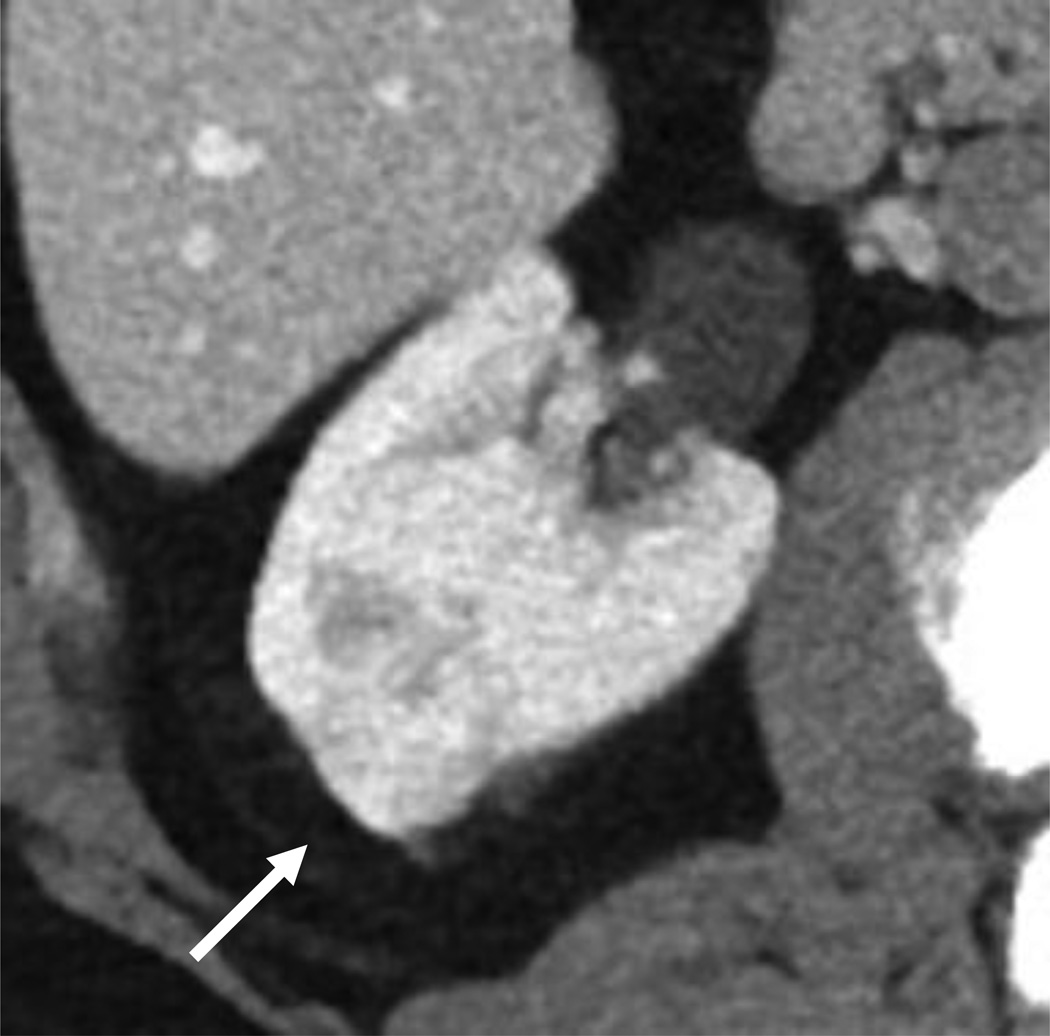
A 65–year-old man presented to his local Emergency Department with vomiting and right upper quadrant pain. The patient had not experienced any symptoms related to urination, fever, or flank pain. He underwent ultrasound examination of the right upper quadrant, which showed cholelithiasis and no findings of cholecystitis. While imaging the right kidney, the sonographer discovered a 2 cm solid right renal mass and notified the radiologist (Fig. 1). The incidental finding prompted further discussion by the Emergency Department physician with the patient regarding relevant history and a recommendation by the radiologist for a CT to further evaluate the renal mass.
Figure 1.
68-year-old man with vomiting and right upper quadrant pain underwent ultrasound.
A, An incidental right upper pole renal mass was demonstrated.
B, CT renal mass protocol confirmed a 2 cm solid, enhancing mass without distant abdominopelvic metastases that was found to represent clear cell RCC at surgical pathology.
The patient confirmed that he had no known history of malignancy, and no symptoms of flank pain or hematuria. Although without severe comorbidities, the patient was taking medications for diabetes and hypertension, and also had a slightly elevated creatinine. The Emergency Department physician recommended that the patient schedule a follow-up appointment with a urologist and undergo CT of the abdomen and pelvis for renal mass evaluation. Several weeks later, the patient arrived at the urologist’s office after completion of a CT renal mass protocol and resolution of the gastrointestinal symptoms.
THE IMAGING QUESTION
Growth in utilization of radiological studies has resulted in increased incidental imaging findings, frequently renal lesions [1, 2]. Most solid renal tumors are incidentally detected as localized lesions less than 4 cm in diameter (stage T1a in the American Joint Committee on Cancer), and most are treated using the current standard of care, nephrectomy, and preferably partial nephrectomy, which has been shown to preserve kidney function and prevent chronic kidney disease [3, 4]. Despite excellent oncologic control with surgical resection, overall survival has not improved in patients with small renal cell carcinoma (RCC). In fact, non-oncologic mortality in affected patients has paradoxically increased in the past two decades, specifically in patients with T1a RCC [5]. In recognition of such trends, there may be increasing need to develop treatment paradigms that better balance oncologic mortality with competing non-oncologic and treatment-related risks.
Currently, the major roles of imaging in renal mass management are in characterizing the detected mass - including differentiation of benign from malignant lesions where possible - and in staging and preoperative planning. Multiphase CT is currently the imaging modality of choice for initial diagnosis, staging and preoperative planning. MRI can be useful in some circumstances to further evaluate a renal mass but what specific information can it provide, and what is the existing evidence for its added value? Furthermore, how can evidence-based practice be implemented to better evaluate renal lesions, and potentially improve patient-centered management?
BACKGROUND
Most renal masses are incidentally detected on imaging performed for unrelated symptoms or indications. Although the majority of these lesions are renal cell carcinoma, most are small (i.e. stage T1a), a substantial portion are benign, and some malignant lesions are indolent [6, 7].
Each of the major imaging modalities offers advantages and drawbacks in renal mass evaluation. Sonography can be helpful in determining the cystic nature of a lesion when a lesion is slightly higher density than fluid on CT. However, its use for characterization is generally hampered by low sensitivity for small lesions, operator dependence, and technical limitations depending on patient body habitus and bowel gas [8, 9]. CT currently plays a key role in preoperative renal mass evaluation, but does not provide accurate discrimination of benign from malignant solid renal lesions in all cases, nor is growth on serial imaging statistically different in benign and malignant lesions [10–12]. As a problem-solving tool, MRI offers diagnostic value in further characterizing some renal masses, and effective utilization may aid management decisions in this generally elderly patient population with competing oncologic and non-oncologic mortality risks. The purpose of this review is threefold: 1) to summarize and synthesize the evidence regarding renal mass characterization at CT and MRI, 2) to provide general diagnostic algorithms for CT and MRI evaluation of small renal masses, and 3) to provide recommendations regarding future directions for imaging research to improve diagnostic utility in renal mass evaluation.
Our discussion will apply to the more common, well-circumscribed small renal cortical tumors and not lesions displaying clearly aggressive, infiltrating growth patterns as typically seen in urothelial tumors.
SYNOPSIS AND SYNTHESIS OF EVIDENCE
SUMMARY OF RCC SUBTYPE PREVALENCE AND PROGNOSIS
Clear cell carcinoma is the most common of all renal cancer subtypes, accounting for approximately 75% of renal cancers, followed by papillary carcinoma (10%), chromophobe (5%), and other unclassified or undifferentiated subtypes [13]. Interestingly, the histologic subtype has also not been shown consistently to be a significant predictor of prognosis for renal cell carcinoma. A large study by Patard and colleagues showed that TNM stage, Fuhrman grade and a clinical performance score, but not histology, were independent prognostic variables for overall survival [14]. A trend of improved prognosis with chromophobe RCC was reported in this study [14], however, and other studies have reported better overall survival in papillary and chromophobe RCC than clear cell RCC [15]. Of note, papillary RCC comprises a heterogeneous subtype of both indolent and also aggressive histologies, and Pignot and colleagues have shown decreased survival in type 2 versus type 1 papillary cancers [16].
Large studies have shown that the papillary subtype predominates in resected masses smaller than 2 cm, while clear cell appears most common in larger tumors [12, 17]. Rothman and colleagues analyzed SEER data of 19,932 localized RCCs, and analyzed the likelihood of each subtype according to size; the incidence of papillary RCC formed a U-shaped curve, where the likelihood decreased with size until lesions reached 10 cm, and then increased in tumors larger than 10 cm [6].
SIGNIFICANCE OF TUMOR SIZE AND GROWTH RATE
Risk of Malignancy and Prognosis by Size of Renal Mass
Among the characteristics of a localized renal mass on initial imaging, tumor size is regarded as the single most important predictor of malignancy, and aggressive histology [7, 17]. Approximately 80% of small renal masses represent cancers, with clear cell carcinoma accounting for the vast majority of malignant lesions [6, 17]. However, benign lesions increase in prevalence as tumor size decreases. Thompson et al examined the proportion of benign lesions according to tumor size in 2,675 surgically removed renal masses, and found benign histology in 56% of lesions 1–2 cm in diameter, decreasing progressively with increasing size to 13% of masses at 6–7 cm [7]. These proportions were similar to values previously reported in a study of 2,770 resected renal masses by Frank et al in 2003 [17]. Furthermore, Frank et al reported significant increased odds of clear cell subtype with increasing size, and both studies showed significant increases in aggressive histologic grade with increasing tumor diameter [7, 17].
Among localized RCC less than 4 cm in size, 85% have been reported to represent low grade tumors, but high grade disease increases with size with an odds ratio increase of 13% per centimeter increase in diameter [6]. In another large study, among all lesions up to 4 cm, a minority of approximately 20–25% showed potentially aggressive features, and approximately 70% of lesions greater than 7 cm also demonstrated low-grade histology [18]. The seemingly disparate finding of a large proportion of tumors greater than 7 cm showing non-aggressive features may be explained partially by selection bias for operative candidates with lesions that may have possessed less inherent aggressive potential (larger but localized tumors that had not developed metastases).
Despite the importance of tumor size in predicting malignancy and higher histologic grades of RCC, the association of renal mass size with survival remains unclear. One large study from a single-institution reported tumor size to be significantly associated with metastasis-free survival when tumors of all sizes were included [19]. In a contradictory study, the size of a small renal mass at presentation was not found to be an independent prognostic factor in survival or metastatic disease [20]. In terms of metastatic disease rates, a large retrospective study by Pahernik et al reported metastatic rates varying from 2–7% in lesions less than 3 cm [12, 20], while Thompson et al reported de novo metastases in less than 1% in the same size group [19]. Furthermore, RCC measuring 4 cm have been reported to present with synchronous metastases in up to 6% of cases, and advanced stage (pT3) in 12% of cases [12, 21]. The disagreement among these large studies is likely at least partially attributable to degrees of selection bias for patients who are operative candidates, with underrepresentation of patients who present with metastatic disease or are observed without surgical management. In a meta-analysis of observed enhancing renal masses, the metastatic disease rate was lower (1%) in lesions less than 3 cm [10], which may reflect selection for a more indolent cohort of lesions allowed to remain on imaging surveillance.
Overall, the size of a tumor at initial imaging presentation has been shown to be predictive of malignancy and aggressive histology, with weaker evidence for association with overall survival.
Renal Mass Growth Rate Prediction and Significance
The growth rate of small renal masses followed with imaging surveillance has been reported as approximately 0.3 cm [10, 18, 22]. In a single series of surgically resected lesions with preoperative serial imaging, the lesion size at presentation did not predict growth rate or histologic grade [22]. Meta-analyses of active surveillance have also reported that initial mean tumor diameter did not differ significantly between positive growth and zero growth masses, and that rates of malignancy were comparable between lesions showing positive and zero growth; however, no metastases developed in masses with zero growth [10, 18]. One of these meta-analyses reported that the subgroup of RCCs that were treated had a slightly greater growth rate of 0.4 cm per year, compared to the mean of 0.3 cm [10], and bias in these studies for resection of growing lesions limits definitive correlation of growth rate with likelihood of malignancy and histologic grade, as not all followed lesions were resected, and the mean follow-up period was generally in the range of three years. Therefore, the growth rate of a small renal mass on serial imaging has not been shown to provide reliable prediction of malignancy or benignity but growing lesions are more likely to be treated during watchful waiting.
CT ASSESSMENT OF RENAL MASSES
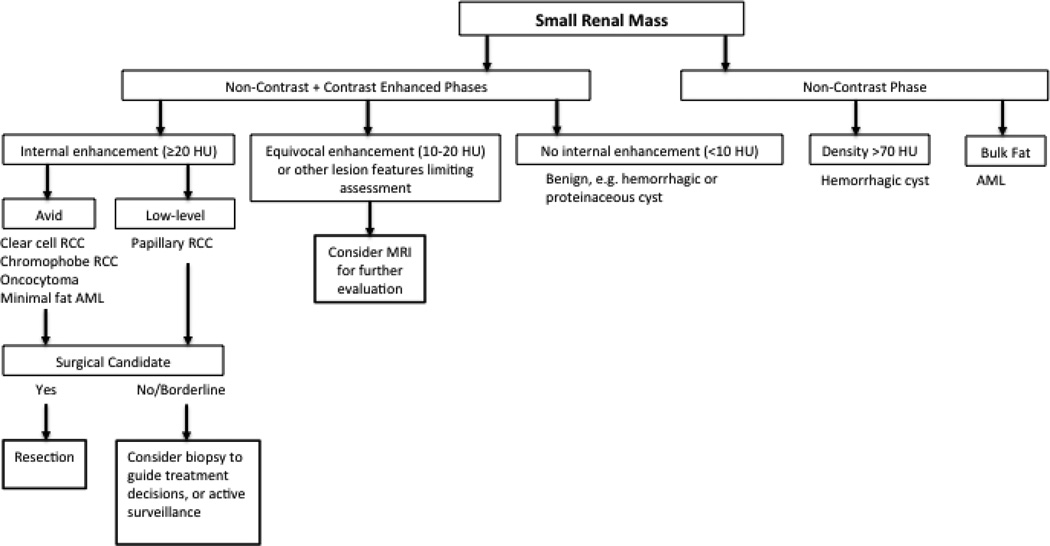
The renal mass protocol, when performed with CT, varies by institution, but standard imaging includes a non-contrast phase followed by contrast-enhanced images in the nephrographic phase at approximately 90 seconds after contrast injection. The American College of Radiology (ACR) provides CT as the “most important technique for evaluating the indeterminate renal mass”, but recognizes both CT and MRI as appropriate initial studies with comparable performance in identifying surgical lesions [23]. The nephrographic phase serves best for detection of a renal mass, and also suffices for detection of enhancing components. The corticomedullary (arterial) and urographic (excretory) phases are also often acquired to provide additional anatomic information for pre-surgical planning and to assess proximity to or involvement of the collecting system. Useful imaging characteristics at CT include the detection of bulk fat, lesion density, and enhancement. However, multiple studies have been performed to assess the performance of enhancement characteristics derived from multiphase imaging in differentiation of renal tumors with limited success [24–28]. A general diagnostic algorithm is presented for CT evaluation – this includes potential circumstances where MRI may provide additional information for management decisions (Fig. 2).
Figure 2.
Diagnostic and management algorithm for small renal mass using CT.
An important consideration for the multiphasic protocol is the increased ionizing radiation exposure to the patient, given recent concerns raised regarding risks of radiation-induced cancers after imaging-related exposures [29–31]. While the true risk of radiation-induced cancers remains unknown, benefits of deriving further diagnostic information should be balanced with the possible risks and consideration of dose reduction techniques, including use of dual-energy CT, and/or patient-centered protocol optimization [32, 33]. Given the median age of 64 years for RCC diagnosis, however, radiation-induced cancer risks in the older patient population are likely minimal relative to other competing mortality risks such as medical comorbidities [34].
Renal Mass Attenuation
Detection of Fat
In general, bulk fat within a solid renal mass detected on CT is a reliable sign of angiomyolipoma. Approximately 5% of angiomyolipomas contain minimal fat, and pose a diagnostic challenge as they currently cannot be reliably distinguished from renal cell carcinoma [35]. Although several studies have reported accurate diagnosis of minimal fat-containing angiomyolipomas using pixel or histogram analyses [36–38], the findings have not been reproducible [39, 40].
Rarely, macroscopic fat may also appear in RCC with osseous metaplasia (usually from the clear cell subtype), cholesterol necrosis, and when a large RCC engulfs perinephric fat [41–43]. In such lesions, calcification within a fat-containing mass should raise suspicion for malignancy [44]. History should also be available to exclude a post-procedural appearance related to prior partial nephrectomy with fat-packing, or prior ablation of a renal mass where the ablation zone evolves to a mass-like appearance of bulk fat [45].
Lesion Density
The attenuation of the renal parenchyma typically ranges from 30 to 40 HU; a hyperattenuating renal mass usually measures between 40 HU to 90 HU on non-contrast CT images [46]. Lesions with homogeneous, unenhanced density of more than 70 Hounsfield units have been reported to represent hemorrhagic cysts more than 99% of the time [47]. Hemorrhagic cysts may also have density less than 70 HU, however, and are best confirmed as non-enhancing lesions with pre and post-contrast-enhanced imaging. A high-density lesion 40–70 HU is most commonly RCC, but the differential diagnosis also includes minimal-fat angiomyolipoma, metanephric adenoma, leiomyoma, oncocytomas, and other mesenchymal and metanephric lesions which overlap in appearance with RCC [48, 49]. Prior studies support consideration of a minimal fat angiomyolipoma when evaluating an enhancing, high attenuation lesion at CT [35, 50, 51]. Still, biopsy remains necessary at this time to determine the diagnosis due to an overlap in appearance with RCC [52].
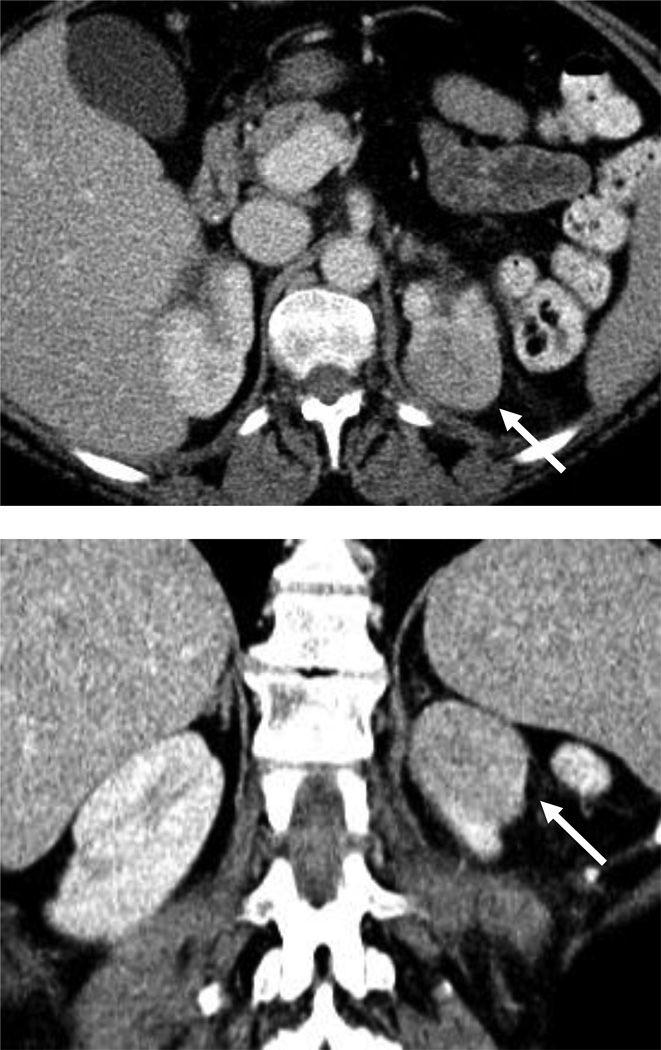
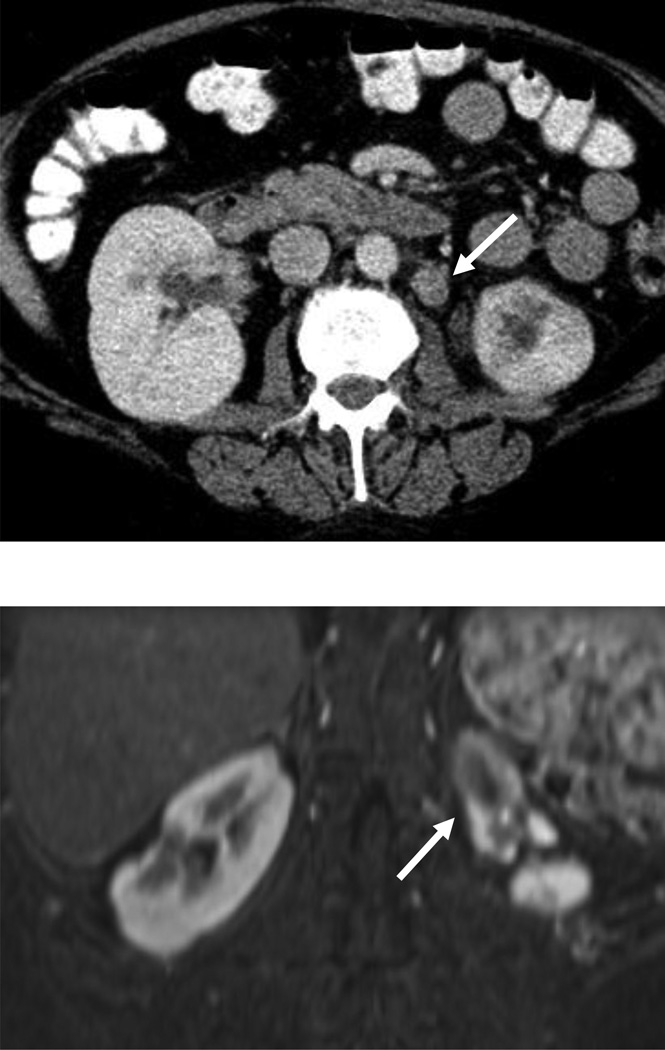
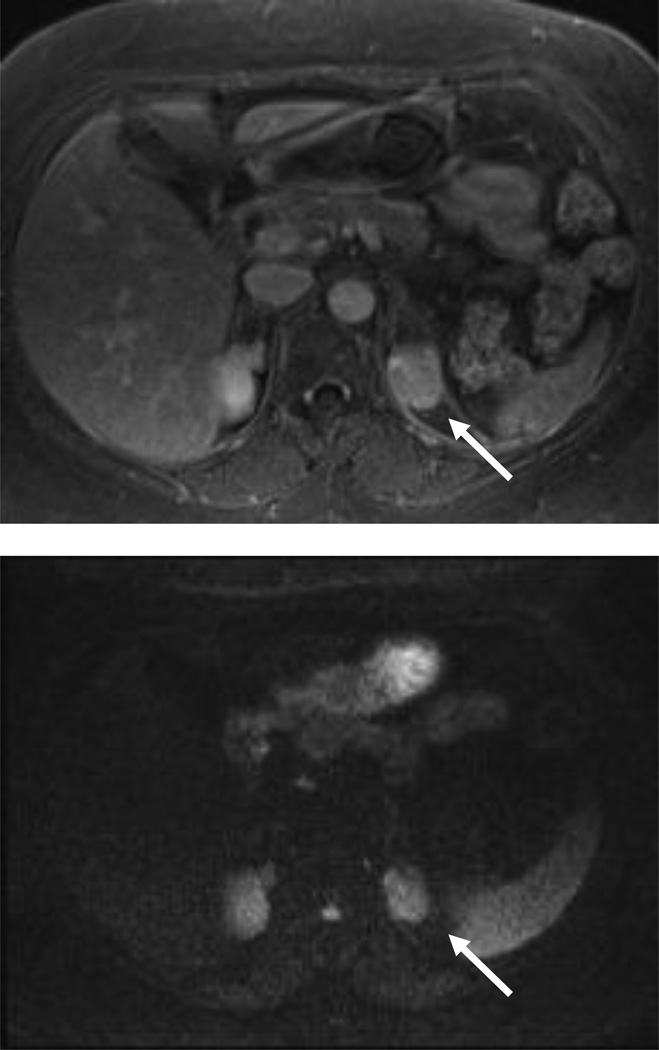
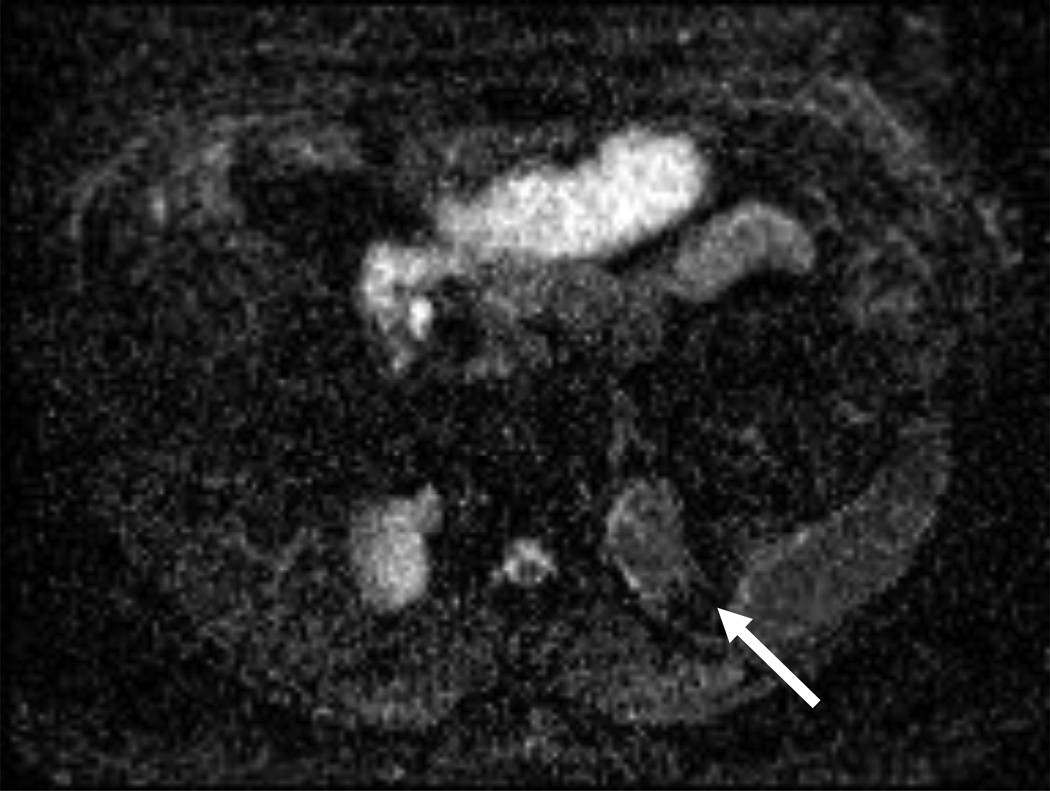
Lesions that appear lower density than the renal parenchyma include renal cystic lesions, focal pyelonephritis, abscess, and papillary RCC; in such cases, where clinical history is not informative or may be confounding, MRI may aid in further differentiating among these benign and malignant diagnoses (Fig. 3).
Figure 3.
54 year-old woman with a left renal mass at CT and clinical diagnosis of pyelonephritis.
A and B, CT with and without contrast shows apparent left upper pole mass with hypoenhancement relative to renal parenchyma. C, Enlarged retroperitoneal lymph nodes are also present.
D and E, Dynamic contrast-enhanced MRI one week later shows slightly smaller lesion, with corticomedullary differentiation internally, and continued hypoenhancement relative to parenchyma in the nephrographic phase.
F and G, Lesion also demonstrates marked restricted diffusion with loss of signal on corresponding ADC map. Focal pyelonephritis was diagnosed and resolved at follow-up MRI.
Qualitative and Quantitative Enhancement
Enhancement is defined as an increase in attenuation by 20 HU or more on contrast-enhanced images compared with non-contrast images because lesser degrees of change in attenuation value may be attributable to pseudo-enhancement [53]. The phenomenon of pseudo-enhancement is known to be significantly associated with central location and also masses less than 1 cm in size, limiting CT assessment in such cases [54]. When the attenuation change falls within 10–20 HU, subtraction imaging at MRI may be useful if available [55].
Perhaps the most clinically relevant imaging challenge for the localized small renal tumor remains distinguishing RCC from benign solid lesions, particularly oncocytomas and minimal-fat angiomyolipomas. Though multiple investigations have examined qualitative and quantitative methods of analyzing enhancement to distinguish RCC from oncocytoma, no enhancement characteristics have been shown to accurately and reproducibly distinguish oncocytoma from RCC (Table 1) [24, 25, 56–58]. Furthermore, the degree of heterogeneity of protocols and study design prevent a meta-analytic approach to synthesize the available published data.
Table 1.
Summary comparison of studies examining differentiation of renal cell carcinoma from oncocytoma
| Authors and Year |
Test | Comparison RCC Subtype |
Imaging Criteria | Reported Results |
Characteristics of Tumors |
|---|---|---|---|---|---|
| Young et al 2013 [24] | CT | Clear cell | Threshold attenuation values in 3 phases |
84% accuracy (81/97) |
All sizes |
| Wildberger et al 1997 [56] | CT | Clear cell | Qualitative features: solid, well-demarcated, central scar, spoke wheel pattern, hypodense after contrast |
12.2% (6/49) observations correct for oncocytoma |
All sizes |
| Bird et al 2011 [57] | CT | All subtypes | Attenuation in 3 phases, % change |
p<0.05, using t-test for RCC v. oncocytoma |
< 4 cm, RCC group: 60% clear cell |
| Davidson et al 1993 [58] | CT | All subtypes | Homogeneous enhancement and central sharply marginated scar |
No difference in small and large tumors, 33% called RCC |
All sizes |
| Zhang et al 2007 [25] | CT | Clear cell | Qualitative features, enhancement in 2 phases |
No difference | All sizes, with small number oncocytoma |
| Cornelias et al 2013 [67] | MRI | Clear cell | Segmental inversion post 5 min delay, and tumor-to-spleen signal intensity ratio |
55% sensitivity, 97% specificity, 86% PPV, 88% NPV |
All sizes |
| Rosenkrantz et al 2010 [66] | MRI | Chromophobe | Qualitative features, segmental inversion post 3 min delay |
10% of chromophobe, oncocyctoma with segmental inversion |
All sizes, most < 4 cm |
| Taouli et al 2009 [68] | MRI | All subtypes (solid tumors only) |
DWI in addition to contrast-enhanced MRI, ADC cutoff of <=1.66 × 10⁻³ mm2/sec (at b values 0, 400, 800) |
90% sensitivity, 83% specificity, AUC 0.854 for solid RCC |
All sizes >= 1 cm |
Some similarities and differences in enhancement peaks and patterns have been reported among oncocytomas and renal cell carcinoma subtypes and are summarized below. In a study of 298 renal tumors of varying size, both clear cell RCC and oncocytomas peaked in the corticomedullary phase [24]. In terms of enhancement pattern, oncocytomas have been reported to demonstrate a “segmental inversion” pattern on enhanced phases [59] but these findings have not been consistently reproducible [60–62]. Furthermore, a central scar is present in the minority of cases [63]. To date, no qualitative imaging features have been shown to reliably diagnose oncocytomas at CT.
Absolute peak attenuation values have also been studied for discrimination RCC from oncocytomas. Young et al found that clear cell RCC was differentiated from oncocytoma with an accuracy of 77%, sensitivity of 86%, and positive predictive value of 85% using attenuation thresholds of 106 HU in the corticomedullary phase, 92 HU in the nephrographic phase, and 68 HU in the excretory phase [24]. The authors’ institution used a four-phase CT protocol, and did not limit the size of the evaluated lesions [24]; given the lack of a standardized protocol across institutions, quantitative use of enhancement should be examined in a larger study to further evaluate the diagnostic value of absolute attenuation changes.
RCC is also not reliably distinguished from minimal fat angiomyolipomas using enhancement characteristics. Angiomyolipomas vary in composition of smooth muscle, vascular and epithelioid elements in addition to being adipose-rich or poor, causing a variable imaging appearance [64]. In several small series, minimal fat angiomyolipomas have been described to demonstrate homogeneous enhancement in addition to hyperdensity relative to renal parenchyma [35, 50, 51]. Although some differences have also been described in enhancement kinetics among RCC subtypes and minimal-fat angiomyolipomas, Yang and colleagues examined the potentially predictive imaging variables, and found that unenhanced high density was the only examined variable that consistently and significantly differentiated minimal fat angiomyolipomas from RCC [52]. Despite the inability to completely exclude RCC with homogeneous enhancement and intrinsic hyperattenuation, minimal fat angiomyolipoma may be important to specify in the differential diagnosis as surveillance and/or biopsy may be under consideration in poor surgical candidates.
Among RCC subtypes, papillary RCC has been shown to demonstrate lesser degrees of enhancement than other subtypes of RCC and in some cases may be mistaken for renal cysts due to low-level enhancement [65]. In a study examining differentiation of the clear cell from papillary subtype, attenuation less than 100 HU in the corticomedullary phase of enhancement was 95.7% specific after normalization for aortic enhancement [28]. Both papillary and chromophobe RCC have been shown to peak in the nephrographic phase, later than clear cell RCC [24]. Qualitatively, papillary RCCs have been reported to demonstrate variable patterns of either homogeneous or heterogeneous enhancement [25–27].
Overall, CT assessment can provide limited information to assess the likelihood of certain RCC subtypes based on the degree of enhancement and inherent density, but, in cases without bulk fat, cannot discriminate benign from malignant tumors. When initial characterization with CT leaves question of presence of enhancing components or a non-tumorous lesion as summarized in the provided diagnostic algorithm (Fig. 2), MRI may offer further problem-solving capability.
MRI ASSESSMENT OF RENAL MASSES
MRI most often complements CT in renal mass characterization, although it may also be utilized as the initial dedicated study for evaluation of a renal mass under current ACR guidelines [23]. Compared with CT, patient-level factors such as ability to tolerate longer scan time and cooperate with breath-holding may lead to more potential variability in diagnostic quality. Just as with CT, the detection of internal enhancing soft tissue is of primary importance. Routinely performed sequences in the MRI protocol for renal mass evaluation include T2 weighted imaging, T1 weighted opposed phase imaging (in-phase and out-of-phase sequences) and fat-suppressed T1 weighted gradient-echo acquisition before and after administration of intravenous gadolinium contrast in corticomedullary, nephrographic and urographic phases of enhancement. Diffusion-weighted imaging can improve diagnostic confidence, and use of apparent diffusion coefficient (ADC) values for discriminating among benign and malignant lesions, and among RCC subtypes, is also under active investigation.
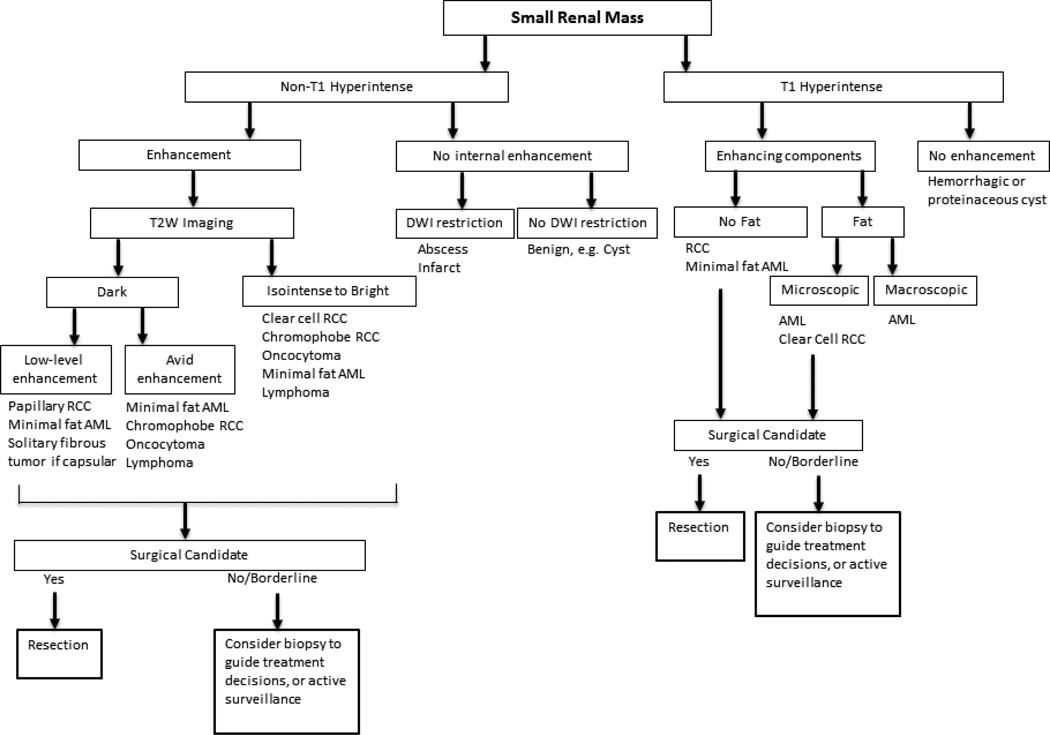
MRI offers problem-solving capability in some scenarios where CT may be limited in identifying enhancing soft tissue, and can provide an accurate diagnosis of a cyst or solid mass through synthesis of signal characteristics and subtraction imaging [55]. In primary lesion assessment, the combination of lesion characteristics across multiple sequences can suggest the differential diagnosis, as presented in a general diagnostic algorithm (Fig. 4). However, just as at CT, MRI cannot yet differentiate benign and malignant tumors aside from classic angiomyolipomas.
Figure 4.
Diagnostic and management algorithm for small renal mass using MRI*
*The provided diagnoses are favored given lesion characteristics, but overlap remains between benign lesions and RCC.
Enhancement
In lesions with intrinsically T1 hyperintense components, subtraction can be helpful to determine presence of enhancement [55]. Enhancement kinetics have also been studied for differentiating tumor types at MRI; just as in CT, clear cell and angiomyolipomas tend to show early enhancement in the corticomedullary phase followed by lower level enhancement in later phases, and low-level, late enhancement is more typical of papillary RCC [24, 65]. Studies examining the differentiation of clear cell and chromophobe RCC from oncocytomas using enhancement characteristics have reported variable results [66–68], but as in studies using CT, small lesions may be less likely to show the reported features that differentiate RCC from oncocytoma (Table 1). The heterogeneity of study design and MRI techniques among these small studies does not support performance of meta-analysis.
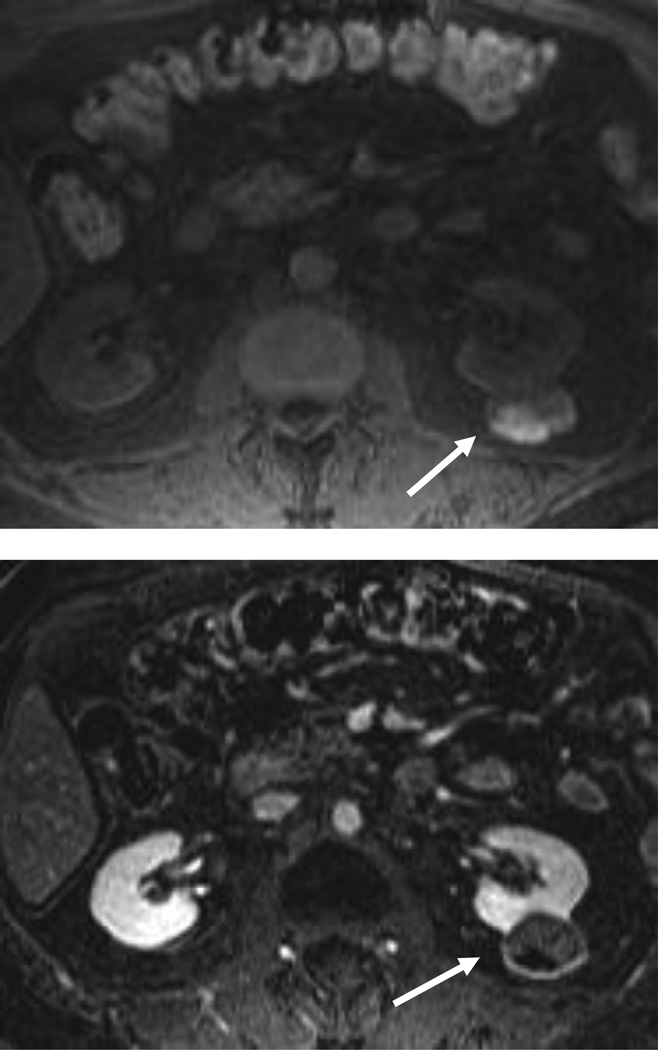
Complex cystic renal lesions and papillary RCC may have a similar appearance at CT, due to hypoattenuation, minimal appreciable heterogeneity and enhancement; more distinctive features at MRI can aid in delineating the tumor types, and specifically identify enhancing tissue (Fig. 5). The distinction may be useful in poor surgical candidates to assess prognostic implications, or to better identify a specific portion of tumor to target in biopsy if pretreatment diagnosis is desired [69–71].
Figure 5.
67 year old man with hypoattenuating left renal mass at CT underwent further evaluation with MRI.
A, CT with and without contrast shows a hypoattenuating left renal mass (25 HU), with borderline enhancement internally.
B, At MRI, coronal HASTE shows lesion to be predominantly T2 dark.
C, Axial T1 weighted imaging demonstrates hyperintense, layering posterior component.
D, MRI subtraction images show anterior enhancing soft tissue and confirms nonenhancing, posteriorly layering hemorrhage. Papillary RCC was diagnosed at surgical pathology.
Noncontrast sequences
T2 Weighted Imaging
T2 signal intensity can be somewhat helpful if it is used in a solid renal mass to assess the likelihood of a papillary RCC or minimal-fat AML due to low T2 signal. T2 hyperintensity is typically seen in clear cell tumors, but is not specific as this characteristic can also be demonstrated in oncocytomas and in a minority of chromophobe carcinomas [66]. Hindman et al examined the ability to distinguish between minimal fat AML (< 25% lipid content at histopathology) and clear cell RCC, and found that low T2 signal was the only imaging feature aside from small size that predicted minimal fat AML [72] in multivariate logistic regression. In another study of clear cell and papillary RCC, low T2 signal was 100% specific in discriminating papillary RCC from the clear cell subtype and thus low T2 signal is not a specific indicator of benign histology [73].
T1 Weighted Imaging
The detection of bulk fat on MRI is accomplished through T1-weighted-imaging with and without fat suppression, or T1 in-phase and out-of-phase imaging using the “india ink” artifact [74]. Microscopic fat detected as loss of signal on out-of-phase imaging cannot be used reliably to discriminate between angiomyolipomas containing minimal fat, since clear cell renal cell carcinomas may also contain microscopic fat [72].
Lesions that are intrinsically T1 hyperintense but show no evidence of fat are most likely hemorrhagic or proteinaceous cysts, and subtraction imaging can be helpful to assess for underlying enhancing components. Among solid lesions, both benign and malignant lesions can demonstrate T1 hyperintensity due to blood products or proteinaceous contents; hemorrhage is seen in RCC (particularly within the clear cell and papillary subtypes), but may also be seen in benign solid neoplasms such as oncocytomas, metanephric tumors or angiomyolipomas [75, 76]. In addition, the presence of hemorrhage or hemosiderin within a mass with enhancing soft tissue is not a distinguishing characteristic among RCC subtypes [66, 73].
Diffusion Weighted Imaging
Diffusion weighted Imaging (DWI) may particularly be helpful in lesion detection and evaluation when gadolinium contrast cannot be administered. It can also aid in differentiating some benign and malignant lesions [77–79]. Visual inspection of DWI images can assist with lesion detection, and for certain lesions reinforce the likelihood of a pseudo-lesion. Although investigators have examined use of apparent diffusion coefficient (ADC) values to predict RCC subtypes and separate benign from malignant histology, use is limited by the fact that that there is substantial inter- and intra-scanner variability in ADC measurement, and ADC values depend upon selected b values that vary across institutions and protocols [79–81]. That said, ADC has been shown to be significantly lower in renal disease (both malignant and non-malignant processes such as infection) than in normal renal parenchyma [82–84]. Small studies have shown the potential value of diffusion-weighted imaging for helping to differentiate between benign and malignant masses [68, 78]. Kim et al [77] also showed improved accuracy with addition of DWI in differentiating benign from malignant T1 hyperintense lesions at non-contrast MRI.
Studies have also examined use of ADC values in discriminating among RCC subtypes. A lower ADC has been reported in the papillary subtype of RCC compared with other subtypes at both 1.5 and 3T [68, 82], while clear cell RCC demonstrated a significantly higher ADC than other subtypes at 3T [82, 84]. ADC has also been found to be significantly lower in high nuclear grade (III and IV) than low nuclear grade (I& II) clear cell tumors at 1.5 T [85], and between grades at 3T [84]. Although the current non-uniformity of techniques for DWI limits routine use of ADC values, findings suggest potential value for improving the clinical performance of MRI and warrant larger, ideally multi-institutional studies with standardized parameters and b values to establish the reliability of ADC values across scanner types.
EVIDENCE-BASED GUIDELINES
Recognizing that management of early-stage renal cancers with uniformly aggressive treatment has not improved patient health outcomes, imagers may offer helpful guidance to patients and referrers through knowledge of how CT, MRI and/or biopsy can best inform decision-making. We offer general guidelines for obtaining MRI as a problem-solving tool for renal mass evaluation with the caveat that the decision requires consideration of patient-level factors in management of renal masses. While CT and MRI offer similar abilities for diagnosis, staging and preoperative anatomic delineation, MRI may offer more sensitive and specific evaluation when the patient cannot receive iodinated contrast, or when the lesion has features limiting assessment at CT: 1) endophytic property, 2) small size (approximately 1 cm), 3) equivocal enhancement, or 4) confluent areas of dense calcification (Fig. 2) [23, 53]. In such cases of low-level or unclear enhancing components, subtraction images at MRI may allow ascertainment of a benign cyst, precluding the need for surgery.
MRI can offer incremental value after CT when patients may not be strong candidates to undergo standard surgical treatment. When a possible diagnosis of minimal fat angiomyolipoma is suggested at CT, supportive findings for the same diagnosis at MRI may prompt biopsy and avoid surgery. Similarly, a mildly complex, questionably enhancing low density lesion at CT may be a predominantly cystic lesion or a papillary RCC, and enhancement and T2 characteristics at MRI may inform the decision to perform biopsy or follow a mass in select patients. For borderline or poor surgical candidates in particular, substantial change in the post-test probability of a benign or indolent lesion may influence pursuit of biopsy, active surveillance, or percutaneous ablative therapy.
Renal mass biopsy was not historically favored by urologists due to perceived risks of tract-seeding, sampling error, inability for pathologic diagnosis in a substantial proportion of cases, and risk of peri-procedural complications such as hemorrhage [86–88]. With improvements in imaging-guided percutaneous techniques and cumulative reported experience in the literature, data support minimal risk of tract seeding, and up to 99% rate of pathologic diagnoses with biopsy [89, 90]. Given these favorable findings and considering the older population in which small renal masses are usually discovered, renal mass biopsy may play an increasingly integral role in the near future if greater emphasis is placed on patient-centered management.
Further advances in immunohistochemical analysis may also support improved management decisions using renal mass biopsy. Historically, distinction of epithelioid angiomyolipoma from sarcomatoid RCC may have been problematic at pathology but current immunohistochemical evaluation makes the diagnosis with high accuracy [91]. The diagnosis of chromophobe carcinoma or oncocytoma remains a challenge at pathology, however, due to overlap in features.
OUTSTANDING ISSUES THAT WARRANT RESEARCH
The radiologic discrimination of benign, indolent and aggressive malignant renal masses remains the diagnostic challenge of high clinical relevance. The current need for tissue-based diagnosis and prevalent treatment pattern of nearly non-discriminatory extirpation encourage key areas for research in imaging evaluation of the small renal mass. These key areas include reliable diagnosis of the most common benign lesions, and ability to predict tumor aggressiveness in malignancies. Positive findings in these areas have been reported in relatively small studies with highly variable imaging techniques, limiting application of the evidence at this time. The incremental value of recently developed quantitative techniques, such as diffusion-weighted imaging including intravoxel incoherent motion, or arterial spin labeling [92, 93], warrant larger studies as morphologic characteristics and quantitative assessment derived from conventional imaging have been well-studied and have not performed reliably in distinguishing benign and malignant tumors. Larger, multi-institutional studies would better establish the performance of CT and MRI and address these questions of high clinical relevance.
Targeted imaging agents may also in the future allow for greater sensitivity and specificity in lesion characterization; one such targeted agent for PET-CT imaging of clear cell RCC has already undergone testing in patients [94]. In the absence of reliable imaging markers of aggressiveness, renal mass biopsy may be further studied as a more frequently utilized guide in treatment selection. In addition to providing histologic subtype, biopsy specimens may in the future allow testing for specific protein expression or genetic mutations, and guide targeted chemotherapy and prognostication more so than the morphology-based Fuhrman grading system.
SUMMARY
Considerable challenges remain in imaging the small renal mass. Given the incidental nature of many lesions, overall indolence of small renal masses, and lack of improved outcomes for this older patient population despite downward stage migration in renal cancer, imaging evaluation may play an increasingly important role for decision-makers in selection of treatment. CT and MRI provide similar assessment of renal masses, but MRI may better depict enhancing components in some circumstances. MRI can also potentially provide incremental value after CT findings when a benign mass or pseudolesion is questioned, or for soft tissue targeting in biopsy for a low attenuation lesion. Larger studies must be conducted to determine the diagnostic performance of newer imaging techniques for predicting benignity and metastatic potential, and thus more definitively establish the role of imaging-based management in shifting renal mass treatment paradigms and improving patient health outcomes.
Acknowledgments
Conflicts of Interest and Sources of Funding:
Stella Kang funded in part by the AUR GE Radiology Research Academic Fellowship. Additional author support in part by Award Number K07CA133097 (P.I.: Pari Pandharipande) from the National Cancer Institute. The research content is solely the responsibility of the authors and does not necessarily represent the official views of the National Cancer Institute or the National Institutes of Health.
References
- 1.Gill IS, Aron M, Gervais DA, Jewett MA. Clinical practice. Small renal mass. N Engl J Med. 2010;362:624–634. doi: 10.1056/NEJMcp0910041. [DOI] [PubMed] [Google Scholar]
- 2.Jayson M, Sanders H. Increased incidence of serendipitously discovered renal cell carcinoma. Urology. 1998;51:203–205. doi: 10.1016/s0090-4295(97)00506-2. [DOI] [PubMed] [Google Scholar]
- 3.Campbell SC, Novick AC, Belldegrun A, et al. Guideline for management of the clinical T1 renal mass. The Journal of urology. 2009;182:1271–1279. doi: 10.1016/j.juro.2009.07.004. [DOI] [PubMed] [Google Scholar]
- 4.Huang WC, Levey AS, Serio AM, et al. Chronic kidney disease after nephrectomy in patients with renal cortical tumours: a retrospective cohort study. The lancet oncology. 2006;7:735–740. doi: 10.1016/S1470-2045(06)70803-8. [DOI] [PMC free article] [PubMed] [Google Scholar]
- 5.Hollingsworth JM, Miller DC, Daignault S, Hollenbeck BK. Rising incidence of small renal masses: a need to reassess treatment effect. Journal of the National Cancer Institute. 2006;98:1331–1334. doi: 10.1093/jnci/djj362. [DOI] [PubMed] [Google Scholar]
- 6.Rothman J, Egleston B, Wong YN, Iffrig K, Lebovitch S, Uzzo RG. Histopathological characteristics of localized renal cell carcinoma correlate with tumor size: a SEER analysis. The Journal of urology. 2009;181:29–33. doi: 10.1016/j.juro.2008.09.009. discussion 33-24. [DOI] [PMC free article] [PubMed] [Google Scholar]
- 7.Thompson RH, Kurta JM, Kaag M, et al. Tumor size is associated with malignant potential in renal cell carcinoma cases. The Journal of urology. 2009;181:2033–2036. doi: 10.1016/j.juro.2009.01.027. [DOI] [PMC free article] [PubMed] [Google Scholar]
- 8.Jamis-Dow CA, Choyke PL, Jennings SB, Linehan WM, Thakore KN, Walther MM. Small (< or = 3-cm) renal masses: detection with CT versus US and pathologic correlation. Radiology. 1996;198:785–788. doi: 10.1148/radiology.198.3.8628872. [DOI] [PubMed] [Google Scholar]
- 9.Hoffmann U, Edwards JM, Carter S, et al. Role of duplex scanning for the detection of atherosclerotic renal artery disease. Kidney international. 1991;39:1232–1239. doi: 10.1038/ki.1991.156. [DOI] [PubMed] [Google Scholar]
- 10.Chawla SN, Crispen PL, Hanlon AL, Greenberg RE, Chen DY, Uzzo RG. The natural history of observed enhancing renal masses: meta-analysis and review of the world literature. The Journal of urology. 2006;175:425–431. doi: 10.1016/S0022-5347(05)00148-5. [DOI] [PubMed] [Google Scholar]
- 11.Kunkle DA, Crispen PL, Chen DY, Greenberg RE, Uzzo RG. Enhancing renal masses with zero net growth during active surveillance. The Journal of urology. 2007;177:849–853. doi: 10.1016/j.juro.2006.10.073. discussion 853-844. [DOI] [PubMed] [Google Scholar]
- 12.Pahernik S, Ziegler S, Roos F, Melchior SW, Thuroff JW. Small renal tumors: correlation of clinical and pathological features with tumor size. The Journal of urology. 2007;178:414–417. doi: 10.1016/j.juro.2007.03.129. discussion 416-417. [DOI] [PubMed] [Google Scholar]
- 13.Reuter VE. The pathology of renal epithelial neoplasms. Seminars in oncology. 2006;33:534–543. doi: 10.1053/j.seminoncol.2006.06.009. [DOI] [PubMed] [Google Scholar]
- 14.Patard JJ, Leray E, Rioux-Leclercq N, et al. Prognostic value of histologic subtypes in renal cell carcinoma: a multicenter experience. Journal of clinical oncology : official journal of the American Society of Clinical Oncology. 2005;23:2763–2771. doi: 10.1200/JCO.2005.07.055. [DOI] [PubMed] [Google Scholar]
- 15.Cheville JC, Lohse CM, Zincke H, Weaver AL, Blute ML. Comparisons of outcome and prognostic features among histologic subtypes of renal cell carcinoma. The American journal of surgical pathology. 2003;27:612–624. doi: 10.1097/00000478-200305000-00005. [DOI] [PubMed] [Google Scholar]
- 16.Pignot G, Elie C, Conquy S, et al. Survival analysis of 130 patients with papillary renal cell carcinoma: Prognostic utility of type 1 and type 2 subclassification. Urology. 2007;69:230–235. doi: 10.1016/j.urology.2006.09.052. [DOI] [PubMed] [Google Scholar]
- 17.Frank I, Blute ML, Cheville JC, Lohse CM, Weaver AL, Zincke H. Solid renal tumors: an analysis of pathological features related to tumor size. The Journal of urology. 2003;170:2217–2220. doi: 10.1097/01.ju.0000095475.12515.5e. [DOI] [PubMed] [Google Scholar]
- 18.Smaldone MC, Kutikov A, Egleston BL, et al. Small renal masses progressing to metastases under active surveillance: a systematic review and pooled analysis. Cancer. 2012;118:997–1006. doi: 10.1002/cncr.26369. [DOI] [PMC free article] [PubMed] [Google Scholar]
- 19.Thompson RH, Hill JR, Babayev Y, et al. Metastatic renal cell carcinoma risk according to tumor size. The Journal of urology. 2009;182:41–45. doi: 10.1016/j.juro.2009.02.128. [DOI] [PMC free article] [PubMed] [Google Scholar]
- 20.Klatte T, Patard JJ, de Martino M, et al. Tumor size does not predict risk of metastatic disease or prognosis of small renal cell carcinomas. The Journal of urology. 2008;179:1719–1726. doi: 10.1016/j.juro.2008.01.018. [DOI] [PubMed] [Google Scholar]
- 21.Nguyen MM, Gill IS. Effect of renal cancer size on the prevalence of metastasis at diagnosis and mortality. The Journal of urology. 2009;181:1020–1027. doi: 10.1016/j.juro.2008.11.023. discussion 1027. [DOI] [PubMed] [Google Scholar]
- 22.Zhang J, Kang SK, Wang L, Touijer A, Hricak H. Distribution of renal tumor growth rates determined by using serial volumetric CT measurements. Radiology. 2009;250:137–144. doi: 10.1148/radiol.2501071712. [DOI] [PubMed] [Google Scholar]
- 23.American College of Radiology. [Accessed December 19];ACR Appropriateness Criteria Indeterminate Renal Masses. Available at: http://www.acr.org/~/media/ACR/Documents/Appcriteria/Diagnostic/IndeterminateRenalMasses.pdf.
- 24.Young JR, Margolis D, Sauk S, Pantuck AJ, Sayre J, Raman SS. Clear cell renal cell carcinoma: discrimination from other renal cell carcinoma subtypes and oncocytoma at multiphasic multidetector CT. Radiology. 2013;267:444–453. doi: 10.1148/radiol.13112617. [DOI] [PubMed] [Google Scholar]
- 25.Zhang J, Lefkowitz RA, Ishill NM, et al. Solid renal cortical tumors: differentiation with CT. Radiology. 2007;244:494–504. doi: 10.1148/radiol.2442060927. [DOI] [PubMed] [Google Scholar]
- 26.Kim JK, Kim TK, Ahn HJ, Kim CS, Kim KR, Cho KS. Differentiation of subtypes of renal cell carcinoma on helical CT scans. AJR American journal of roentgenology. 2002;178:1499–1506. doi: 10.2214/ajr.178.6.1781499. [DOI] [PubMed] [Google Scholar]
- 27.Herts BR, Coll DM, Novick AC, et al. Enhancement characteristics of papillary renal neoplasms revealed on triphasic helical CT of the kidneys. AJR American journal of roentgenology. 2002;178:367–372. doi: 10.2214/ajr.178.2.1780367. [DOI] [PubMed] [Google Scholar]
- 28.Ruppert-Kohlmayr AJ, Uggowitzer M, Meissnitzer T, Ruppert G. Differentiation of renal clear cell carcinoma and renal papillary carcinoma using quantitative CT enhancement parameters. AJR American journal of roentgenology. 2004;183:1387–1391. doi: 10.2214/ajr.183.5.1831387. [DOI] [PubMed] [Google Scholar]
- 29.Smith-Bindman R. Is computed tomography safe? The New England journal of medicine. 2010;363:1–4. doi: 10.1056/NEJMp1002530. [DOI] [PubMed] [Google Scholar]
- 30.Smith-Bindman R, Lipson J, Marcus R, et al. Radiation dose associated with common computed tomography examinations and the associated lifetime attributable risk of cancer. Archives of internal medicine. 2009;169:2078–2086. doi: 10.1001/archinternmed.2009.427. [DOI] [PMC free article] [PubMed] [Google Scholar]
- 31.Brenner DJ, Doll R, Goodhead DT, et al. Cancer risks attributable to low doses of ionizing radiation: assessing what we really know. Proceedings of the National Academy of Sciences of the United States of America. 2003;100:13761–13766. doi: 10.1073/pnas.2235592100. [DOI] [PMC free article] [PubMed] [Google Scholar]
- 32.Prakash P, Kalra MK, Kambadakone AK, et al. Reducing abdominal CT radiation dose with adaptive statistical iterative reconstruction technique. Investigative radiology. 2010;45:202–210. doi: 10.1097/RLI.ob013e3181dzfeec. [DOI] [PubMed] [Google Scholar]
- 33.Graser A, Johnson TR, Hecht EM, et al. Dual-energy CT in patients suspected of having renal masses: can virtual nonenhanced images replace true nonenhanced images? Radiology. 2009;252:433–440. doi: 10.1148/radiol.2522080557. [DOI] [PubMed] [Google Scholar]
- 34.Surveillance Epidemiology and End Results. SEER Public-Use Data, 1975–2003. Bethesda, MD: National Cancer Institute; [Accessed September 25, 2013]. http://www.seer.cancer.gov/csr/1975_2003/, published April 2006. [Google Scholar]
- 35.Jinzaki M, Tanimoto A, Narimatsu Y, et al. Angiomyolipoma: imaging findings in lesions with minimal fat. Radiology. 1997;205:497–502. doi: 10.1148/radiology.205.2.9356635. [DOI] [PubMed] [Google Scholar]
- 36.Simpfendorfer C, Herts BR, Motta-Ramirez GA, et al. Angiomyolipoma with minimal fat on MDCT: can counts of negative-attenuation pixels aid diagnosis? AJR American journal of roentgenology. 2009;192:438–443. doi: 10.2214/AJR.08.1180. [DOI] [PubMed] [Google Scholar]
- 37.Simpson E, Patel U. Diagnosis of angiomyolipoma using computed tomography-region of interest < or =−10 HU or 4 adjacent pixels < or =−10 HU are recommended as the diagnostic thresholds. Clinical radiology. 2006;61:410–416. doi: 10.1016/j.crad.2005.12.013. [DOI] [PubMed] [Google Scholar]
- 38.Kim JY, Kim JK, Kim N, Cho KS. CT histogram analysis: differentiation of angiomyolipoma without visible fat from renal cell carcinoma at CT imaging. Radiology. 2008;246:472–479. doi: 10.1148/radiol.2462061312. [DOI] [PubMed] [Google Scholar]
- 39.Catalano OA, Samir AE, Sahani DV, Hahn PF. Pixel distribution analysis: can it be used to distinguish clear cell carcinomas from angiomyolipomas with minimal fat? Radiology. 2008;247:738–746. doi: 10.1148/radiol.2473070785. [DOI] [PubMed] [Google Scholar]
- 40.Chaudhry HS, Davenport MS, Nieman CM, Ho LM, Neville AM. Histogram analysis of small solid renal masses: differentiating minimal fat angiomyolipoma from renal cell carcinoma. AJR American journal of roentgenology. 2012;198:377–383. doi: 10.2214/AJR.11.6887. [DOI] [PubMed] [Google Scholar]
- 41.Lesavre A, Correas JM, Merran S, Grenier N, Vieillefond A, Helenon O. CT of papillary renal cell carcinomas with cholesterol necrosis mimicking angiomyolipomas. AJR American journal of roentgenology. 2003;181:143–145. doi: 10.2214/ajr.181.1.1810143. [DOI] [PubMed] [Google Scholar]
- 42.Richmond L, Atri M, Sherman C, Sharir S. Renal cell carcinoma containing macroscopic fat on CT mimics an angiomyolipoma due to bone metaplasia without macroscopic calcification. The British journal of radiology. 2010;83:e179–e181. doi: 10.1259/bjr/46452134. [DOI] [PMC free article] [PubMed] [Google Scholar]
- 43.Prando A. Intratumoral fat in a renal cell carcinoma. AJR American journal of roentgenology. 1991;156:871. doi: 10.2214/ajr.156.4.2003462. [DOI] [PubMed] [Google Scholar]
- 44.Silverman SG, Israel GM, Herts BR, Richie JP. Management of the incidental renal mass. Radiology. 2008;249:16–31. doi: 10.1148/radiol.2491070783. [DOI] [PubMed] [Google Scholar]
- 45.Wile GE, Leyendecker JR, Krehbiel KA, Dyer RB, Zagoria RJ. CT and MR imaging after imaging-guided thermal ablation of renal neoplasms. Radiographics : a review publication of the Radiological Society of North America, Inc. 2007;27:325–339. doi: 10.1148/rg.272065083. discussion 339-340. [DOI] [PubMed] [Google Scholar]
- 46.Bosniak MA. The small (less than or equal to 3.0 cm) renal parenchymal tumor: detection, diagnosis, and controversies. Radiology. 1991;179:307–317. doi: 10.1148/radiology.179.2.2014269. [DOI] [PubMed] [Google Scholar]
- 47.Jonisch AI, Rubinowitz AN, Mutalik PG, Israel GM. Can high-attenuation renal cysts be differentiated from renal cell carcinoma at unenhanced CT? Radiology. 2007;243:445–450. doi: 10.1148/radiol.2432060559. [DOI] [PubMed] [Google Scholar]
- 48.Jinzaki M, Tanimoto A, Mukai M, et al. Double-phase helical CT of small renal parenchymal neoplasms: correlation with pathologic findings and tumor angiogenesis. Journal of computer assisted tomography. 2000;24:835–842. doi: 10.1097/00004728-200011000-00002. [DOI] [PubMed] [Google Scholar]
- 49.Fielding JR, Visweswaran A, Silverman SG, Granter SR, Renshaw AA. CT and ultrasound features of metanephric adenoma in adults with pathologic correlation. Journal of computer assisted tomography. 1999;23:441–444. doi: 10.1097/00004728-199905000-00020. [DOI] [PubMed] [Google Scholar]
- 50.Hafron J, Fogarty JD, Hoenig DM, Li M, Berkenblit R, Ghavamian R. Imaging characteristics of minimal fat renal angiomyolipoma with histologic correlations. Urology. 2005;66:1155–1159. doi: 10.1016/j.urology.2005.06.119. [DOI] [PubMed] [Google Scholar]
- 51.Kim JK, Park SY, Shon JH, Cho KS. Angiomyolipoma with minimal fat: differentiation from renal cell carcinoma at biphasic helical CT. Radiology. 2004;230:677–684. doi: 10.1148/radiol.2303030003. [DOI] [PubMed] [Google Scholar]
- 52.Yang CW, Shen SH, Chang YH, et al. Are There Useful CT Features to Differentiate Renal Cell Carcinoma From Lipid-Poor Renal Angiomyolipoma? AJR American journal of roentgenology. 2013;201:1017–1028. doi: 10.2214/AJR.12.10204. [DOI] [PubMed] [Google Scholar]
- 53.Birnbaum BA, Hindman N, Lee J, Babb JS. Renal cyst pseudoenhancement: influence of multidetector CT reconstruction algorithm and scanner type in phantom model. Radiology. 2007;244:767–775. doi: 10.1148/radiol.2443061537. [DOI] [PubMed] [Google Scholar]
- 54.Tappouni R, Kissane J, Sarwani N, Lehman EB. Pseudoenhancement of renal cysts: influence of lesion size, lesion location, slice thickness, and number of MDCT detectors. AJR American journal of roentgenology. 2012;198:133–137. doi: 10.2214/AJR.10.6057. [DOI] [PubMed] [Google Scholar]
- 55.Hecht EM, Israel GM, Krinsky GA, et al. Renal masses: quantitative analysis of enhancement with signal intensity measurements versus qualitative analysis of enhancement with image subtraction for diagnosing malignancy at MR imaging. Radiology. 2004;232:373–378. doi: 10.1148/radiol.2322031209. [DOI] [PubMed] [Google Scholar]
- 56.Wildberger JE, Adam G, Boeckmann W, et al. Computed tomography characterization of renal cell tumors in correlation with histopathology. Investigative radiology. 1997;32:596–601. doi: 10.1097/00004424-199710000-00003. [DOI] [PubMed] [Google Scholar]
- 57.Bird VG, Kanagarajah P, Morillo G, et al. Differentiation of oncocytoma and renal cell carcinoma in small renal masses (<4 cm): the role of 4-phase computerized tomography. World journal of urology. 2011;29:787–792. doi: 10.1007/s00345-010-0586-7. [DOI] [PubMed] [Google Scholar]
- 58.Davidson AJ, Hayes WS, Hartman DS, McCarthy WF, Davis CJ., Jr Renal oncocytoma and carcinoma: failure of differentiation with CT. Radiology. 1993;186:693–696. doi: 10.1148/radiology.186.3.8430176. [DOI] [PubMed] [Google Scholar]
- 59.Kim JI, Cho JY, Moon KC, Lee HJ, Kim SH. Segmental enhancement inversion at biphasic multidetector CT: characteristic finding of small renal oncocytoma. Radiology. 2009;252:441–448. doi: 10.1148/radiol.2522081180. [DOI] [PubMed] [Google Scholar]
- 60.Woo S, Cho JY, Kim SH, Kim SY. Comparison of Segmental Enhancement Inversion on Biphasic MDCT Between Small Renal Oncocytomas and Chromophobe Renal Cell Carcinomas. AJR American journal of roentgenology. 2013;201:598–604. doi: 10.2214/AJR.12.10372. [DOI] [PubMed] [Google Scholar]
- 61.McGahan JP, Lamba R, Fisher J, et al. Is segmental enhancement inversion on enhanced biphasic MDCT a reliable sign for the noninvasive diagnosis of renal oncocytomas? AJR American journal of roentgenology. 2011;197:W674–W679. doi: 10.2214/AJR.11.6463. [DOI] [PubMed] [Google Scholar]
- 62.O'Malley ME, Tran P, Hanbidge A, Rogalla P. Small renal oncocytomas: is segmental enhancement inversion a characteristic finding at biphasic MDCT? AJR American journal of roentgenology. 2012;199:1312–1315. doi: 10.2214/AJR.12.8616. [DOI] [PubMed] [Google Scholar]
- 63.Choudhary S, Rajesh A, Mayer NJ, Mulcahy KA, Haroon A. Renal oncocytoma: CT features cannot reliably distinguish oncocytoma from other renal neoplasms. Clinical radiology. 2009;64:517–522. doi: 10.1016/j.crad.2008.12.011. [DOI] [PubMed] [Google Scholar]
- 64.Lane BR, Aydin H, Danforth TL, et al. Clinical correlates of renal angiomyolipoma subtypes in 209 patients: classic, fat poor, tuberous sclerosis associated and epithelioid. The Journal of urology. 2008;180:836–843. doi: 10.1016/j.juro.2008.05.041. [DOI] [PubMed] [Google Scholar]
- 65.Egbert ND, Caoili EM, Cohan RH, et al. Differentiation of papillary renal cell carcinoma subtypes on CT and MRI. AJR American journal of roentgenology. 2013;201:347–355. doi: 10.2214/AJR.12.9451. [DOI] [PubMed] [Google Scholar]
- 66.Rosenkrantz AB, Hindman N, Fitzgerald EF, Niver BE, Melamed J, Babb JS. MRI features of renal oncocytoma and chromophobe renal cell carcinoma. AJR American journal of roentgenology. 2010;195:W421–W427. doi: 10.2214/AJR.10.4718. [DOI] [PubMed] [Google Scholar]
- 67.Cornelis F, Lasserre AS, Tourdias T, et al. Combined late gadolinium-enhanced and double-echo chemical-shift MRI help to differentiate renal oncocytomas with high central T2 signal intensity from renal cell carcinomas. AJR American journal of roentgenology. 2013;200:830–838. doi: 10.2214/AJR.12.9122. [DOI] [PubMed] [Google Scholar]
- 68.Taouli B, Thakur RK, Mannelli L, et al. Renal lesions: characterization with diffusion-weighted imaging versus contrast-enhanced MR imaging. Radiology. 2009;251:398–407. doi: 10.1148/radiol.2512080880. [DOI] [PubMed] [Google Scholar]
- 69.Bielsa O, Lloreta J, Gelabert-Mas A. Cystic renal cell carcinoma: pathological features, survival and implications for treatment. British journal of urology. 1998;82:16–20. doi: 10.1046/j.1464-410x.1998.00689.x. [DOI] [PubMed] [Google Scholar]
- 70.Han KR, Janzen NK, McWhorter VC, et al. Cystic renal cell carcinoma: biology and clinical behavior. Urologic oncology. 2004;22:410–414. doi: 10.1016/S1078-1439(03)00173-X. [DOI] [PubMed] [Google Scholar]
- 71.Webster WS, Thompson RH, Cheville JC, Lohse CM, Blute ML, Leibovich BC. Surgical resection provides excellent outcomes for patients with cystic clear cell renal cell carcinoma. Urology. 2007;70:900–904. doi: 10.1016/j.urology.2007.05.029. discussion 904. [DOI] [PubMed] [Google Scholar]
- 72.Hindman N, Ngo L, Genega EM, et al. Angiomyolipoma with minimal fat: can it be differentiated from clear cell renal cell carcinoma by using standard MR techniques? Radiology. 2012;265:468–477. doi: 10.1148/radiol.12112087. [DOI] [PMC free article] [PubMed] [Google Scholar]
- 73.Oliva MR, Glickman JN, Zou KH, et al. Renal cell carcinoma: t1 and t2 signal intensity characteristics of papillary and clear cell types correlated with pathology. AJR American journal of roentgenology. 2009;192:1524–1530. doi: 10.2214/AJR.08.1727. [DOI] [PubMed] [Google Scholar]
- 74.Israel GM, Hindman N, Hecht E, Krinsky G. The use of opposed-phase chemical shift MRI in the diagnosis of renal angiomyolipomas. AJR American journal of roentgenology. 2005;184:1868–1872. doi: 10.2214/ajr.184.6.01841868. [DOI] [PubMed] [Google Scholar]
- 75.Storkel S, van den Berg E. Morphological classification of renal cancer. World journal of urology. 1995;13:153–158. doi: 10.1007/BF00184870. [DOI] [PubMed] [Google Scholar]
- 76.Prasad SR, Surabhi VR, Menias CO, Raut AA, Chintapalli KN. Benign renal neoplasms in adults: cross-sectional imaging findings. AJR American journal of roentgenology. 2008;190:158–164. doi: 10.2214/AJR.07.2724. [DOI] [PubMed] [Google Scholar]
- 77.Kim S, Jain M, Harris AB, et al. T1 hyperintense renal lesions: characterization with diffusion-weighted MR imaging versus contrast-enhanced MR imaging. Radiology. 2009;251:796–807. doi: 10.1148/radiol.2513080724. [DOI] [PubMed] [Google Scholar]
- 78.Zhang J, Tehrani YM, Wang L, Ishill NM, Schwartz LH, Hricak H. Renal masses: characterization with diffusion-weighted MR imaging--a preliminary experience. Radiology. 2008;247:458–464. doi: 10.1148/radiol.2472070823. [DOI] [PubMed] [Google Scholar]
- 79.Rosenkrantz AB, Oei M, Babb JS, Niver BE, Taouli B. Diffusion-weighted imaging of the abdomen at 3.0 Tesla: image quality and apparent diffusion coefficient reproducibility compared with 1.5 Tesla. Journal of magnetic resonance imaging : JMRI. 2011;33:128–135. doi: 10.1002/jmri.22395. [DOI] [PubMed] [Google Scholar]
- 80.Dale BM, Braithwaite AC, Boll DT, Merkle EM. Field strength and diffusion encoding technique affect the apparent diffusion coefficient measurements in diffusion-weighted imaging of the abdomen. Investigative radiology. 2010;45:104–108. doi: 10.1097/RLI.0b013e3181c8ceac. [DOI] [PubMed] [Google Scholar]
- 81.Zhang JL, Sigmund EE, Chandarana H, et al. Variability of renal apparent diffusion coefficients: limitations of the monoexponential model for diffusion quantification. Radiology. 2010;254:783–792. doi: 10.1148/radiol.09090891. [DOI] [PMC free article] [PubMed] [Google Scholar]
- 82.Wang H, Cheng L, Zhang X, et al. Renal cell carcinoma: diffusion-weighted MR imaging for subtype differentiation at 3.0 T. Radiology. 2010;257:135–143. doi: 10.1148/radiol.10092396. [DOI] [PubMed] [Google Scholar]
- 83.Cova M, Squillaci E, Stacul F, et al. Diffusion-weighted MRI in the evaluation of renal lesions: preliminary results. The British journal of radiology. 2004;77:851–857. doi: 10.1259/bjr/26525081. [DOI] [PubMed] [Google Scholar]
- 84.Yu X, Lin M, Ouyang H, Zhou C, Zhang H. Application of ADC measurement in characterization of renal cell carcinomas with different pathological types and grades by 3.0T diffusion-weighted MRI. European journal of radiology. 2012;81:3061–3066. doi: 10.1016/j.ejrad.2012.04.028. [DOI] [PubMed] [Google Scholar]
- 85.Rosenkrantz AB, Niver BE, Fitzgerald EF, Babb JS, Chandarana H, Melamed J. Utility of the apparent diffusion coefficient for distinguishing clear cell renal cell carcinoma of low and high nuclear grade. AJR American journal of roentgenology. 2010;195:W344–W351. doi: 10.2214/AJR.10.4688. [DOI] [PubMed] [Google Scholar]
- 86.Slywotzky C, Maya M. Needle tract seeding of transitional cell carcinoma following fine-needle aspiration of a renal mass. Abdominal imaging. 1994;19:174–176. doi: 10.1007/BF00203498. [DOI] [PubMed] [Google Scholar]
- 87.Campbell SC, Novick AC, Herts B, et al. Prospective evaluation of fine needle aspiration of small, solid renal masses: accuracy and morbidity. Urology. 1997;50:25–29. doi: 10.1016/S0090-4295(97)00111-8. [DOI] [PubMed] [Google Scholar]
- 88.Smith EH. Complications of percutaneous abdominal fine-needle biopsy. Review. Radiology. 1991;178:253–258. doi: 10.1148/radiology.178.1.1984314. [DOI] [PubMed] [Google Scholar]
- 89.Volpe A, Mattar K, Finelli A, et al. Contemporary results of percutaneous biopsy of 100 small renal masses: a single center experience. The Journal of urology. 2008;180:2333–2337. doi: 10.1016/j.juro.2008.08.014. [DOI] [PubMed] [Google Scholar]
- 90.Wang R, Wolf JS, Jr, Wood DP, Jr, Higgins EJ, Hafez KS. Accuracy of percutaneous core biopsy in management of small renal masses. Urology. 2009;73:586–590. doi: 10.1016/j.urology.2008.08.519. discussion 590-581. [DOI] [PubMed] [Google Scholar]
- 91.DeLong W, Grignon DJ, Eberwein P, Shum DT, Wyatt JK. Sarcomatoid renal cell carcinoma. An immunohistochemical study of 18 cases. Archives of pathology & laboratory medicine. 1993;117:636–640. [PubMed] [Google Scholar]
- 92.Chandarana H, Kang SK, Wong S, et al. Diffusion-weighted intravoxel incoherent motion imaging of renal tumors with histopathologic correlation. Investigative radiology. 2012;47:688–696. doi: 10.1097/RLI.0b013e31826a0a49. [DOI] [PubMed] [Google Scholar]
- 93.Jones DG, Shrimpton PC. NRPB-SR250: Normalized organ doses for x-ray computed tomography calculated using Monte Carlo techniques. UK: Health Protection Agency; [Accessed August 25, 2013]. http://www.hpa.org.uk/Publications/Radiation/NPRBArchive/NRPBSoftware/ [Google Scholar]
- 94.Divgi CR, Uzzo RG, Gatsonis C, et al. Positron emission tomography/computed tomography identification of clear cell renal cell carcinoma: results from the REDECT trial. Journal of clinical oncology : official journal of the American Society of Clinical Oncology. 2013;31:187–194. doi: 10.1200/JCO.2011.41.2445. [DOI] [PMC free article] [PubMed] [Google Scholar]


