

Abstract
Global climate change and its impact on human life has become one of our era's greatest challenges. Despite the urgency, data science has had little impact on furthering our understanding of our planet in spite of the abundance of climate data. This is a stark contrast from other fields such as advertising or electronic commerce where big data has been a great success story. This discrepancy stems from the complex nature of climate data as well as the scientific questions climate science brings forth. This article introduces a data science audience to the challenges and opportunities to mine large climate datasets, with an emphasis on the nuanced difference between mining climate data and traditional big data approaches. We focus on data, methods, and application challenges that must be addressed in order for big data to fulfill their promise with regard to climate science applications. More importantly, we highlight research showing that solely relying on traditional big data techniques results in dubious findings, and we instead propose a theory-guided data science paradigm that uses scientific theory to constrain both the big data techniques as well as the results-interpretation process to extract accurate insight from large climate data.
Introduction
Over the past few decades, the Internet has democratized the creation, access, and analysis of large datasets. As data continue to grow in size and complexity, new algorithms have been developed to learn from eclectic data sources—algorithms that autonomously identify patterns with minimal human input. These developments have led the field of data science to firmly enter the mainstream. In the midst of data science's democratization, global climate change has quickly become one of our era's most pressing issues. A lot remains to be understood about our planet and the physical processes that govern it to effectively answer questions about global climate change and its societal impacts. It has been proposed that given the abundance of climate data from model simulations, Earth-orbiting satellites, and in situ observations, we may close some of these knowledge gaps by directly learning from these large climate science datasets. However, Earth is a complex dynamical system like none we have studied before. As a result, big data–induced progress within climate science has been slower compared with big data's success in other fields such as biology or advertising. The slow progress has been vexing given that climate science has become one of the most data-rich domains in terms of data volume, velocity, and variety.1
This article discusses some of the major big data challenges researchers face when mining climate data and how being mindful of such intricacies can have a significant impact on a socially relevant and commercially viable domain. We will use examples from existing research in climate and data science to demonstrate and discuss key concepts, with the goal of preparing a new generation of data scientists with the tools and processes for data science to have the highest impact on momentous challenges facing our society due to climate change.
The Climate System: A Data Science Perspective
Climate science is the study of our planet's environment. Our planet is a splendid example of a complex, dynamic system in perpetual motion to balance energy and sustain its habitable environment. Fundamentally, climate science is a field focused on studying large-scale changes in the land, atmosphere, oceans, and cryosphere over long temporal periods (years, decades, centuries), although some consider shorter (weather) time scales such as days or weeks to also be part of studying climate. Figure 1 shows a more complex view of the climate system. The interacting parts of the system range from micrometer-sized particles and aerosols to large-scale changes in the land surface. What is not evident from Figure 1 is a notion of the temporal scales at which these interactions occur. Some interactions might last hours or days—such as the influence of sea surface temperatures on the formation of a hurricane—while other interactions might occur over several years (e.g., ice sheets melting). Thus, not only is it important to know the interacting parts of the system, but we must also understand the spatiotemporal scales at which they interact.
FIG. 1.

Schematic view of the components of the global climate system (bold), their processes and interactions (thin arrows), and some aspects that might change due to global warming (bold arrows). Some of these components have reliable datasets, while others don't. This figure does not show the various temporal time scales at which these processes interact. The multiple spatiotemporal scales at which components of the climate system interact make a data-driven study of climate extremely challenging. Figure from Intergovernmental Panel on Climate Change (IPCC).38
Monitoring these constantly evolving planetary processes is critical for us to understand what drives the above-mentioned interactions and how they might change if the planet continues to warm. The idea is to understand what drives certain planetary processes and then project any changes in these processes if some of the drivers changed (e.g., because of increased greenhouse gas emissions).
On the surface, such predictive modeling and causal inference are common exercises in traditional data science. So why is data science's impact on climate science lagging that of other domains? There are three major factors that have slowed progress. First, the data that climate science uses violate many of the assumptions and practices held in traditional data science. For example, the majority of climate data are organized in a spatiotemporal grid. As such, the data are auto-correlated where regions in spatial or temporal proximity tend to be highly related. Hence, any methods that impose independence assumptions among data points will have limited practicality with such data. Second, the field of data science has historically focused on certain tasks and evaluation metrics2 that are not applicable to some of climate science's biggest needs. Finally, and this is only a matter of time, climate science, its data, and challenges have not been exposed to the broader data science community until recently. However, since the early efforts on this topic,3–7 the body of work has been steadily increasing. These efforts have been boosted by new interdisciplinary centers such as the National Science Foundation (NSF)–funded center on understanding climate change from data at the University of Minnesota8 and the Center for Atmosphere Ocean Science of the Courant Institute of Mathematical Science at New York University and the growing communities of computational sustainability9 and climate informatics.10
In the following sections, we will demonstrate these challenges in more detail. Specifically, we will discuss challenges and opportunities from a data and methods perspective to provide data scientists a complete picture of mining climate datasets.
Data Challenges
It goes without saying that the data are the wind that propels any data science expedition. In fact, exploratory data analysis to understand the data's variability and intricacies is the first step most big data practitioners take before unleashing their arsenal of data mining techniques. This is especially critical in climate science, where data scientists are far removed from the data collection process. Climate data sources span across four diverse sources: in situ, remote sensed, model output, and paleoclimatic.11 Each data source has its set of advantages, limitations, and appropriate uses that must be understood before any data-driven exploration. Table 1 highlights each data source with a key strength and weakness. For a more elaborate discussion of climate data sources, please see Faghmous and Kumar (2013).11
Table 1.
List of Climate Data Sources with the Temporal Coverage of Each Data Source
| Key strength | Key weakness | |
|---|---|---|
| Climate model | Ability to run forward simulations | Relies solely on physics |
| In situ observation | Direct observations | Spatial bias |
| Satellite | Global coverage | Lack of continuity as missions last on average 5 years |
| Paleoclimate | Ability to use proxy data to infer preindustrial climate trends | Techniques to analyze such data are still evolving |
Continuously changing data
Despite having an abundance of data, the climate science community faces the significant challenge of dealing with a continuously changing observing system.12 Just like Google's search engine algorithm goes through changes, so do the instruments and algorithms used to monitor and process observational data, especially for satellites and other remote sensing tools. Changes in instruments and data processing algorithms put into question the applicability of such data to study long-term climate. For example, tropical cyclones or hurricanes have been routinely observed since the mid-1940s. Similarly, we have an abundance of climate data spanning the same period.
“CHANGES IN INSTRUMENTS AND DATA PROCESSING ALGORITHMS PUT INTO QUESTION THE APPLICABILITY OF SUCH DATA TO STUDY LONG-TERM CLIMATE.”
One application of interest to the scientific community as well as society at large is the ability to predict seasonal tropical cyclone counts using large-scale environmental variables. However, before satellite monitoring became routine in the late 1970s, tropical cyclones were prone to be missed if they were not observed through landfall, a ship, or airplane reconnaissance.13,14 Thus, there is an upward trend in the total number of tropical cyclones in the Atlantic, but it is unclear if it is due to changes in the observational system or due to climate change.15
Data empathy
One prerequisite to any big data endeavor is data, lots of them. Requiring large amounts of data has two major drawbacks: first, the prerequisite of an abundance of information is contrary to the way humans learn. In nature, humans learn with relatively small sample sizes of unlabeled data. Yes, the stimuli might be large (e.g., through the five senses); however, the exposures or samples needed for learning tend to be small. Second, with large datasets where one measures anything and everything, it can be difficult to understand how that data were collected and for what purpose.
Every dataset has a story, and understanding it can guide the choice of suitable analyses; some have labeled this data understanding as data empathy. The reason for understanding where the data come from is twofold: first, understanding how the data are generated, their purpose, and generation processes will guide your investigation. Second, understanding the inherent biases in the data gives you a chance to correct them or adjust your results and recommendations.
For example, one of the most widely used datasets in machine learning is the mushroom dataset from the UCI repository. This dataset is commonly used to demonstrate a basic classification problem of predicting whether a mushroom is edible (i.e., poisonous or not) based on some physical features. The dataset comes with two labels, “poisonous” and “not poisonous”; however, reading the dataset's description, we find that “Each species is identified as definitely edible, definitely poisonous, or of unknown edibility and not recommended. This latter class was combined with the poisonous one” (see https://archive.ics.uci.edu/ml/datasets/Mushroom). Thus, the data originally had three classes that were collapsed into two. In this particular case, the best models are, therefore, guaranteed to yield false positives, where a mushroom is labeled as poisonous while it is not. But consider the disastrous impact if these uncertain mushrooms were merged with the nonpoisonous class instead.
Climate data are routinely postprocessed for easy use. Figure 2 shows raw satellite data for sea surface height, along with the postprocessed product available to the public. Such heavy postprocessing will lead to biases in the data, and any analysis must appropriately identify how such biases might manifest in the results. Luckily, the Climate Data Guide16 (http://climatedataguide.ucar.edu), a project funded by the U.S. National Science Foundation, can be a resource to big data practitioners. The Climate Data Guide serves as a community-authored guide for climate datasets. The guide contains over 100 Earth Science-related datasets with additional information such as common uses and a list of peer-reviewed publications that used the data.
FIG. 2.
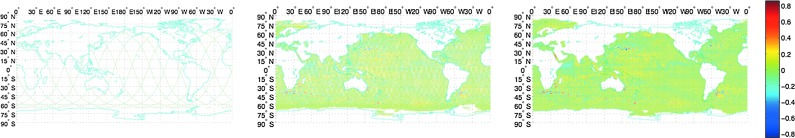
An example of raw and postprocessed satellite data. (Left) Along-track satellite observations of sea surface height from the JASON-II satellite for May 20, 2010. (Middle) A 12-day composite of five satellites centered on May 20, 2010. (Right) The postprocessed data from May 20, 2010. The altimeter products were produced by Ssalto/Duacs and distributed by AVISO, with support from CNES (www.aviso.oceanobs.com/duacs/).
Short observational record
Another challenge with climate data is availability. Some datasets span only a decade or less. Although the data might be large—for example, high spatial resolution but short temporal duration—the spatiotemporal questions that we can ask from such data are limited. One study in the journal Science17 connected changes in sea surface temperatures in the Pacific and North Atlantic to changes in forest fires in the Amazon. The study found that the sea surface temperatures thousands of miles away had a 0.9 correlation with forest fires in certain regions of the Amazon. However, the duration of the fire record only spanned 10 years, and these correlations were between time series of length 10. Hence, even these high correlations could occur by random chance and must be scrutinized further.
Heterogeneity
Another data challenge is heterogeneity. The Earth system is composed of numerous interacting variables that guide its climate. Different key variables are monitored using various technologies, and some might not be observed at all. One attempt to quantify the most important Earth science variables is the 50 essential climate variables (ECVs), each of which has its own biases. For example, variables that rely on ground stations might be subject to spatial bias or have to be moved frequently because of sociopolitico events on the ground. Other ECVs might come from satellites whose missions generally last 5 years, where understanding how the records of the same dataset relate to each other is a significant challenge to a continuous record. From a data science perspective, it is important to be aware that although these data originate from disparate sources, they are still part of the same system and are inexorably related. One data-centric challenge is how to merge data from heterogeneous sources that are complimentary yet possibly redundant.
“FROM A DATA SCIENCE PERSPECTIVE, IT IS IMPORTANT TO BE AWARE THAT ALTHOUGH THESE DATA ORIGINATE FROM DISPARATE SOURCES, THEY ARE STILL PART OF THE SAME SYSTEM AND ARE INEXORABLY RELATED.”
Data representation
Traditional data science, and machine learning specifically, has relied on attribute-value data as input to most learning models.2 However, numerous climate phenomena cannot be represented in attribute-value form. For example, a hurricane is an evolving pattern over a significant spatiotemporal span. Thus, one cannot represent a hurricane with a binary value as it does not simply appear and then disappear. Instead, a storm gradually gains strength, plateaus, and gradually dissipates. Such spatiotemporal evolutionary processes are well captured by the differential equations used in climate models, but there is a need for similar abstractions within broader data science.
One data representation that has gained popularity is the notion of a “climate network.” In general, nodes in the climate network are geographical locations on the grid, and the edge weights measure a degree of similarity between the behaviors of the time series that characterize each node (linear correlation,6,18 mutual information,19 synchronization,20 etc.) However, such network-based representation of climate data needs significant advances. First, most of these representations assume single-variable networks, while the climate system is a multivariate one. Thus, there is a need for novel methods that are able to summarize the interactions of several climate variables across space and time. Second, these “data assimilation” methods must consider the heterogeneous nature of the data. Each variable in the analysis might have different origins and biases. Finally, the study of networks in a variety of applications assumes static networks, with some notable exceptions.21 In climate, however, there needs to be an intuitive framework to construct spatiotemporal networks. The most common methods currently construct networks for each time slice and then analyze them separately. Such a framework generates unstable networks across time due to noisy data as well as the sensitive methods used to construct networks. Finally, there is a need to develop novel network analysis methods for physical sciences. The majority of network analyses in climate rely on network characteristics derived from mathematics and other domains, which might not be suitable for the application at hand.
Methods Challenges
Traditionally, many data-driven explorations tend to boil down to regression or classification. However, the focus of climate science is more about understanding than predicting. Yes, there is interest in predicting individual events, but a greater focus remains on a system-level view rather than individual events. This difference comes with two consequences: First, there is a greater emphasis on model interpretability rather than model flexibility. Thus, “black box” models that tend to do very well in regression or classification tasks are not adopted because their accuracy cannot be related back to physical processes. Second, existing data science conventions have focused on a narrow form of data representation that does not abstract spatiotemporal phenomena. This means that the way the data are represented relies heavily on attribute-value representation without any notion of contextual information (in space or time). This representation was reinforced by the popularity of the UC Irvine Machine Learning repository—a set of small public datasets that researchers developing novel learning algorithms could use to test their methods. However, not all problems lend themselves to a set of attributes that are generally assumed to be independent. Finally, the spatiotemporal nature of the data presents unique challenges.
The spatiotemporal nature of climate data emerges in the form of auto- and cross-correlation between input variables. Therefore, existing learning methods that make implicit or explicit independence assumptions about the input data will have limited applicability to the climate domain. For example, pattern mining—the task of autonomously extracting interesting patterns from data—is challenging because, in autocorrelated spatiotemporal fields, the data tend to be smooth and feature boundaries become blurred. In relationship mining, where we are interested in finding significant relationships between datasets, the autocorrelation makes such that numerous regions tend to be highly correlated due to proximity in space and time.
“THE SPATIOTEMPORAL NATURE OF CLIMATE DATA EMERGES IN THE FORM OF AUTO- AND CROSS-CORRELATION BETWEEN INPUT VARIABLES.”
Sample bias
Sampling bias is the case when you shortchange your model by training it on a biased or nonrandom dataset, which results in a poorly generalizable hypothesis. One of the most common examples of this bias happens when assessing startup success. Numerous business courses rely on “case studies” of successful companies. Such case studies actually depict the anomalies and not the norm as most companies fail—for every Apple that became a success, there were 1000 other startups that died trying. To build an accurate data-driven exploration, we must build our models with samples from all populations.
For example, Johns et al.22 investigated the genesis conditions of tornadoes by monitoring two environmental conditions: wind shear and convective available potential energy (CAPE). The authors analyzed the wind shear and CAPE associated with 242 tornado cases and fit a model to these data. From a data science perspective, a shortcoming of this study is that it failed to sample wind shear and CAPE values when tornados did not occur. In order for a model to separate between positive (tornados) and negative (no tornados) events, it must be trained using both populations.
However, sampling negative events, especially for climate extremes, is no trivial task. This is because there is a severe class imbalance between positive and negative events since the majority of the time can be considered a negative event.
Problem definition challenges
A great advantage traditional data science has is the clear definition of learning tasks (regression, classification, etc.). In climate science, however, objective function can be harder to define. For example, one of the most feared impacts of global climate change is drought. Yet, the very notion of a drought is ambiguous from a data-driven perspective. First, there are numerous types of droughts: agricultural, metrological, and hydrological.23 However, in general, droughts may be defined as “the prolonged absence, or marked deficiency, of precipitation.”24 Second, even if we can agree on a definition, how to represent such “deficiency” is unclear. For instance, droughts may be quantified in absolute or relative terms, and depending on which data representation is chosen, one might arrive at different conclusions. Two recent studies published in Nature Climate Change25 and Nature26 came to opposing conclusions about whether there are noticeable changes in drought trends as a result of climate change. One study23 further highlighted the disparate results by pointing out (among other reasons) that each study relied on a different precipitation dataset. There are other instances where two studies used the same data but arrived at opposing conclusions. When examining the changes in sea surface temperatures and hurricane occurrences, one study27 found that the observed hurricane trends were just part of larger oscillations, whereas another study15 concluded that hurricane counts were increasing along with sea surface temperatures. In this case, both groups used the same data but instead relied on different data analysis techniques to arrive at opposing conclusions.
Evaluation challenges
Data-driven methods generally focus on optimizing objective metrics to quantify the performance of an algorithm: revenue, churn rate, classification error, etc. However, the focus on abstract quantities such as these makes it hard to apply these methods to climate where the emphasis is more about understanding than mere statistical accuracy. In other words, there is a fundamental difference between the objective functions in climate science and broader data science. This is especially true when it comes to translate model performance to impact. In business, one can easily tie a low misclassification rate to some business bottom line—an X% decrease in classification error would result in Y% increase in up-sell dollars. However, it is less clear how much an increase or decrease in root-mean-square error would impact climate phenomena, much less societies on the ground.
“DATA-DRIVEN METHODS GENERALLY FOCUS ON OPTIMIZING OBJECTIVE METRICS TO QUANTIFY THE PERFORMANCE OF AN ALGORITHM: REVENUE, CHURN RATE, CLASSIFICATION ERROR, ETC.”
From predictions to causal inference
The most common success stories of big data revolve around predictions: predicting your new favorite movie or dish, predicting if your marriage will last, etc. Often times in our quest for accuracy, little concern is given to why the models are accurate as long as they provide some predictive skill. This focus on prediction accuracy biases analyses to more complex statistical models, but as models become more complex, it becomes harder to understand why they are skillful, and they rarely yield insight into the mechanisms that drive phenomena. We need better models to determine causal inference and will require a trade-off between model flexibility and model interpretability.
Theory-Guided Data–Driven Applications in Climate Science
Advances in data science, the growth of datasets, and virtually no (computational) barriers to the analysis of such data gave rise to the notion that any problem with a clear objective function can be solved given sufficient data. There will be no need for domain expertise or subjective interpretation since there are enough data to tell the full story. This big data narrative gained common acceptance in mainstream culture and data sciences. Such a narrative became so popular that a 2008 article in Wired Magazine went as far as declaring big data as “The End of Theory,”28 where data would speak for themselves when present in sufficiently large quantities.
What we have learned since the Wired article is that unsupervised big data analysis is a tool, and like any tool, it is prone to misuse. Consider Google Flu Trends, once considered big data's poster child. In 2009, a team of Google researchers reported in the journal Nature29 that by analyzing flu-related queries coming into its search engine, it can accurately detect flu outbreaks quicker than the Centers for Disease Control and Prevention. This story gained mass appeal because of its narrative: an innovative and agile Internet company was faster and better at detecting a serious public health concern than an outdated and bureaucratic agency and its army of domain experts. Unfortunately, Google Flu Trends' success (and story) did not withstand the test of time. A 2014 study30 found that, for consecutive years, Google made more bad predictions than good ones. According to the study's authors, the drop in accuracy was due to the system's overreliance on search queries, which depend on Google's ever-changing search engine algorithm. As a result, the data that were collected at different times had different purposes, causes, and interpretations. There are two lessons from this cautionary tale. First, any data-driven discovery is inexorably linked to the quality of the data, their source, and sampling biases. Second, when the size and complexity of the data become so large, common problems in “little data,” such as statistical significance, don't magically disappear; they come back with a vengeance.
More broadly, the two most common perils of big data analytics when it comes to scientific domains deal with the methods used and the means by which results are interpreted—and they share a common thread: disregard for common domain knowledge. From the method's perspective, some of the most popular data analysis techniques are ill-suited to analyze noisy, heterogeneous, and autocorrelated data that are found in climate and other sciences. Thus, while these methods will certainly produce output, they may rarely yield insight. The riskier offense is that of interpreting such output using a theory-free mindset. The big data scientist should be cautioned to interpret any results within the known theories of the application domain. As a result, big data analytics should not be seen as the “silver bullet” of modern research and must be used in addition to other tools lest we misuse them. What is needed is the development of data-driven methodologies that are guided by theory to constrain search, discover more meaningful patterns, and produce more accurate models.
“WHAT IS NEEDED IS THE DEVELOPMENT OF DATA-DRIVEN METHODOLOGIES THAT ARE GUIDED BY THEORY TO CONSTRAIN SEARCH, DISCOVER MORE MEANINGFUL PATTERNS, AND PRODUCE MORE ACCURATE MODELS.”
While the need to study our planet will most certainly spur numerous data science innovations, we believe that the highest impact change will occur when we remove the emphasis on differentiating between data-driven and hypothesis-driven or theory-driven research. Recently, an increasing number of studies have shown that employing one approach over the other would yield limited results. On the one hand, a hypothesis-driven research agenda will run into problems when there is not sufficient theory to explain certain phenomena. For example, we do not have a clear theory about how forest fires will evolve if the planet continues to warm. Thus, a theory-driven investigation will likely produce limited insight on that topic. On the other hand, focusing solely on statistical accuracy without any regard to climate science theory may return physically implausible results that have no practical use to the domain scientist.
What is needed is an approach that leverages the advances in data-driven research yet constrains both the methods and the interpretation of the results through tried-and-true scientific theory. Thus, to make significant contributions to climate science, new data science methods must encapsulate domain knowledge to produce theoretically-consistent results. For example, where selecting a statistical model, one should discard distributions that are inconsistent with the physics that guide the climate system.
In addition to constraining big data methods (e.g., regression), we must also interpret any statistical model output from a theoretical perspective as well. As an illustrative example, take the Science study that linked changes in sea surface temperatures to forest fires in the Amazon.17 What makes it different from the Google Flu Trends study is that the link between sea surface temperatures and fires was not solely based on the 0.9 correlation between a length-10 time series. Instead, the authors were able to explain a physically plausible mechanism that would lead sea surface temperatures to impact dryness, and as a result, forest fires several months later. If it were only for the data-driven insight, the study would not be plausible enough.
Here we highlight some other examples of theory-guided data science with climate applications. Faghmous et al.31 showed that large-scale pattern mining algorithms can discover false patterns if not constrained by basic theoretical facts. In their study, the authors developed an unsupervised method to identify coherent rotating structures in the ocean known as ocean eddies. There were several existing methods that identified eddies, including one set of results that were published in the journal Science.32 However, the patterns identified were not analyzed based on a simple physical fact that eddies are theoretically axisymmetric Gaussian features33 with a single extremum (maximum or minimum). This physical consistency constrained a simple pattern-mining algorithm to produce more accurate features compared to methods that routinely merge eddies and could be identified as features with two or more extrema.
In a relationship mining application,34 scientists attempted to automatically identify the various climate variables that are currently observable and are good predictors of simulated increases in global temperatures if CO2 levels in the atmosphere were to double (known as equilibrium climate sensitivity). To identify such variables, the researchers set up a search space comprised of 41,741 vectors representing data from various spatiotemporal scales. The authors showed that although many of the candidate vectors were identified as skilled predictors using traditional significance testing methods, all of the potential 41,741 relationships were not statistically significant once they accounted for dependence between models, variables, locations, and seasons. Thus, any high statistics observed were found to be explainable by chance, showing that without a physically consistent hypothesis, testing would yield misleading results.
Finally, within predictive models, it has been shown both theoretically35 and in practice36 that theory-agnostic models generalize poorly to unseen data despite being highly accurate on observed data. As a result, methods that fit the data without any regard to the underlying physical dynamics that constrain and produce the observations can lead to a “non-physical finite time blow-up and large time instability in statistical solutions.”35 Ganguly et al.37 provide another example of this paradigm in the context of climate extremes.
Conclusion
Climate science is one of our era's greatest challenges because of the danger it poses to our planet. It also presents a tremendous opportunity for big data research since climate science brings forth novel data, methods, and evaluation challenges. However, big data analytics alone are not enough to insightfully and accurately explore climate data. There is a need for theory-guided data science methods that blend the power of big data analytics with the caution of scientific theory and first principles.
Acknowledgments
These ideas were developed while the authors were funded by an NSF Expeditions in Computing Grant #1029711 and an NSF EAGER Grant #1355072. J.H.F. was also funded by an NSF Graduate Research Fellowship and a University of Minnesota Doctoral Dissertation Fellowship.
Author Disclosure Statement
The authors have no conflicts of interests with regard to the publication of this article.
References
- 1.Overpeck JT, Meehl GA, Bony S, Easterling DR. Climate data challenges in the 21st century. Science 2011; 331:700. [DOI] [PubMed] [Google Scholar]
- 2.Langley P. The changing science of machine learning. Mach Learn 2011; 82:275–279 [Google Scholar]
- 3.Steinbach M, et al. Clustering earth science data: Goals, issues and results. In: Proceedings of the Fourth KDD Workshop on Mining Scientific Datasets, 2001 [Google Scholar]
- 4.Tan P, et al. Finding spatio-temporal patterns in earth science data. In: KDD 2001 Workshop on Temporal Data Mining, 2001 [Google Scholar]
- 5.Steinbach M., et al. Clustering earth science data: Goals, issues, and results. In: Getoor L, Senator TE, Domingos P, Faloutsos C. (Eds.): Proceedings of the Ninth ACM SIGKDD International Conference on Knowledge Discovery and Data Mining, Washington, DC, USA, August24–27, 2003 ACM 2003. ISBN 1-58113-737-0 pp. 446–455 [Google Scholar]
- 6.Tsonis AA, Roebber PJ. The architecture of the climate network. Phys A Stat Mech Its Appl 2004; 333:497–504 [Google Scholar]
- 7.Srivastava AN, Oza NC, Stroeve J. Virtual sensors: Using data mining techniques to efficiently estimate remote sensing spectra. IEEE Trans Geosci Remote Sens 2005; 43:590–600 [Google Scholar]
- 8.University of Minnesota. Expeditions in Computing: Understanding Climate Change—A Data-Driven Appraoch. Available online at http://climatechange.cs.umn.edu/ Last accessed August15, 2014
- 9.Gomes CP. Computational sustainability: Computational methods for a sustainable environment, economy, and society. Bridge 2009; 39:5–13 [Google Scholar]
- 10.Monteleoni C, et al. Computational Intelligent Data Analysis for Sustainable Development: Data Mining and Knowledge Discovery Series. New York: CRC Press, 2013, pp. 81–126 [Google Scholar]
- 11.Faghmous JH, Kumar V. Spatio-temporal data mining for climate data: Advances, challenges, and opportunities. In Chu W, Ed., Data mining and knowledge discovery for big data. Springer, Heidelberg, Germany, 2013. pp. 83–116 [Google Scholar]
- 12.Trenberth KE, et al. Climate Science for Serving Society. Dordrecht: Springer Netherlands, 2013, pp. 13–50 [Google Scholar]
- 13.Emanuel K. The hurricane-climate connection. Bull Am Meteorol Soc 2008; 89:ES10 [Google Scholar]
- 14.Chang EKM, Guo Y. Is the number of North Atlantic tropical cyclones significantly underestimated prior to the availability of satellite observations? Geophys Res Lett 2007; 34:5 [Google Scholar]
- 15.Holland GJ, Webster PJ. Heightened tropical cyclone activity in the North Atlantic: Natural variability or climate trend? Phil Trans R Soc A 2007; 365:2695–2716 [DOI] [PubMed] [Google Scholar]
- 16.Schneider DP, Deser C, Fasullo J, Trenberth KE. Climate data guide spurs discovery and understanding. Eos Trans Am Geophy Union 2013; 94:121–122 [Google Scholar]
- 17.Chen Y, et al. Forecasting fire season severity in South America using sea surface temperature anomalies. Science 2011; 334:787–791 [DOI] [PubMed] [Google Scholar]
- 18.Steinhaeuser K, Chawla NV, Ganguly AR. Complex networks in climate science: Progress, opportunities and challenges. In: NASA Conference on Intelligent Data Understanding, Mountain View, CA, 2010 [Google Scholar]
- 19.Donges JF, Zou Y, Marwan N, Kurths J. The backbone of the climate network. Europhy Lett 2009; 87:48007 [Google Scholar]
- 20.Arenas A, Díaz-Guilera A, Kurths J, et al. Synchronization in complex networks. Phys Rep 2008; 469:93–153 [Google Scholar]
- 21.Leskovec J, Kleinberg J, Faloutsos C. Graphs over time: Densification law, shrinkage diameters and possible explanations. In: Grossman R, Bayardo RJ, Bennett KP. (Eds.): Proceedings of the Eleventh ACM SIGKDD International Conference on Knowledge Discovery and Data Mining, Chicago, Illinois, USA, August21–24, 2005 ACM 2005. ISBN 1-59593-135-X pp 177–187 [Google Scholar]
- 22.Johns RH, Davies JM, Leftwich PW. Some wind and instability parameters associated with strong and violent tornadoes: 2. Variations in the combinations of wind and instability parameters. Geophys Monogr Ser 1993; 79:583–590 [Google Scholar]
- 23.Trenberth KE, et al. Global warming and changes in drought. Nat Clim Change 2014; 4:3–8 [Google Scholar]
- 24.Core Writing Team, Pachauri RK, Reisinger A. (Eds.). Climate Change 2007: Synthesis Report. Contribution of Working Groups I, II and III to the Fourth Assessment Report of the Intergovernmental Panel on Climate Change. Geneva: IPCC, 2007 [Google Scholar]
- 25.Dai A. Increasing drought under global warming in observations and models. Nat Clim Change 2012; 3:52–58 [Google Scholar]
- 26.Sheffield J, Wood EF, Roderick ML. Little change in global drought over the past 60 years. Nature 2012; 491:435–438 [DOI] [PubMed] [Google Scholar]
- 27.Goldenberg SB, Landsea CW, Mestas-Nuñez AM, Gray WM. The recent increase in Atlantic hurricane activity: Causes and implications. Science 2001; 293:474. [DOI] [PubMed] [Google Scholar]
- 28.Anderson C. The end of theory: The data deluge makes the scientific method obsolete. Wired Magazine, June23, 2008 [Google Scholar]
- 29.Ginsberg J, et al. Detecting influenza epidemics using search engine query data. Nature 2009; 457:1012–1014 [DOI] [PubMed] [Google Scholar]
- 30.Lazer D, Kennedy R, King G, Vespignani A. The parable of Google flu: Traps in big data analysis. Science 2014; 343:1203–1205 [DOI] [PubMed] [Google Scholar]
- 31.Faghmous JH, et al. EddyScan: A physically consistent eddy monitoring application. In: Srivastava A. and Chawla N. (Eds): Proceedings of the Conference on Intelligent Data Understanding October24–26, Boulder, CO. USA, 2012. pp. 96–103 [Google Scholar]
- 32.Chelton DB, Gaube P, Schlax MG, et al. The influence of nonlinear mesoscale eddies on near-surface oceanic chlorophyll. Science 2011; 334:328–332 [DOI] [PubMed] [Google Scholar]
- 33.Chelton DB, Schlax MG, Samelson RM. Global observations of nonlinear mesoscale eddies. Prog Oceanogr 2011; 91:167–216 [Google Scholar]
- 34.Caldwell PM, et al. Statistical significance of climate sensitivity predictors obtained by data mining. Geophys Resarch Lett 2014; 41:1803–1808 [Google Scholar]
- 35.Majda A, Yuan Y. Fundamental limitations of Ad hoc linear and quadratic multi-level regression models for physical systems. Discrete Continuous Dyn Syst B 2012; 17:1333–1363 [Google Scholar]
- 36.Majda AJ, Harlim J. Physics constrained nonlinear regression models for time series. Nonlinearity 2013; 26:201–217 [Google Scholar]
- 37.Ganguly AR, et al. Toward enhanced understanding and projections of climate extremes using physics-guided data mining techniques. Nonlinear Proc Geophys Discus 2014; 1:51–96 [Google Scholar]
- 38.Intergovernmental Panel on Climate Change. Climate Change 2001: The Scientific Basis. Cambridge, UK: Cambridge University Press, 2001 [Google Scholar]