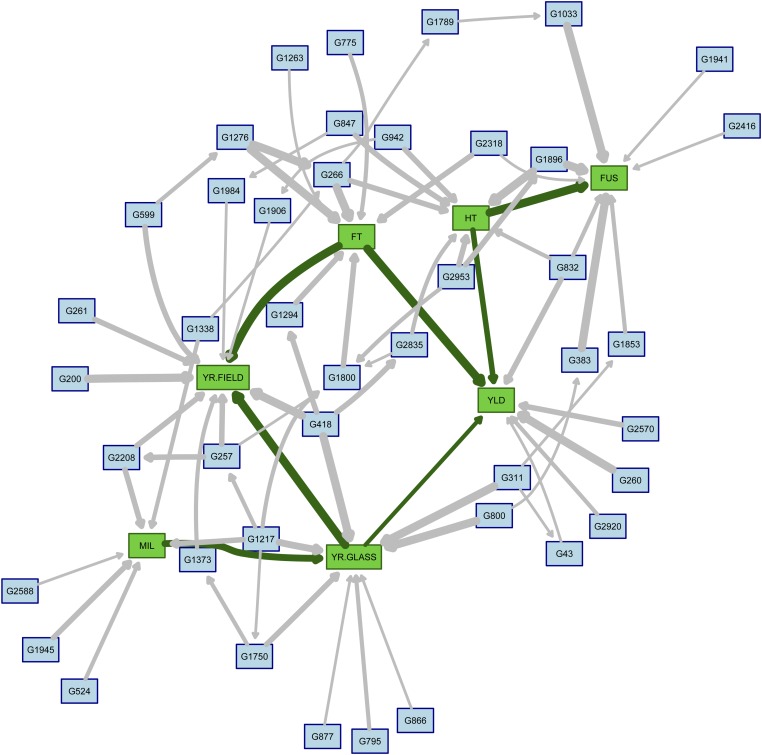
Figure 1.
Averaged network obtained from the cross-validated BNs for α = 0.10. Green nodes correspond to traits: yield (YLD), flowering time (FT), height (HT), yellow rust in the field (YR.FIELD) and in the glasshouse (YR.GLASS), mildew (MIL), and Fusarium (FUS). Blue nodes correspond to SNPs. The thickness of the arcs represents the strength of the corresponding dependence relationships as measured by their frequency in the BNs produced during cross-validation.

