Abstract
Background
Accurate detection of recurrent same-site deep vein thrombosis (DVT) is a challenging clinical problem. As DVT formation and resolution are associated with a preponderance of inflammatory cells, we investigated whether noninvasive 18F-fluorodeoxyglucose (FDG)-PET imaging could identify inflamed, recently formed thrombi and thereby improve the diagnosis of recurrent DVT.
Methods and Results
We established a stasis-induced DVT model in murine jugular veins and also a novel model of recurrent stasis DVT in mice. C57BL/6 mice (n=35) underwent ligation of the jugular vein to induce stasis DVT. FDG-PET/CT was performed at DVT timepoints of day 2, 4, 7, 14, or 2+16 (same-site recurrent DVT at day 2 overlying a primary DVT at day 16). Antibody-based neutrophil depletion was performed in a subset of mice prior to DVT formation and FDG-PET/CT. In a clinical study, 38 patients with lower extremity DVT or controls undergoing FDG-PET were analyzed. Stasis DVT demonstrated that the highest FDG signal occurred at day 2, followed by a time-dependent decrease (p<0.05). Histological analyses demonstrated that thrombus neutrophils (p<0.01), but not macrophages, correlated with thrombus PET signal intensity. Neutrophil depletion decreased FDG signals in day 2 DVT compared to controls (p=0.03). Recurrent DVT demonstrated significantly higher FDG uptake than organized day 14 DVT (p=0.03). The FDG DVT signal in patients also exhibited a time-dependent decrease (p<0.01).
Conclusions
Noninvasive FDG-PET/CT identifies neutrophil-dependent thrombus inflammation in murine DVT, and demonstrates a time-dependent signal decrease in both murine and clinical DVT. FDG-PET/CT may offer a molecular imaging strategy to accurately diagnose recurrent DVT.
Keywords: DVT, fluorodeoxyglucose, inflammation, recurrent DVT, PET, neutrophil
Introduction
Deep vein thrombosis (DVT) and subsequent pulmonary embolism is a major cause of cardiovascular death.1, 2 The incidence of DVT in industrialized countries is 1–3 individuals per 1,000 per year.1, 3 Furthermore, the risk of recurrent DVT is up to 10% per year in patients with idiopathic or unprovoked DVT.4 In addition, after DVT treatment, patients may experience recurrent leg pain due to a recurrent DVT, the post-thrombotic syndrome, or other etiologies. Failure to diagnose a recurrent DVT places the patient at risk of fatal pulmonary embolism.5 Therefore the accurate diagnosis of a recurrent DVT is critical to preserve health, as well as to justify prolonged, potentially life-long, anticoagulation and its attendant bleeding risks. Unfortunately, the diagnosis of a recurrent DVT often poses a significant diagnostic challenge for anatomical imaging methods such as duplex ultrasonography, computed tomography (CT) venography, or magnetic resonance venography, as a prior residual thrombus confounds the diagnosis of acute superimposed on remote thrombus.5, 6 Thus accurate approaches to identify recurrent DVT are urgently needed.
DVT formation and resolution are time-dependent inflammatory processes that involve neutrophils and macrophages.7, 8 Since 18-fluorine-fluorodeoxyglucose (FDG) uptake is upregulated in lesions containing pro-inflammatory myeloid cells such as neutrophils9-11 and macrophages,12, 13 we hypothesized that FDG-positron emission tomography (PET)-CT could allow noninvasive imaging of DVT-induced inflammation, and allow the identification of recurrent DVT even in sites with pre-existing older thrombi. In this study, we systematically investigated the imaging profile of FDG-PET in murine DVT, and then explored cellular mechanisms of FDG uptake in DVT, focusing on thrombus neutrophils and macrophages. Then we developed and validated a novel animal model of recurrent stasis DVT to investigate whether FDG-PET could specifically identify recurrent DVT in the same site as the primary DVT. Additionally, in a blinded clinical study, we investigated the temporal profile of FDG uptake in DVT patients undergoing FDG-PET.
Methods
Mouse model of stasis-induced DVT in jugular vein
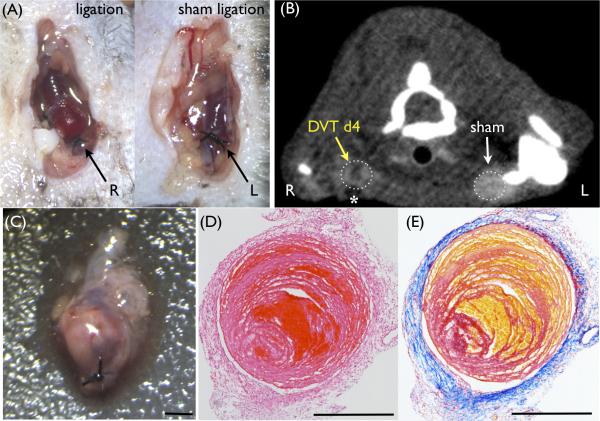
Animal studies were approved by the MGH Subcommittee on Research Animal Care. Male C57BL/6 mice (14-20 weeks) were anesthetized using a mixture of intraperitoneal ketamine/xylazine. The right main jugular vein and a reliably present large side branch were surgically ligated with 6-0 nylon sutures to induce stasis DVT, analogous to murine inferior vena cava (IVC) stasis DVT models.14 As a sham control, the left jugular vein was surgically exposed and tied loosely without constriction (Fig. 1A). At various timepoints after ligation from day 2 up to day 16, PET/CT imaging was performed, followed by sacrifice and ex vivo analyses (n=4-6 at each timepoint). A subset of mice (n=3) underwent three-timepoint serial PET/CT imaging and were sacrificed after the final imaging timepoint (Supplemental Fig. S1). For the recurrent DVT model (n=6), we removed the suture of the ligation at day 2 to allow recanalization of thrombosed jugular vein, followed by re-ligation 12 days later to induce recurrent same-site stasis-induced DVT (Supplemental Fig. S1). We also performed complete ligation of the contralateral jugular vein at day 2 to enhance recanalization of the first DVT, and to compare a fresh recurrent DVT and an older DVT in the same mouse.
Figure 1.
Induction of stasis-induced DVT model in the murine jugular vein. (A) Surgical ligation of the right jugular vein was performed to induce deep vein thrombosis (DVT). As a sham control, the left jugular vein was surgically exposed and loosely tied without constriction. (B) Contrast-enhanced computed tomography (CT) venography shows a filling defect only in the right jugular vein with DVT (dark signal, yellow arrow). Surgery-induced air artifact was observed in front of ligated jugular vein (asterisk). (C) Resected red-white thrombus in the ligated jugular vein. (D) Hematoxylin-eosin stain. (E) Carstairs’ stain (red = fibrin, yellow = erythrocytes, blue = collagen). Representative DVT images at day 0 (A) and day 4 (B-E). Scale bars, 500 μm.
PET/CT imaging
Following an overnight fast, mice underwent tail vein injection of 15-25 μCi/g of 18F-FDG (PETNET Solutions, Woburn, MA). One hour later, microPET/CT imaging was performed using a small animal scanner (Inveon, Siemens Medical Solutions, Inc., Malvern, PA). CT imaging preceded PET imaging, with acquisition of 360 cone beam projections using a source power and current of 80 keV and 500 A, respectively. Mice were injected with an iodinated contrast agent (Isovue-370) at 20 μL/min during the CT scan. Projections were reconstructed into 3-dimensional volumes containing 512 × 512 × 768 voxels with the dimension of 0.11 × 0.11 × 0.11 mm (Amira, San Diego, CA). The PET image voxel size was 0.797 × 0.861 × 0.861 mm. Data were calculated as mean and max standardized uptake values (SUVs) and TBR (target-to-background ratio; DVT/sham).
Induction of neutropenia.
A subset of mice (n=4) was treated with anti-neutrophil antibody (Accurate Chemical, NY) to induce neutropenia.15, 16 The antibody was initially injected (500 μg/mouse, i.p.) one day prior to surgery. Additional doses of the antibody were i.v. administered (250 μg/mouse) on postoperative days 1 and 2 (Supplemental Fig. S1C).
Ex vivo gamma counting and histopathology
See Supplement for full details. After sacrifice, mice were perfused with 0.9% saline via the left ventricle. Radioactivity of excised jugular veins was measured by a gamma radiation counter (Wizard, PerkinElmer). In a subset of resected DVT (day 2 timepoint, n=5), the vein wall and thrombus were gently separated followed by gamma radioactivity measurements. Next, jugular veins were fixed overnight with paraformaldehyde (PFA) and embedded in optimal cutting temperature compound (Sakura Finetek, Torrance, CA). Serial 6- m cryostat sections were obtained for H&E, Carstairs’ fibrin staining, Masson trichrome, and immunohistochemistry. The number of thrombus neutrophils and macrophages per 5 high power fields (HPF; 1000x) was quantified as previously reported.17
Protein extraction and immunoblotting
See supplement.
Clinical FDG-PET study
See Supplement for full details. Access of patient records and analysis of patient data were approved by the Partners Institutional Review Board. Participants for the clinical imaging sub-study were consecutively identified from a database of patients who had undergone 18F-FDG-PET/CT imaging for oncological evaluation at Massachusetts General Hospital. From a clinical database of 437 patients who underwent PET/CT imaging and also had a clinical diagnosis of DVT, we consecutively identified 19 patients with iliofemoral DVT and whose FDG-PET imaging was performed within 6 months after the onset of DVT. Matched control patients were then identified for each individual with a DVT by: age, sex, malignancy status, chemotherapy exposure, and steroid immunosuppressive therapy within 6 months. An individual region-of-interest (ROI) was placed around the area just superior to the popliteal vein and extended to the inferior of the iliac bifurcation in order to obtain a maximum standardized uptake value (SUVmax). The average venous blood uptake of the right atrium was used to derive a TBR.18 Patients were then analyzed to assess the time-dependent changes in FDG uptake in DVT and corresponding vein of matched control patients without a DVT.
Statistics
See Supplement for full details. For animal data, results are expressed as median [25%-75% quartiles]. Statistical comparisons between two groups were evaluated by the Mann-Whitney U test, and by the Kruskal-Wallis test for multiple groups followed by the Dunn's post-test. For comparison between two groups within the same animal, the Wilcoxon matched-pairs signed rank test was used. Continuous variables at multiple timepoints were compared by the Friedman test. FDG uptake measurements were correlated with histological findings by use of the two-tailed Spearman method. Statistical comparisons were performed with GraphPad Prism (La Jolla, CA). Mice that did not develop jugular DVT (histologically negative, n=3) were excluded from analyses. For clinical data, values are expressed as mean±SEM. The Wilcoxon signed-rank test was used for single comparisons, and after confirming normality of distribution, linear regression analysis was used to determine the association between FDG uptake and DVT age (SPSS 22, IBM, Chicago, IL). A value of P<0.05 was considered statistically significant.
Results
Development of a murine stasis-induced DVT model in the jugular vein suitable for FDG-PET imaging
The surgical ligation-induced stasis model of murine DVT is well established in the IVC.14, 15, 17 However, preliminary experiments with FDG-PET imaging of acute IVC DVT did not allow thrombus detection due to high FDG background in the kidneys and spine, as well as the surrounding bowel, an organ with high glucose utilization.19 Therefore we established a new murine stasis-induced DVT model in the jugular vein, an area of lower background FDG uptake and a common site of clinical DVT.5 Jugular DVT were readily detected as obstructions on CT venography, in contrast to sham-operated contralateral jugular veins (Fig. 1A-B). Histological analyses confirmed fibrin, red blood cells, and white blood cells, similar to the ligation IVC stasis model (Fig. 1C-E).14, 17, 20
Noninvasive imaging of DVT inflammation by FDG-PET/CT
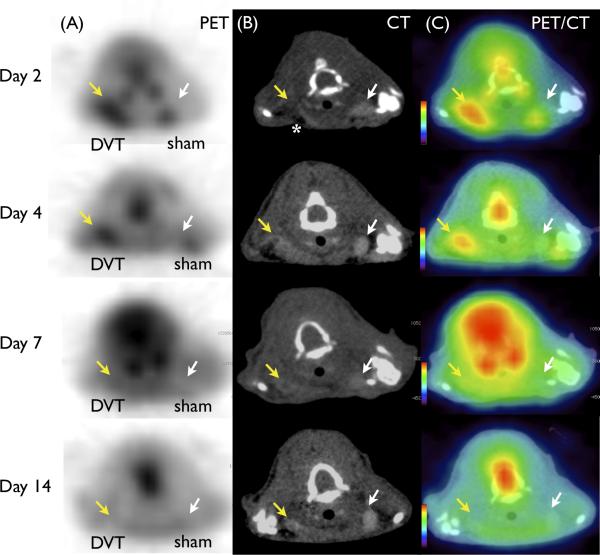
In vivo 18F-FDG PET/CT imaging was performed from day 2 up to day 16 after jugular vein ligation. Elevated FDG signal was observed in the right thrombosed jugular vein, with significantly less signal detected in the sham-operated jugular vein (Fig. 2A, FDG-PET). Thrombosed jugular veins induced a filling defect on CT venography (Fig. 2B, CT) that colocalized well with FDG-PET signals (Fig. 2C, PET/CT).
Figure 2.
FDG-PET enhances acute DVT in mice. Representative images of (A) FDG-PET (B) contrast-enhanced CT venography, and (C) fused PET/CT at various timepoints. DVT (yellow arrow) induced filling defects in contrast CT venography not seen in the contralateral sham-operated vein (white arrow). Surgery-induced air artifact (dark signal) is observed anterior to each vein on CT (white asterisk). FDG-PET DVT signal was elevated in acute DVT, and diminished over time. Mild surgery-induced inflammation at wound healing region was observed in the sham surgery left jugular vein region at day 2.
18F-FDG accumulation diminishes over time in experimental DVT
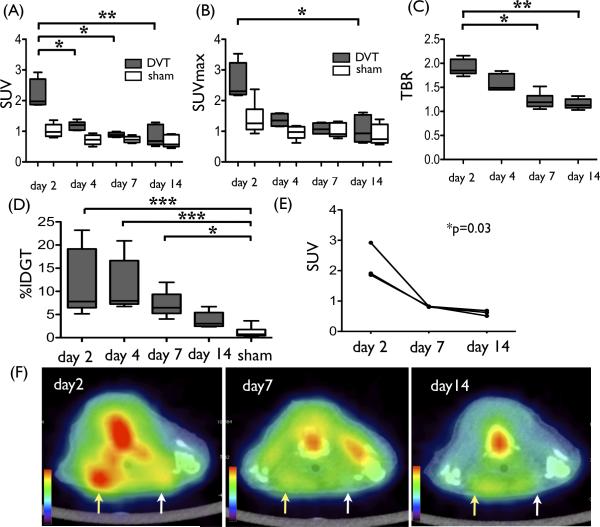
To determine whether the FDG-PET signal was modulated by DVT age, we analyzed DVT signals as a function of time after jugular vein ligation. We observed a significant decrease in the 18F-FDG DVT signal over time (SUV (median [quartiles]) = 1.98 [1.87-2.70] day 2, 1.20 [1.04-1.30] day 4, 0.88 [0.82-0.96] day 7, 0.68 [0.57-1.22] day 14, p<0.001, Fig. 3A). The DVT SUVmax and TBR values were highest at day 2 and decreased thereafter (SUVmax = 2.31 [2.20-3.23] day 2, 1.35 [1.17-1.58] day 4, 1.07 [0.92-1.27] day 7, 0.93 [0.66-1.54] day 14, p=0.01; TBR = 1.85 [1.79-2.09] day 2, 1.49 [1.45-1.79] day 4, 1.19 [1.10-1.32] day 7, 1.13 [1.08-1.23] day 14, p=0.002, Fig. 3B-C). Gamma radiation counts of resected DVT demonstrated similar findings, with a time-dependent decrease in radioactivity (%IDGT = 7.81 [6.47-19.2]% day 2, 7.72 [7.14-13.1]% day 4, 6.47 [5.25-9.36]% day 7, 3.04 [2.48-5.44]% day 14, vs. 0.735 [0.458-1.75]% (pooled sham), p<0.0001, Fig. 3D).
Figure 3.
Time-course quantitative changes of FDG signal in DVT. (A) Standard uptake value (SUV), (B) SUVmax , (C) target-to-background ratio (TBR), and (D) %injected dose per gram of tissue (%IDGT) showed a similar trend (p<0.05) in that values were highest at day 2 and significantly decreased over time (4-5 mice per group). (E and F) Subset of mice underwent serial PET imaging at day 2, 7, and 14. FDG accumulation in DVT (yellow arrow, sham control white arrow) demonstrated a time-dependent significant decrease (p=0.03). *p<0.05, **p<0.01, ***p<0.001. (Box-and-Whisker plot) Middle line represents median value, box indicates interquartile range (25th–75th percentiles), and range bars show maximum and minimum.
Three mice underwent serial PET/CT imaging at day 2, 4, and 14 after the ligation. Serial imaging revealed a time-dependent decrease in the FDG signal in individual DVT (p=0.03, Fig. 3E-F).
Neutrophil appearance associates with FDG uptake in DVT
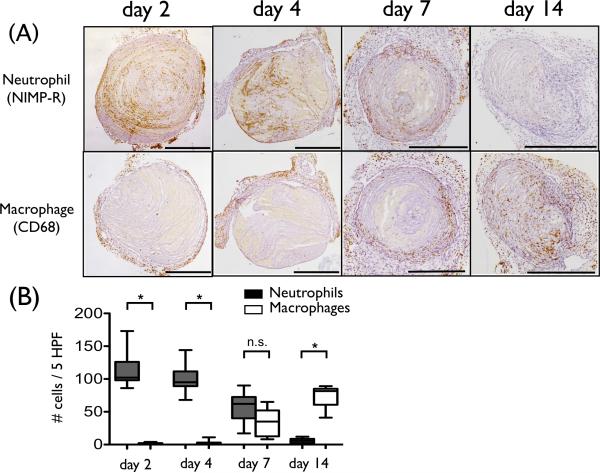
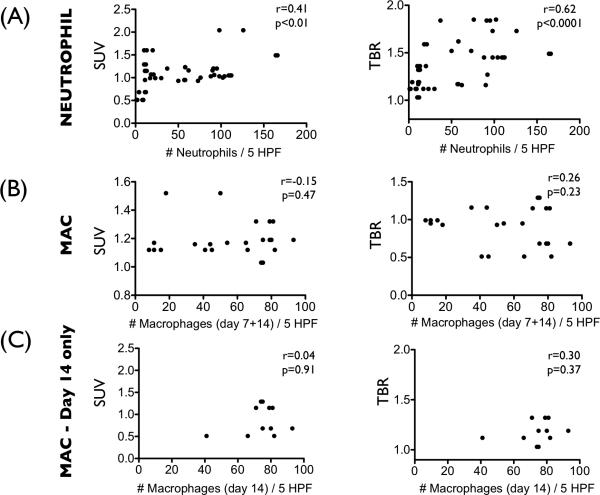
We compared 18F-FDG uptake measurements and histological profiles at the study timepoints of 2, 4, 7, and 14 days after induction of stasis DVT. Neutrophils infiltrated DVT abundantly at the earlier timepoints of day 2 and 4, with fewer neutrophils observed at day 7, and minimal neutrophils at day 14 (Fig. 4). Thrombus macrophages were evident at day 7 and resided in the outer DVT edge (Fig. 4). These histological findings in our developed jugular DVT stasis ligation model recapitulate both the IVC full stasis DVT and the partial flow IVC DVT models.14, 20 The number of neutrophils in DVT correlated with the FDG DVT uptake (SUV; r=0.41, p=0.004, TBR; r=0.62, p<0.001, Fig. 5A). The macrophage FDG relationships were analyzed in day 7 and day 14 DVT, as day 2 and day 4 DVT showed few macrophages and also substantial confounding neutrophils. In the day 7 and 14 cohort, macrophages were not significantly associated with the FDG DVT signal (SUV; r=−0.15, p=0.47, TBR; r=0.26, p=0.23, Fig. 5B). To avoid confounding neutrophil-based FDG signal at day 7, we further assessed only the day 14 macrophage association with FDG signals. This correlation remained nonsignificant (SUV; r=0.04, p=0.91, TBR; r=0.30, p=0.37, Fig. 5C).
Figure 4.
Recruitment of inflammatory cells into DVT. (A) Representative immunostaining of neutrophil and macrophage from various DVT timepoints. Neutrophils are abundant and predominate in early day 2-4 DVT. Thrombus macrophages were evident from day 7 and resided at the outer DVT edge. (B) The number of neutrophils (black) and macrophages (white) per 5 HPF (high power field) were shown. (*p<0.0001). Scale bar, 500 μm. n.s.=not significant.
Figure 5.
FDG signal associations with thrombus neutrophils and macrophages. (A) The number of thrombus neutrophils correlated with the FDG uptake in DVT (SUV; r=0.41, p=0.004, TBR; r=0.62, p<0.001). (B) Thrombus macrophages pooled from day 7 and day 14 did not significantly correlate with the FDG-DVT signal (SUV; r=-0.15, p=0.47, TBR; r=0.26, p=0.23). (C) Sub-analysis of macrophages at day 14 also did not significantly correlate with FDG-DVT signals (SUV; r=0.04, p=0.91, TBR; r=0.30, p=0.37). MAC= macrophage.
To further examine the relationship of FDG-PET and thrombus inflammation, we assessed the protein expression of matrix metalloproteinase-9 (MMP-9), a key inflammatory mediator of DVT.8 Immunoblot analyses showed a time-dependent decrease of MMP-9 expression in DVT (Supplemental Fig. S2A-B, p=0.01), similar to the in vivo FDG signals.
To evaluate the relative contributions of FDG signal from the thrombus and from the vein wall, we performed ex vivo gamma radiation measurements after carefully separating the thrombus and the vein wall components (day 2 DVT, n=5). We found that 66.7±5.9% of the radioactivity localized in thrombus. We further analyzed the distribution of neutrophils using immuno-histological images. We observed 86.4±1.4% of neutrophils (NIMP-R positive area) were localized to thrombi, with the remaining 14% localized to the vein wall. These data indicate that the majority of the FDG signal arises from thrombus itself.
Neutropenia markedly reduces FDG-PET signal generation in DVT
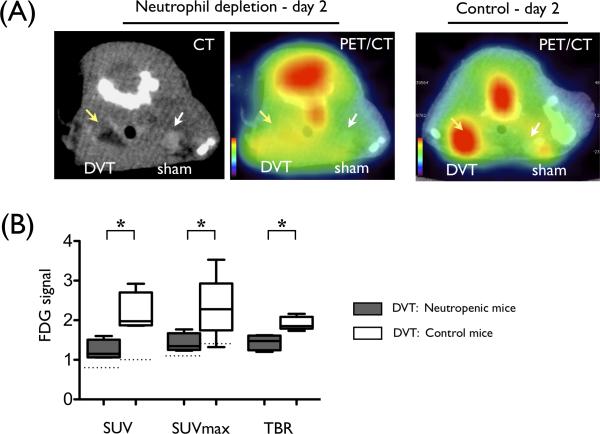
Histological analyses above demonstrated that thrombus neutrophils, but not macrophages, provided the basis for elevated FDG signals in DVT. To further determine whether neutrophils could directly modulate the FDG signal in DVT, we induced systemic neutropenia in a subgroup of mice prior to DVT induction. Pre-treatment with an anti-neutrophil antibody decreased circulating neutrophils in day 2 DVT mice (0.6 [0.2-0.9] ×103/μL vs. control day 2 DVT mice, 1.7 [1.2-2.1] ×103/μL, p=0.03). On day 2, imaging demonstrated a significant decrease in FDG-DVT signal in neutropenic mice, compared with normal mice (SUV = 1.15 [1.06-1.51] vs. 1.98 [1.87-2.70], p=0.03, Fig. 6). Histological assessment confirmed diminished neutrophil accumulation in DVT (neutropenia 21.0 [14.0-59.0] vs. control 102 [86.0-126], # neutrophils per 5 high-power-fields, p<0.001). Neutropenic mice also showed decreased expression levels of MMP-9 in DVT in parallel to FDG signal (Supplemental Fig. S2C).
Figure 6.
Experimental neutropenia reduces FDG signal within DVT. (A) Representative images of contrast-enhanced CT and fused PET/CT from neutropenic mice (left) and uninjected control (right) are shown. DVT (yellow arrow) and sham-operated jugular vein (white arrow) are indicated by arrows. (B) SUV, SUVmax, and TBR of FDG signal of DVT in neutropenic mice are significantly lower than control mice (*p<0.05). N=4 per group. Median SUV and SUVmax value of sham-operated contralateral jugular veins are shown as respective dotted lines.
Establishment of novel animal model of recurrent DVT
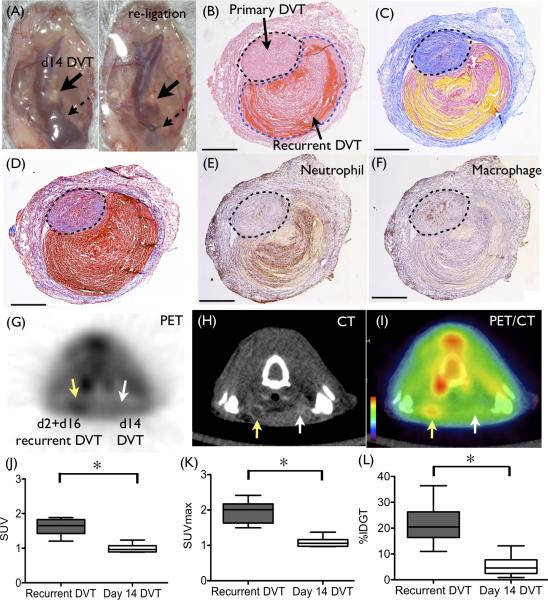
To our knowledge, this is the first report demonstrating an animal model of recurrent DVT. The conventional stasis-induced DVT model is not suitable for inducing recurrent DVT due to the absence of adequate blood flow and blood volume after complete ligation,14 precluding generation of a second, same location, stasis-induced DVT. To create an environment suitable for a second stasis DVT, at day 2 we de-ligated (cut the suture) the initial jugular vein ligation, to spur partial thrombus recanalization and restoration of blood flow. In addition we ligated the contralateral jugular vein to induce an occlusive stasis DVT. Twelve days later (at day 14), the de-ligated vein was then re-ligated at same location (Fig. 7A). This procedure successfully generated a second new venous thrombus at day 2 directly overlying the 16 days old primary thrombus. Histological staining clearly distinguished the second thrombus at day 2 (increased fibrin, increased neutrophils, and less collagen) from the organized primary thrombi at day 16 (Fig. 7B-D). The vein wall also exhibited DVT-induced scarring (increased thickness and collagen-rich), which is observed in patients with post-thrombotic syndrome (PTS).21 A number of neutrophils were present in day 2 recurrent DVT, while macrophages were abundant in day 16 DVT, similar to day 14 DVT (Fig.7 E-F).
Figure 7.
Establishment of a novel recurrent DVT model, and specific detection of recurrent DVT by FDG-PET/CT. (A) Two days after the initial ligation, the suture was de-ligated and removed. At day 14, re-ligation was performed at previously ligated site to induce a recurrent DVT. Histological images of resected recurrent DVT (day 2 recurrent DVT (outlined with black dotted line) overlying the day 16 DVT (outlined with blue dotted line)) are shown. (B) Hematoxylin-eosin, (C) Carstairs’ staining, and (D) Masson Trichrome staining shows red blood cell-rich zones in recurrent DVT (red in H&E and yellow in Carstairs’) and collagen-rich zones in older DVT (pink in H&E and blue in Carstairs’ and Masson). (E and F) Immunostaining of neutrophils (E) and macrophages (F) shows the newly formed recurrent DVT is neutrophil-rich, while the older primary DVT shows macrophage predominance. Representative (G) PET, (H) CT, and (I) PET/CT images are shown. FDG enhanced recurrent DVT substantially more than older DVT (G and I). (J-L) FDG signal was significantly higher in recurrent DVT (day 2 overlying the day 16 DVT) than in older day 14 DVT in the contralateral vein. N=6 per group. Scale bar, 500 μm.
FDG-PET/CT enables the identification of recurrent, same site DVT
As our data revealed that FDG signal is neutrophil-dependent, we examined whether FDG-PET could identify recently formed, neutrophil-rich recurrent DVT in the same site as the primary DVT. As shown in Fig. 7G-I, recurrent DVT was successfully identified by FDG-PET/CT. FDG signal from recurrent DVT (recurrent DVT at day 2 + primary DVT at day 16) was significantly higher than old day 14 DVT (SUV; 1.65 [1.42-1.83] vs. 0.962 [0.892-1.07], SUVmax; 2.01 [1.63-2.17] vs. 1.06 [0.973-1.16], p=0.03 respectively, Fig. 7J-K). Ex vivo gamma radiation measurement also showed a significant increase in the activity of recurrent DVT (day 2+16) compared to older DVT at day 14 (%IDGT = 20.46 [16.4-26.3]% vs. 4.60 [2.46-7.75]%, p=0.02, Fig 7L).
18F-FDG activity in DVT decreases over time in patients
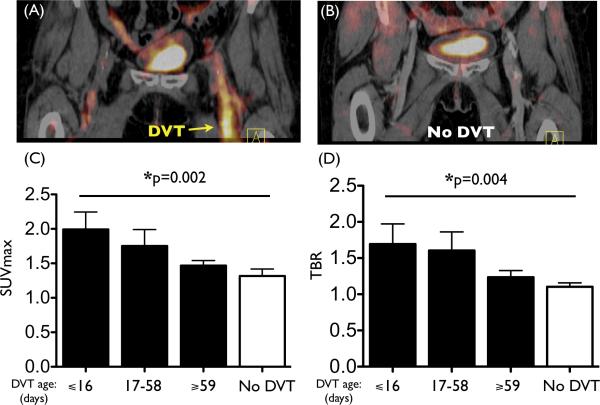
We retrospectively analyzed 38 individuals who underwent PET/CT scanning for clinical indications: 19 patients with DVT (10/9 male/female, mean age, 64.1 years) and 19 matched control patients (Supplemental Table). We observed a significantly increased signal within recently formed DVT (Fig. 8A-B). Across the entire population, the FDG signal in DVT was significantly greater than in the matched vein of controls (SUVmax 1.87±0.15 vs. 1.32±0.10, P=0.02; TBR 1.62±0.19 vs. 1.10±0.05, P=0.01). Furthermore, we observed a time-dependent decrease in the FDG signal within DVT. When the DVT age was stratified by tertiles, both the SUVmax and TBR of DVT diminished over time (p=0.002 for SUVmax, p=0.004 for TBR, Fig. 8C-D). The relationship between DVT age (by tertiles) and DVT FDG uptake (either as SUVmax or TBR) remained significant after multivariable adjustments for: demographic factors, (TBR: β=−0.209, p=0.007; SUVmax: β=−0.233, p=0.003); factors that could impact systemic inflammation (TBR: β=−0.228, p=0.002; SUVmax: β=−0.237, p=0.003); and oncologic history (TBR: β=−0.225, p=0.003; SUVmax: β=−0.245, p=0.001).
Figure 8.
18F-FDG DVT signal is elevated in patients and diminishes over time. Representative PET/CT images from (A) a patient with DVT and (B) a matched control patient without DVT. Elevated FDG signal was observed in the thrombosed femoral vein (A, yellow arrow). (C) The SUVmax and (D) TBR of the DVT exhibited a time-dependent decrease (p=0.002 for SUVmax, p=0.004 for TBR, n=6-7 per DVT group). FDG uptake in the DVT vein was shown for individuals grouped according to age of the DVT, divided into tertiles. Values from the matched vein from control patients are shown in the No DVT group (n=19 patients).
Discussion
In this experimental and clinical study, we demonstrate that the intense inflammatory response produced by DVT can be systematically imaged, serially assessed, and quantified with noninvasive PET/CT. The FDG inflammatory signal exhibited a time-dependent and neutrophil-dependent decay in murine DVT. We also established that FDG-PET/CT could differentiate recurrent DVT from primary DVT utilizing a novel animal model of recurrent DVT. Furthermore, in a clinical study, we observed a similar time-dependent decrease in the FDG-PET signal in human DVT. The overall findings demonstrate that FDG-PET/CT provides an accurate approach to assess neutrophil-dependent and age-dependent DVT inflammation, and can specifically diagnose recurrent DVT.
Recurrent DVT occurs up to 10% per year in patients with unprovoked DVT 4 and is a highly morbid condition, increasing the risk of the post-thrombotic syndrome, pulmonary embolism, and death.2, 22, 23 Accurate diagnosis of recurrent DVT is therefore important in initiating timely anticoagulant therapy, determining the duration of treatment, and recognizing whether a failure of anticoagulation has occurred, with implications for considering IVC filter placement to reduce the risk of pulmonary embolism.2 However, the diagnosis of a recurrent ipsilateral same-site DVT, defined as a new DVT occurring in the same location as a previous DVT, poses a significant diagnostic challenge. Although recurrent DVT is common as an endpoint in observational and therapeutic clinical venous thromboembolism (VTE) trials,2 there is no gold standard for its diagnosis, including ultrasound, MRI, CT, or venography.5, 6, 24 Venous compression ultrasound, the gold standard for initial DVT diagnosis,25 is limited in cases of recurrent DVT where residual thrombus or vein wall scarring is present after the initial DVT. The current findings suggestive of prior DVT on duplex ultrasonography include retraction of the vein, the presence of collateral veins, and recanalization. These signs are often subtle and are frequently absent. Diagnosis of an acute DVT in the milieu of a prior DVT is particularly difficult, especially if large changes in thrombus length or compressed vein diameter are not apparent.5, 6 The situation is even more complicated if previous ultrasound images are unavailable, and some patients may require invasive venography to attempt to establish a diagnosis, which is also limited in its accuracy.5 In the past, studies have attempted to distinguish acute from organized thrombi with ultrasonography,26 MRI,27, 28 and SPECT imaging.29, 30 However, no established imaging technique is routinely utilized in the clinic.5 The current results herein demonstrate that FDG-PET/CT can distinguish newly formed, neutrophil-rich thrombus from older thrombus and can specifically identify recurrent DVT.
Whereas a single case report suggested the potential for FDG-PET/CT to detect recurrent DVT, the authors did not specify if DVT recurred in the same location as the original DVT, nor systematically assess the age of the thrombus, nor obtain histological assessment.31 In addition, while other clinical reports have demonstrated that FDG-PET can identify DVT (but not specifically recurrent DVT),32, 33 our experimental results extend these prior studies, as we precisely controlled the DVT age and timing of subsequent FDG-PET/CT imaging studies, performed quantitative ex vivo radioactivity and detailed histology assessments to corroborate in vivo FDG-PET signals, and induced neutropenia to modulate the FDG-PET signal.
As we established that the FDG DVT signal is time-dependent, FDG-PET offers a noninvasive approach to assess DVT age in vivo. This finding has implications for fibrinolytic therapy of DVT using catheter-directed therapy or pharmacomechanical therapy, two emerging clinical strategies used to treat large iliofemoral DVT.34, 35 This is because intravascular-based fibrinolysis of DVT appears more effective for earlier stage thrombi < 10 days old.36 As the precise age of DVT is not often possible to assess clinically due to the insidious onset of flow-limiting DVT, FDG-PET assessment of DVT age might help predict the success of catheter-directed therapy or pharmacomechanical therapy.
In this study, the observation that the inflammatory FDG signal was more closely associated with neutrophils than macrophages in DVT is not unexpected. FDG uptake occurs in cells exhibiting increased glycolysis, which is higher in myeloid cells, particularly activated macrophages12, 37 and neutrophils.38 We determined that the FDG-PET signal was neutrophil-dependent, and accordingly higher in early, neutrophil-rich DVT. Subsequently, in resolving subacute DVT, we hypothesized that infiltrating macrophages might be of an M2-polarized (reparative) phenotype, as M2-macrophages do not exhibit up-regulated glucose transporter protein type 1 (GLUT-1) expression needed to concentrate FDG.12, 39 Histological analyses supported this hypothesis, as macrophages within day 14 DVT in fact displayed little GLUT-1 expression and little iNOS expression, an M1 marker (Supplemental Fig. S3). This is in distinction to chronic inflammatory conditions such as in atherosclerosis, where macrophages account for the FDG signal,13, 37, 40-43 and demonstrate an M1-polarized (pro-inflammatory) and GLUT1-upregulated phenotype.12 Moreover, the neutrophil-based FDG findings in DVT are similar to studies of other acute, neutrophil-rich lesions such as acute lung injury, where neutrophils but not macrophages serve as the main cellular source of FDG uptake.9-11 As there was a mild FDG signal in day 14 DVT without neutrophils, other non-macrophage cells that may have accumulated FDG include activated myofibroblasts, which are present in the remodeling vein wall after DVT7, 44 and ingest FDG in experimental arthritis models.45 Another consideration regarding lower FDG signal in the later-stage DVT could be due to greater thrombus organization, limiting access of FDG to interior thrombus cells.
Limitations of this study are present. As stasis-induced DVT was generated by surgical ligation of the jugular vein, surgery-induced inflammation is inevitable especially at day 2, resulting in FDG uptake at wound healing region around the DVT and likely in the venous wall. While experiments demonstrate that the majority of FDG signal arises from the thrombus, the vein wall also contributes modestly to the FDG signal. As the ligation suture is necessary to induce stasis thrombi, we cannot precisely resolve intrinsic vein wall inflammation that occurs during DVT resolution from ligation-induced injury. Second, our clinical cohort did not contain any patients with a recurrent DVT who underwent FDG-PET imaging. Third, the clinical cohort was derived from individuals undergoing imaging for oncologic indications, and was a retrospective study. Accordingly, generalization of the findings may be constrained, and prospective clinical FDG-PET studies of recurrent DVT and serial DVT imaging will be needed to validate our findings. Finally, while it is known that 18F-FDG uptake is upregulated in lesions containing pro-inflammatory myeloid cells such as neutrophils9-11 and macrophages,12, 13 histological analysis of clinical DVTs was not possible to perform in this study. Future FDG-PET DVT clinical studies that include a DVT biopsy will be able to elucidate specific inflammatory cells underlying FDG uptake in human DVTs.
Clinical Implications
Our clinical retrospective study also demonstrated a time-dependent decrease in the FDG signal within DVT, extending the main experimental findings from the animal study. DVT showed significantly greater FDG signal compared to the matched vein of control patients. By analyzing greater numbers of DVT patients and with clot ages up to 21 weeks old, our findings extend a smaller study that was restricted to < 10 week old thrombi.32
The findings of this study support the concept that FDG-PET imaging might be useful for determining the inflammatory activity of DVT in living subjects. It is possible that PET/CT could be employed when there is uncertainty regarding whether recurrent DVT exists, or to what degree there is a substantial inflammatory component to an initial DVT, which might also inform the risk of the post-thrombotic syndrome.46, 47 Ultimately, prospective clinical studies will need to be conducted to evaluate if FDG-PET imaging of recurrent DVT provides additive diagnostic value, and enables better outcomes.
Conclusions
Noninvasive FDG-PET/CT enables assessment of thrombus age and inflammation in experimental and clinical DVT, and enables the specific detection of recurrent murine DVT. Thrombus neutrophils are a major cellular basis of FDG signal in early murine DVT. Elevated FDG-PET signal indicates a recently formed, neutrophil-rich thrombus and thereby offers an imaging strategy to accurately diagnose recurrent same-site DVT.
Supplementary Material
Acknowledgments
Funding Sources: This study was supported by NIH HL108229 (FJ), Wagner-Torizuka Society of Nuclear Medicine Fellowship (TH), American Heart Association Founders postdoctoral fellowship #13POST14640021 (TH), and Grant-in-Aid #13GRNT17060040 (FJ).
Footnotes
Conflict of Interest Disclosures: None.
References
- 1.Go AS, Mozaffarian D, Roger VL, Benjamin EJ, Berry JD, Borden WB, Bravata DM, Dai S, Ford ES, Fox CS, Franco S, Fullerton HJ, Gillespie C, Hailpern SM, Heit JA, Howard VJ, Huffman MD, Kissela BM, Kittner SJ, Lackland DT, Lichtman JH, Lisabeth LD, Magid D, Marcus GM, Marelli A, Matchar DB, McGuire DK, Mohler ER, Moy CS, Mussolino ME, Nichol G, Paynter NP, Schreiner PJ, Sorlie PD, Stein J, Turan TN, Virani SS, Wong ND, Woo D, Turner MB. Heart disease and stroke statistics--2013 update: a report from the american heart association. Circulation. 2013;127:e6–e245. doi: 10.1161/CIR.0b013e31828124ad. [DOI] [PMC free article] [PubMed] [Google Scholar]
- 2.Jaff MR, McMurtry MS, Archer SL, Cushman M, Goldenberg N, Goldhaber SZ, Jenkins JS, Kline JA, Michaels AD, Thistlethwaite P, Vedantham S, White RJ, Zierler BK. Management of massive and submassive pulmonary embolism, iliofemoral deep vein thrombosis, and chronic thromboembolic pulmonary hypertension: a scientific statement from the American Heart Association. Circulation. 2011;123:1788–1830. doi: 10.1161/CIR.0b013e318214914f. [DOI] [PubMed] [Google Scholar]
- 3.Kyrle PA, Eichinger S. Deep vein thrombosis. Lancet. 2005;365:1163–1174. doi: 10.1016/S0140-6736(05)71880-8. [DOI] [PubMed] [Google Scholar]
- 4.Baglin T, Luddington R, Brown K, Baglin C. Incidence of recurrent venous thromboembolism in relation to clinical and thrombophilic risk factors: prospective cohort study. Lancet. 2003;362:523–526. doi: 10.1016/S0140-6736(03)14111-6. [DOI] [PubMed] [Google Scholar]
- 5.Bates SM, Jaeschke R, Stevens SM, Goodacre S, Wells PS, Stevenson MD, Kearon C, Schunemann HJ, Crowther M, Pauker SG, Makdissi R, Guyatt GH. Diagnosis of DVT: Antithrombotic Therapy and Prevention of Thrombosis, 9th ed: American College of Chest Physicians Evidence-Based Clinical Practice Guidelines. Chest. 2012;141:e351S–418S. doi: 10.1378/chest.11-2299. [DOI] [PMC free article] [PubMed] [Google Scholar]
- 6.Schellong SM. Diagnosis of recurrent deep vein thrombosis. Hamostaseologie. 2013;33:195–200. doi: 10.5482/HAMO-13-06-0029. [DOI] [PubMed] [Google Scholar]
- 7.Saha P, Humphries J, Modarai B, Mattock K, Waltham M, Evans CE, Ahmad A, Patel AS, Premaratne S, Lyons OT, Smith A. Leukocytes and the natural history of deep vein thrombosis: current concepts and future directions. Arterioscler Thromb Vasc Biol. 2011;31:506–512. doi: 10.1161/ATVBAHA.110.213405. [DOI] [PMC free article] [PubMed] [Google Scholar]
- 8.Wakefield TW, Myers DD, Henke PK. Mechanisms of venous thrombosis and resolution. Arterioscler Thromb Vasc Biol. 2008;28:387–391. doi: 10.1161/ATVBAHA.108.162289. [DOI] [PubMed] [Google Scholar]
- 9.Zhou Z, Kozlowski J, Goodrich AL, Markman N, Chen DL, Schuster DP. Molecular imaging of lung glucose uptake after endotoxin in mice. Am J Physiol Lung Cell Mol Physiol. 2005;289:L760–768. doi: 10.1152/ajplung.00146.2005. [DOI] [PubMed] [Google Scholar]
- 10.Locke LW, Williams MB, Fairchild KD, Zhong M, Kundu BK, Berr SS. FDG-PET Quantification of Lung Inflammation with Image-Derived Blood Input Function in Mice. Int J Mol Imaging. 2011;2011:356730. doi: 10.1155/2011/356730. [DOI] [PMC free article] [PubMed] [Google Scholar]
- 11.de Prost N, Tucci MR, Melo MF. Assessment of lung inflammation with 18F-FDG PET during acute lung injury. AJR Am J Roentgenol. 2010;195:292–300. doi: 10.2214/AJR.10.4499. [DOI] [PMC free article] [PubMed] [Google Scholar]
- 12.Satomi T, Ogawa M, Mori I, Ishino S, Kubo K, Magata Y, Nishimoto T. Comparison of Contrast Agents for Atherosclerosis Imaging Using Cultured Macrophages: FDG Versus Ultrasmall Superparamagnetic Iron Oxide. J Nucl Med. 2013;54:999–1004. doi: 10.2967/jnumed.112.110551. [DOI] [PubMed] [Google Scholar]
- 13.Tawakol A, Migrino RQ, Bashian GG, Bedri S, Vermylen D, Cury RC, Yates D, LaMuraglia GM, Furie K, Houser S, Gewirtz H, Muller JE, Brady TJ, Fischman AJ. In vivo 18F-fluorodeoxyglucose positron emission tomography imaging provides a noninvasive measure of carotid plaque inflammation in patients. J Am Coll Cardiol. 2006;48:1818–1824. doi: 10.1016/j.jacc.2006.05.076. [DOI] [PubMed] [Google Scholar]
- 14.Diaz JA, Obi AT, Myers DD, Jr., Wrobleski SK, Henke PK, Mackman N, Wakefield TW. Critical review of mouse models of venous thrombosis. Arterioscler Thromb Vasc Biol. 2012;32:556–562. doi: 10.1161/ATVBAHA.111.244608. [DOI] [PMC free article] [PubMed] [Google Scholar]
- 15.Varma MR, Varga AJ, Knipp BS, Sukheepod P, Upchurch GR, Kunkel SL, Wakefield TW, Henke PK. Neutropenia impairs venous thrombosis resolution in the rat. J Vasc Surg. 2003;38:1090–1098. doi: 10.1016/s0741-5214(03)00431-2. [DOI] [PubMed] [Google Scholar]
- 16.Eliason JL, Hannawa KK, Ailawadi G, Sinha I, Ford JW, Deogracias MP, Roelofs KJ, Woodrum DT, Ennis TL, Henke PK, Stanley JC, Thompson RW, Upchurch GR., Jr Neutrophil depletion inhibits experimental abdominal aortic aneurysm formation. Circulation. 2005;112:232–240. doi: 10.1161/CIRCULATIONAHA.104.517391. [DOI] [PubMed] [Google Scholar]
- 17.Henke PK, Pearce CG, Moaveni DM, Moore AJ, Lynch EM, Longo C, Varma M, Dewyer NA, Deatrick KB, Upchurch GR, Jr., Wakefield TW, Hogaboam C, Kunkel SL. Targeted deletion of CCR2 impairs deep vein thombosis resolution in a mouse model. J Immunol. 2006;177:3388–3397. doi: 10.4049/jimmunol.177.5.3388. [DOI] [PubMed] [Google Scholar]
- 18.Subramanian S, Tawakol A, Burdo TH, Abbara S, Wei J, Vijayakumar J, Corsini E, Abdelbaky A, Zanni MV, Hoffmann U, Williams KC, Lo J, Grinspoon SK. Arterial inflammation in patients with HIV. JAMA. 2012;308:379–386. doi: 10.1001/jama.2012.6698. [DOI] [PMC free article] [PubMed] [Google Scholar]
- 19.Heijink DM, Kleibeuker JH, Nagengast WB, Oosterhuis D, Brouwers AH, Koornstra JJ, de Jong S, de Vries EG. Total abdominal 18F-FDG uptake reflects intestinal adenoma burden in Apc mutant mice. J Nucl Med. 2011;52:431–436. doi: 10.2967/jnumed.110.083956. [DOI] [PubMed] [Google Scholar]
- 20.Nosaka M, Ishida Y, Kimura A, Kondo T. Time-dependent appearance of intrathrombus neutrophils and macrophages in a stasis-induced deep vein thrombosis model and its application to thrombus age determination. Int J Legal Med. 2009;123:235–240. doi: 10.1007/s00414-009-0324-0. [DOI] [PubMed] [Google Scholar]
- 21.Deatrick KB, Eliason JL, Lynch EM, Moore AJ, Dewyer NA, Varma MR, Pearce CG, Upchurch GR, Wakefield TW, Henke PK. Vein wall remodeling after deep vein thrombosis involves matrix metalloproteinases and late fibrosis in a mouse model. J Vasc Surg. 2005;42:140–148. doi: 10.1016/j.jvs.2005.04.014. [DOI] [PubMed] [Google Scholar]
- 22.Kahn SR, Shrier I, Julian JA, Ducruet T, Arsenault L, Miron MJ, Roussin A, Desmarais S, Joyal F, Kassis J, Solymoss S, Desjardins L, Lamping DL, Johri M, Ginsberg JS. Determinants and time course of the postthrombotic syndrome after acute deep venous thrombosis. Ann Intern Med. 2008;149:698–707. doi: 10.7326/0003-4819-149-10-200811180-00004. [DOI] [PubMed] [Google Scholar]
- 23.Lecumberri R, Alfonso A, Jimenez D, Fernandez Capitan C, Prandoni P, Wells PS, Vidal G, Barillari G, Monreal M. Dynamics of case-fatalilty rates of recurrent thromboembolism and major bleeding in patients treated for venous thromboembolism. Thromb Haemost. 2013;110:834–843. doi: 10.1160/TH13-02-0132. [DOI] [PubMed] [Google Scholar]
- 24.van Langevelde K, Tan M, Sramek A, Huisman MV, de Roos A. Magnetic resonance imaging and computed tomography developments in imaging of venous thromboembolism. J Magn Reson Imaging. 2010;32:1302–1312. doi: 10.1002/jmri.22379. [DOI] [PubMed] [Google Scholar]
- 25.Kory PD, Pellecchia CM, Shiloh AL, Mayo PH, DiBello C, Koenig S. Accuracy of ultrasonography performed by critical care physicians for the diagnosis of DVT. Chest. 2011;139:538–542. doi: 10.1378/chest.10-1479. [DOI] [PubMed] [Google Scholar]
- 26.Geier B, Barbera L, Muth-Werthmann D, Siebers S, Ermert H, Philippou S, Mumme A. Ultrasound elastography for the age determination of venous thrombi. Evaluation in an animal model of venous thrombosis. Thromb Haemost. 2005;93:368–374. doi: 10.1160/TH04-07-0437. [DOI] [PubMed] [Google Scholar]
- 27.Westerbeek RE, Van Rooden CJ, Tan M, Van Gils AP, Kok S, De Bats MJ, De Roos A, Huisman MV. Magnetic resonance direct thrombus imaging of the evolution of acute deep vein thrombosis of the leg. J Thromb Haemost. 2008;6:1087–1092. doi: 10.1111/j.1538-7836.2008.02986.x. [DOI] [PubMed] [Google Scholar]
- 28.Saha P, Andia ME, Modarai B, Blume U, Humphries J, Patel AS, Phinikaridou A, Evans CE, Mattock K, Grover SP, Ahmad A, Lyons OT, Attia RQ, Renne T, Premaratne S, Wiethoff AJ, Botnar RM, Schaeffter T, Waltham M, Smith A. Magnetic resonance T1 relaxation time of venous thrombus is determined by iron processing and predicts susceptibility to lysis. Circulation. 2013;128:729–736. doi: 10.1161/CIRCULATIONAHA.113.001371. [DOI] [PMC free article] [PubMed] [Google Scholar]
- 29.Bates SM, Lister-James J, Julian JA, Taillefer R, Moyer BR, Ginsberg JS. Imaging characteristics of a novel technetium Tc 99m-labeled platelet glycoprotein IIb/IIIa receptor antagonist in patients With acute deep vein thrombosis or a history of deep vein thrombosis. Arch Intern Med. 2003;163:452–456. doi: 10.1001/archinte.163.4.452. [DOI] [PubMed] [Google Scholar]
- 30.Brighton T, Janssen J, Butler SP. Aging of acute deep vein thrombosis measured by radiolabeled 99mTc-rt-PA. J Nucl Med. 2007;48:873–878. doi: 10.2967/jnumed.106.039396. [DOI] [PubMed] [Google Scholar]
- 31.Chang KJ, Zhuang H, Alavi A. Detection of chronic recurrent lower extremity deep venous thrombosis on fluorine-18 fluorodeoxyglucose positron emission tomography. Clin Nucl Med. 2000;25:838–839. doi: 10.1097/00003072-200010000-00026. [DOI] [PubMed] [Google Scholar]
- 32.Rondina MT, Lam UT, Pendleton RC, Kraiss LW, Wanner N, Zimmerman GA, Hoffman JM, Hanrahan C, Boucher K, Christian PE, Butterfield RI, Morton KA. (18)F-FDG PET in the evaluation of acuity of deep vein thrombosis. Clin Nucl Med. 2012;37:1139–1145. doi: 10.1097/RLU.0b013e3182638934. [DOI] [PMC free article] [PubMed] [Google Scholar]
- 33.Kikuchi M, Yamamoto E, Shiomi Y, Nakamoto Y, Fujiwara K, Watanabe F, Shinohara S. Case report: internal and external jugular vein thrombosis with marked accumulation of FDG. Br J Radiol. 2004;77:888–890. doi: 10.1259/bjr/32956594. [DOI] [PubMed] [Google Scholar]
- 34.Enden T, Haig Y, Klow NE, Slagsvold CE, Sandvik L, Ghanima W, Hafsahl G, Holme PA, Holmen LO, Njaastad AM, Sandbaek G, Sandset PM. Long-term outcome after additional catheter-directed thrombolysis versus standard treatment for acute iliofemoral deep vein thrombosis (the CaVenT study): a randomised controlled trial. Lancet. 2012;379:31–38. doi: 10.1016/S0140-6736(11)61753-4. [DOI] [PubMed] [Google Scholar]
- 35.Vedantham S, Goldhaber SZ, Kahn SR, Julian J, Magnuson E, Jaff MR, Murphy TP, Cohen DJ, Comerota AJ, Gornik HL, Razavi MK, Lewis L, Kearon C. Rationale and design of the ATTRACT Study: a multicenter randomized trial to evaluate pharmacomechanical catheter-directed thrombolysis for the prevention of postthrombotic syndrome in patients with proximal deep vein thrombosis. Am Heart J. 2013;165:523–530. e523. doi: 10.1016/j.ahj.2013.01.024. [DOI] [PMC free article] [PubMed] [Google Scholar]
- 36.Mewissen MW, Seabrook GR, Meissner MH, Cynamon J, Labropoulos N, Haughton SH. Catheter-directed thrombolysis for lower extremity deep venous thrombosis: report of a national multicenter registry. Radiology. 1999;211:39–49. doi: 10.1148/radiology.211.1.r99ap4739. [DOI] [PubMed] [Google Scholar]
- 37.Tawakol A, Migrino RQ, Hoffmann U, Abbara S, Houser S, Gewirtz H, Muller JE, Brady TJ, Fischman AJ. Noninvasive in vivo measurement of vascular inflammation with F-18 fluorodeoxyglucose positron emission tomography. J Nucl Cardiol. 2005;12:294–301. doi: 10.1016/j.nuclcard.2005.03.002. [DOI] [PubMed] [Google Scholar]
- 38.Borregaard N, Herlin T. Energy metabolism of human neutrophils during phagocytosis. J Clin Invest. 1982;70:550–557. doi: 10.1172/JCI110647. [DOI] [PMC free article] [PubMed] [Google Scholar]
- 39.Rodriguez-Prados JC, Traves PG, Cuenca J, Rico D, Aragones J, Martin-Sanz P, Cascante M, Bosca L. Substrate fate in activated macrophages: a comparison between innate, classic, and alternative activation. J Immunol. 2010;185:605–614. doi: 10.4049/jimmunol.0901698. [DOI] [PubMed] [Google Scholar]
- 40.Ogawa M, Ishino S, Mukai T, Asano D, Teramoto N, Watabe H, Kudomi N, Shiomi M, Magata Y, Iida H, Saji H. (18)F-FDG accumulation in atherosclerotic plaques: immunohistochemical and PET imaging study. J Nucl Med. 2004;45:1245–1250. [PubMed] [Google Scholar]
- 41.Vucic E, Dickson SD, Calcagno C, Rudd JH, Moshier E, Hayashi K, Mounessa JS, Roytman M, Moon MJ, Lin J, Tsimikas S, Fisher EA, Nicolay K, Fuster V, Fayad ZA. Pioglitazone modulates vascular inflammation in atherosclerotic rabbits noninvasive assessment with FDG-PET-CT and dynamic contrast-enhanced MR imaging. JACC. Cardiovascular imaging. 2011;4:1100–1109. doi: 10.1016/j.jcmg.2011.04.020. [DOI] [PMC free article] [PubMed] [Google Scholar]
- 42.Hyafil F, Cornily JC, Rudd JH, Machac J, Feldman LJ, Fayad ZA. Quantification of inflammation within rabbit atherosclerotic plaques using the macrophage-specific CT contrast agent N1177: a comparison with 18F-FDG PET/CT and histology. J Nucl Med. 2009;50:959–965. doi: 10.2967/jnumed.108.060749. [DOI] [PubMed] [Google Scholar]
- 43.Hag AM, Pedersen SF, Christoffersen C, Binderup T, Jensen MM, Jorgensen JT, Skovgaard D, Ripa RS, Kjaer A. (18)F-FDG PET imaging of murine atherosclerosis: association with gene expression of key molecular markers. PLoS One. 2012;7:e50908. doi: 10.1371/journal.pone.0050908. [DOI] [PMC free article] [PubMed] [Google Scholar]
- 44.Wakefield TW, Linn MJ, Henke PK, Kadell AM, Wilke CA, Wrobleski SK, Sarkar M, Burdick MD, Myers DD, Strieter RM. Neovascularization during venous thrombosis organization: a preliminary study. J Vasc Surg. 1999;30:885–892. doi: 10.1016/s0741-5214(99)70013-3. [DOI] [PubMed] [Google Scholar]
- 45.Matsui T, Nakata N, Nagai S, Nakatani A, Takahashi M, Momose T, Ohtomo K, Koyasu S. Inflammatory cytokines and hypoxia contribute to 18F-FDG uptake by cells involved in pannus formation in rheumatoid arthritis. J Nucl Med. 2009;50:920–926. doi: 10.2967/jnumed.108.060103. [DOI] [PubMed] [Google Scholar]
- 46.Roumen-Klappe EM, Janssen MC, Van Rossum J, Holewijn S, Van Bokhoven MM, Kaasjager K, Wollersheim H, Den Heijer M. Inflammation in deep vein thrombosis and the development of post-thrombotic syndrome: a prospective study. J Thromb Haemost. 2009;7:582–587. doi: 10.1111/j.1538-7836.2009.03286.x. [DOI] [PubMed] [Google Scholar]
- 47.Bouman AC, Smits JJ, Ten Cate H, Ten Cate-Hoek AJ. Markers of coagulation, fibrinolysis and inflammation in relation to post-thrombotic syndrome. J Thromb Haemost. 2012;10:1532–1538. doi: 10.1111/j.1538-7836.2012.04798.x. [DOI] [PubMed] [Google Scholar]
Associated Data
This section collects any data citations, data availability statements, or supplementary materials included in this article.


