

Abstract

Rhodopin, rhodopinal, and their glucoside derivatives are carotenoids that accumulate in different amounts in the photosynthetic bacterium, Rhodoblastus (Rbl.) acidophilus strain 7050, depending on the intensity of the light under which the organism is grown. The different growth conditions also have a profound effect on the spectra of the bacteriochlorophyll (BChl) pigments that assemble in the major LH2 light-harvesting pigment–protein complex. Under high-light conditions the well-characterized B800-850 LH2 complex is formed and accumulates rhodopin and rhodopin glucoside as the primary carotenoids. Under low-light conditions, a variant LH2, denoted B800-820, is formed, and rhodopinal and rhodopinal glucoside are the most abundant carotenoids. The present investigation compares and contrasts the spectral properties and dynamics of the excited states of rhodopin and rhodopinal in solution. In addition, the systematic differences in pigment composition and structure of the chromophores in the LH2 complexes provide an opportunity to explore the effect of these factors on the rate and efficiency of carotenoid-to-BChl energy transfer. It is found that the enzymatic conversion of rhodopin to rhodopinal by Rbl. acidophilus 7050 grown under low-light conditions results in nearly 100% carotenoid-to-BChl energy transfer efficiency in the LH2 complex. This comparative analysis provides insight into how photosynthetic systems are able to adapt and survive under challenging environmental conditions.
Introduction
The competition for solar photons among aquatic photosynthetic organisms striving to maintain viability at various depths in the water column is fierce, often requiring adaptation of the species for survival. A prime example of the development of adaptive traits is found in the purple photosynthetic bacterium, Rhodoblastus (Rbl.) acidophilus (formerly Rhodopseudomonas acidophila) strain 7050.1−3 This bacterium is able to alter its number and size of photosynthetic units as well as its pigment composition and light absorption properties of the major light harvesting II (LH2) antenna pigment–protein complex in response to changes in illumination conditions.2,4−6 If the bacterium is grown under high light, the well-characterized B800-850 LH2 complex is formed having bacteriochlorophyll (BChl) absorption bands near 800 and 850 nm, and rhodopin and rhodopin glucoside are the primary carotenoid pigments.1,3,7,8 Under low-light conditions, genes that code for a variant LH2 denoted B800-820 (also sometimes referred to as LH3 in the literature) are activated,1−3 the BChl QY absorption band near 850 nm shifts to ∼820 nm, and the organism accumulates rhodopinal and rhodopinal glucoside in the LH2 complex as primary carotenoid pigments (Figures 1A and 1B).1,3,7,9,10 This response to changes in ambient light is controlled by a combination of a classical two component regulatory system and bacteriophytochromes that regulate the synthesis of the photosynthetic apparatus.11−13
Figure 1.

Structures of (A) all-trans-rhodopin glucoside and 13-cis-rhodopinal glucoside and (B) one-third portion of the LH2 B800-820 ring complex from Rbl. acidophilus strain 7050 (PDB 1IJD) showing the protein-bound BChls (green) and carotenoids (purple).
The shift of the BChl QY band from ∼850 nm to ∼820 nm that occurs at low light is due to alterations in the amino acid sequence of the apoproteins that are assembled in the variant LH2 pigment–protein complex.14−18 Results from X-ray crystallography (Figure 1B),18 site-directed mutagenesis,15 and resonance Raman spectroscopy16 indicate that H-bonding residues α44 (Tyr) and α45 (Trp) in the B800-850 LH2 prevent rotation of the C3-acetyl group of the B850 BChl and fix the functional group so that its C=O π-electron bond resides in a planar orientation relative to the porphyrin macrocycle. This configuration allows extension of the π-electron conjugation into the acetyl group. The conversion of these H-bonding residues to non-H-bonding α44 (Phe) and α45 (Leu) in the B800-820 LH2 leads to a rotation of the C3-acetyl group out of the plane of the porphyrin ring, thereby inhibiting delocalization of the π-electron conjugation to the acetyl carbonyl, resulting in more restricted π-electron delocalization and consequently a blue shift of the QY band from ∼850 nm to ∼820 nm.
Accompanying the shift of the BChl QY absorption band in the LH2 complex is a change in the absorption spectrum of the carotenoid. Under low-light growth conditions, rhodopin and rhodopin glucoside are enzymatically converted to rhodopinal and rhodopinal glucoside as an aldehyde group replaces the methyl group at carbon C20 in the carotenoid structures (Figure 1A).19−21 The spectral origin (0–0) vibronic band of rhodopin glucoside in methanol appears at ∼500 nm, whereas for rhodopinal glucoside, the band is less resolved spectrally, and it is located at ∼540 nm in the same solvent (Figure 2). Previous workers compared the carotenoid-to-BChl energy transfer properties of LH2 complexes isolated from cells of Rbl. acidophilus strain 7050 grown under different illumination conditions and found that there was an increase in the energy transfer efficiency from between 50 and 55% for the B800-850 complex to between 70 and 75% for the B800-820 complex.2 However, the previous investigation did not address the specific reasons for the increase, i.e., whether changes in the BChl absorption spectra, or the conversion of rhodopin to rhodopinal in the protein complex, or both factors, were responsible for the enhanced ability of the LH2 complex to effectively harvest photons in the region of carotenoid absorption. Moreover, the previous work and subsequent ultrafast spectroscopic experiments carried out on the B800-820 LH2 complex from Rbl. acidophilus strain 705022 did not assign specific values to the energy transfer efficiencies of the individual carotenoids bound in the complexes, nor has there been any direct comparison of the spectra and dynamics of the excited states of rhodopin and rhodopinal either in solution or in the LH2 complexes. These data are important for addressing the specific mechanism of how these alterations in BChl and carotenoid structures and spectra increase the carotenoid-to-BChl energy transfer efficiency and, as a consequence, enhance the viability of the photosynthetic bacterial organism.
Figure 2.

Normalized steady-state absorption spectra of (A) rhodopin glucoside and (B) rhodopinal glucoside in carbon disulfide, benzyl alcohol, methanol, and acetonitrile recorded in 2 mm path length cuvettes at room temperature.
Energy transfer from carotenoids involves at least two excited singlet states that can act as donors of absorbed light energy to BChl. These are the S1 (21Ag–) and S2 (11Bu+) states whose properties are strikingly distinct. A one-photon transition from the ground S0 (11Ag–) state to the S1 (21Ag–) state is forbidden by symmetry, whereas a transition to the S2 (11Bu+) state is strongly allowed.23−29 The S0 (11Ag–) → S2 (11Bu+) transition is responsible for the vibrant coloration of carotenoids in nature.30 Motivated by the landmark report of the X-ray crystal structure of the LH2 complex from Rbl. acidophilus strain 10050,31 several investigators sought to understand the role of the S1 (21Ag–) and S2 (11Bu+) excited singlet states in the mechanism of energy transfer to BChl in this pigment–protein complex.32−35 For example, Macpherson et al.33 used ultrafast time-resolved optical spectroscopy applied to the LH2 complex prepared from Rbl. acidophilus strain 10050 and reported that the S2 (11Bu+) state of rhodopin glucoside dominated the pathway for energy transfer to BChl despite its extremely short intrinsic lifetime of ∼120 fs in solution. The S1 (21Ag–) state of rhodopin glucoside, which has a much longer lifetime of ∼4 ps in solution, was reported to make only a minor contribution to the overall energy transfer efficiency. In another study using steady-state and ultrafast time-resolved spectroscopy to elucidate the carotenoid-to-BChl energy transfer mechanism in the LH2 complex from Rbl. acidophilus 10050, Cong et al.34 reported the partitioning of energy transfer to be 23 ± 7% from the S1 (21Ag–) state and 63 ± 10% from the S2 (11Bu+) state. A recent broadband 2D electronic spectroscopic investigation of LH2 complexes from Rbl. acidophilus 10050 and Rhodobacter sphaeroides strain 2.4.1 provided convincing evidence for the additional involvement of a dark intermediate state in the carotenoid-to-BChl energy transfer pathway.35
The present work provides a detailed experimental and computational comparison of the excited state energy levels, spectra, and dynamics of rhodopin, rhodopinal, and their associated glucosides in various solvents and in their respective LH2 complexes isolated from Rbl. acidophilus 10050 and 7050 grown under different illumination conditions. The use of steady-state absorption, fluorescence and fluorescence excitation spectroscopy and ultrafast time-resolved transient absorption spectroscopy in the visible spectral region have revealed the rates and efficiencies of carotenoid-to-BChl energy transfer for the individual carotenoids. The data address the questions of how and why photosynthetic organisms alter their pigment composition and light-harvesting characteristics to ensure survival under the challenging, light-deprived environmental conditions in which they are sometimes found.
Materials and Methods
Sample Preparation and Characterization
Bacterial Growth Conditions
Rbl. acidophilus 10050 and 7050 cultures were grown anaerobically in the light using Pfennig’s medium.36 Normal growth conditions (hereafter referred to as high-light (HL) conditions) used continuous illumination at an intensity of 30 μmol s–1 m–2. The Rbl. acidophilus 7050 culture was also grown at a lower light intensity (hereafter denoted low-light (LL)) ranging from 3.7 to 5 μmol s–1 m–2. Cells were harvested by centrifugation at 4000g in a Beckman model J-6B centrifuge. The resulting pellets were resuspended in 1 L of 20 mM MES pH 6.8 buffer, containing 100 mM KCl, and centrifuged again to remove any residual media.
Carotenoid Isolation
Extraction of the carotenoids from whole cells of the bacteria was accomplished by mixing 2–4 g of thawed cells with 30 mL of methanol at room temperature and stirring in the dark for 15 min. The mixture was then centrifuged at 3000g using an SS-34 rotor at 4 °C in a Sorvall RC-5B centrifuge. The supernatant contained primarily BChl and was not used further. The pellet was then mixed with 30 mL of fresh methanol and centrifuged repeatedly until the cells appeared gray, signifying that all the pigments had been extracted. The supernatant from the second and subsequent extractions contained primarily carotenoids as evidenced by absorption spectra recorded using a Varian Cary 50 UV/visible spectrometer. These fractions were pooled and evaporated to dryness using nitrogen gas.
The dried extracts were dissolved in acetonitrile/methanol (6:4, v/v) and analyzed using a Waters 600E/600S HPLC system equipped with a Waters Atlantis T3 OBD preparative column having dimensions of 19 × 100 mm. The mobile phase consisted of acetonitrile/methanol (6:4, v/v) delivered isocratically at a flow rate of 7.0 mL/min. Individual peaks were collected and identified by mass spectrometry using a Fisons Quattro II instrument employing atmospheric pressure chemical ionization (APCI) in negative mode with the following conditions: corona voltage, 2.5 V; cone voltage, 25 V; source temperature, 120 °C; probe temperature, 300 °C, mobile phase, acetonitrile. All solvents were HPLC-grade and were purchased from Sigma-Aldrich Corp. (St. Louis, MO).
Preparation of Light-Harvesting Complexes
The cells were disrupted according to the methods described by Cogdell et al.1 Briefly, ∼5 g of pelleted whole cells of the bacteria were suspended in ∼30 mL of 20 mM Tris buffer adjusted to pH 8.0 using 6 M HCl (hereafter referred to as Tris buffer), and ∼20–50 mg of DNase and a few grains of MgCl2 were added to degrade the released DNA during cellular disruption. The sample was briefly homogenized using a glass tissue homogenizer to ensure smooth passage through the French press operating at 15,000 psi. Cells were passed through the press three times to ensure complete disruption, and the resulting suspension was centrifuged for 2 h at 4 °C in a Type 70 Ti rotor spinning at 180000g in a Beckman L8-55M ultracentrifuge.
The resultant pellet containing membrane fragments was diluted using Tris buffer to an OD of 50 measured in a 1 cm cuvette at the BChl QY absorption band maximum (800 nm for LL grown Rbl. acidophilus 7050 complexes, 850 nm for the HL grown complexes). The membranes were then solubilized by adding 30% lauryldimethylamine oxide (LDAO) dropwise to a final concentration of 1.0% and allowing the sample to incubate for 60 min while being stirred at room temperature in the dark. The sample was then centrifuged for 30 min at 27000g in the Sorvall RC-5B centrifuge to remove denatured protein and any nonsolubilized material. The supernatant containing the solubilized proteins was then collected for further treatment using sucrose density gradient ultracentrifugation.
Sucrose density gradients were prepared in 30 mL polycarbonate Beckman centrifuge tubes. Solutions of 0.2, 0.4, 0.6, and 0.8 M sucrose were prepared using Tris buffer containing 0.1% LDAO and were carefully layered to form discontinuous gradients in the tubes by using the following amounts: 0.8 M, 5.0 mL; 0.6 M, 6.5 mL; 0.4 M, 6.5 mL; and 0.2 M, 5.0 mL. Each tube was then topped off with 2.5 mL of the solubilized sample. The tubes were then placed in a Ti70 rotor and spun at 160000g for 12 h at 4 °C in the Beckman L8-55M ultracentrifuge. The procedure effectively separates any free pigments present in the 0.2 M sucrose layer, from the LH2 complex appearing in the 0.4 M sucrose layer, from the LH1-RC “core” complexes that appear at the interface of the 0.6 and 0.8 M sucrose solutions.
The 0.4 M sucrose solution layer containing the LH2 complex was carefully removed from each tube and pooled. The complex was then purified further by column chromatography using DE52 anion exchange resin (15 g, Whatman Scientific) packed into a 5 cm diameter × 30 cm long solid phase, sintered glass column pre-equilibrated with several bed volumes of Tris buffer. After loading the sample onto the column, several bed volumes of TL buffer (0.1% LDAO, 20 mM Tris pH 8.0) were applied to remove the sucrose. The LH2 complex was then eluted using TL buffer containing increasing concentrations of NaCl in 30 mM increments starting with 10 mM. The HL LH2 complexes from Rbl. acidophilus 10050 and 7050 cells eluted between 10 and 20 mM NaCl, whereas that isolated from LL Rbl. acidophilus 7050 cells eluted at ∼180 mM NaCl. The purity of the eluting fractions was monitored by absorption spectroscopy using a Shimadzu UV-1700 PharmaSpec spectrometer. Fractions from HL samples exhibiting spectra with an 850 nm to 280 nm ratio of >3.0 were pooled for further purification. For the LL sample, fractions exhibiting spectra with an 800 nm to 280 nm absorbance ratio of >2.5 were pooled for further purification.
The pooled sample was reduced to a volume of <1 mL by centrifugation using Vivaspin 4 50 K MW cutoff concentrators (Sartorius Stedim Biotech) placed in an 11390 rotor and spun at 3250g in a Sigma 3K30 centrifuge. The concentrated LH2 was further purified using an Akta Primeplus (GE Healthcare) automated chromatography system equipped with an XK-16 long gel filtration column filled with Superdex-200. 0.5 mL fractions were collected of the LH2 band and subsequently assayed using the ratio of the absorbance maximum of the BChl QY band to the protein absorbance at 280 nm. Fractions having an 800 nm to 280 nm (from the LL-grown Rbl. acidophilus 7050) ratio of >2.7 or an 850 nm to 280 nm (from the HL-grown Rbl. acidophilus cells) ratio of ≥3.3 were pooled and concentrated using the Vivaspin 4 50 K MW cutoff concentrators to an OD of 100 measured at the absorbance maximum of the BChl QY band in a 1 cm cuvette. The sample was then divided into 30 μL aliquots, placed in PCR tubes, flash frozen in liquid nitrogen, and stored in a −80 °C freezer.
Quantitative Analysis of Pigment Composition of the LH2 Complexes
A 10 μL aliquot of the frozen Rbl. acidophilus 7050 LH2 complex was thawed on ice, and the liquid was evaporated to dryness using nitrogen gas. The remaining residue was then redissolved in 2 mL of methanol to release the pigments. This extract was then centrifuged at 13600g for 2 min at room temperature in a Fisher Scientific 235C benchtop microcentrifuge.
The supernatant was then analyzed using a Waters 600E/600S HPLC system equipped with a Waters Atlantis T3 5 μm analytical column having dimensions of 4.6 × 250 mm. The mobile phase consisted of an isocratic delivery of acetonitrile/methanol (6:4, v/v) at a rate of 2.0 mL/min. Similarly, a 30 μL aliquot of the Rbl. acidophilus 10050 LH2 complex was dried under nitrogen gas and denatured with 2 mL of acetone. Following centrifugation, the supernatant was removed and 2 mL of fresh acetone was added to the remaining pellet, and the mixture was centrifuged again, this time resulting in a colorless pellet. The supernatants from the two centrifugations were combined and dried using nitrogen gas. The sample was taken up in 1 mL of acetonitrile/methanol (6:4, v/v) and analyzed on the same HPLC system with a Waters Atlantis T3 OBD 5 μm preparative column. The mobile phase was the same as described above, but with the flow rate increased to 7.0 mL/min.
The molar percentages of the carotenoids were calculated using the area of each HPLC peak detected at the wavelength of maximum absorption divided by the extinction coefficient of the carotenoid,3 and then determining the percentage of each pigment relative to the total carotenoid content. Peaks that could not be conclusively identified by mass spectrometry remain unidentified, but are presumed to be isomers formed during the extraction procedure.
Spectroscopic Methods
All steady-state absorption and fluorescence emission and excitation spectroscopic measurements were carried out in 1 cm square cuvettes at room temperature unless otherwise stated. Rhodopin glucoside and rhodopinal glucoside were dissolved in spectroscopic grade carbon disulfide (Acros Organics), benzyl alcohol (Sigma-Aldrich), methanol (Sigma-Aldrich), or acetonitrile (Sigma-Aldrich). LH2 complexes were suspended in Tris buffer containing 1% LDAO at pH 8. Steady-state absorption spectra of the carotenoids in various solvents and in the LH2 complexes were obtained using either a Varian Cary 50 or a Cary 5000 UV–visible spectrophotometer. Fluorescence emission and excitation spectra were recorded using a Jobin-Yvon Horiba FL3-22 fluorimeter equipped with double excitation and emission monochromators having 1200 grooves/mm gratings, a 450 W Osram XBO xenon arc lamp, and a Hamamatsu R928P photomultiplier tube detector.
Emission spectra of the LH2 complexes were recorded using samples having an OD between 0.025 and 0.1 in a 1 cm path cuvette at the BChl QX band at 591 nm, which was also the excitation wavelength. The excitation and emission slit widths corresponded to bandpasses of 6 and 3 nm, respectively for experiments on the LH2 complex from Rbl. acidophilus 10050. Emission spectra from the Rbl. acidophilus 7050 (HL and LL) LH2 complexes were obtained using excitation and emission slit widths corresponding to bandpasses of 12 and 6 nm, respectively. All emission spectra were corrected using an emission correction factor file generated by taking the ratio of the spectral response of a calibrated 200 W quartz tungsten-halogen filament lamp and the instrument detection system.
Fluorescence excitation spectra were recorded by monitoring the BChl emission at its maximum wavelength (870 nm for the B800-850 complexes and 860 nm for the B800-820 complex) using samples with an OD of 0.025 in a 1 cm path cuvette at the BChl QX band. Emission was detected at a right angle relative to the excitation with bandpasses corresponding to 6 nm (10050 LH2), 7 nm (7050 HL), and 4 nm (7050 LL) for the excitation monochromator, and 12 nm (10050 LH2) and 14 nm (7050 HL and LL) for the emission monochromator. An excitation correction factor file was used to correct for the wavelength variability of the source lamp and excitation monochromator. This file was generated using a photodiode calibration kit consisting of a photodiode assembly and a DM303-P module that was rented from Horiba.
Pump–probe ultrafast transient absorption spectroscopy was carried out using a Helios femtosecond transient absorption spectrometer (Ultrafast Systems LLC, Sarasota, FL, USA) coupled to a laser setup that has been previously described.37,38 Surface Xplorer Pro 1.2.2.26 (Ultrafast Systems LLC, Sarasota, FL, USA) was used to correct for the dispersion in the transient absorption spectra. Samples having an OD between 0.2 and 0.5 in a 2 mm path cuvette at the carotenoid spectral origin (0–0) band were mixed continuously using a magnetic microstirrer to avoid photodegradation. The pump laser had an energy of 1 μJ/pulse focused on a 1 mm diameter spot, which corresponds to a laser intensity between 3.2 and 3.9 × 10¹⁴ photons/cm2. The integrity of the samples was assayed by taking steady-state absorption spectra before and after laser excitation.
Global fitting of the transient absorption data sets was performed in ASUFit 3.0 provided by Dr. Evaldas Katilius at Arizona State University and carried out according to a sequential excited state decay model which yielded evolution associated difference spectra (EADS).39 Reconstruction of the 1-T and fluorescence excitation spectra was done using Origin software version 9.
Computational Methods
Ground state geometries were generated using B3LYP/6-31G(d)40,41 methods as implemented within Gaussian 09.42 Excited state geometries were generated using single-configuration interaction (CIS) methods and full single CI.43 The effect of the solvent environment was simulated by using the polarizable continuum model (PCM).42,44−46
Spectroscopic properties were calculated using MNDO-PSDCI47−49 and equation of motion coupled-cluster singles and doubles (EOM-CCSD)50−52 methods. The MNDO-PSDCI methods are semiempirical and have been used successfully to study long-chain polyenes and carotenoids.47,53−55 The EOM-CCSD calculations were carried out using a D95 double-zeta basis set, but the size of the target systems limited the use of this method to only rhodopin.56
Results
Steady-State Absorption and Fluorescence Spectroscopy
The steady-state absorption spectra of rhodopin glucoside and rhodopinal glucoside recorded in carbon disulfide, benzyl alcohol, methanol, and acetonitrile are shown in Figure 2. The primary bands in these spectra represent an electronic transition from the ground S0 (11Ag–) state to the S2 (11Bu+) state. In any particular solvent, the spectrum of rhodopinal glucoside is shifted to longer wavelength by 30–40 nm compared to that of rhodopin glucoside. The spectrum of rhodopin glucoside displays well-resolved vibronic bands in all of the solvents, whereas the spectrum of rhodopinal glucoside is much less structured, except in carbon disulfide, where a shoulder on the long-wavelength side of the primary absorption band is observed. Also, the high polarizability of carbon disulfide (P(ε) = 0.354) results in a 30–40 nm red shift of the spectra of rhodopin glucoside and rhodopinal glucoside compared to their spectra recorded in the less polarizable solvents, acetonitrile (P(ε) = 0.210) and methanol (P(ε) = 0.202). Benzyl alcohol, which has a polarizability value (P(ε) = 0.314) between those of carbon disulfide and methanol or acetonitrile, red shifts the spectrum of rhodopinal glucoside more than for rhodopin glucoside (Figure 2). This is undoubtedly due to the presence of the aldehyde group on rhodopinal glucoside, which interacts more strongly with this solvent than the methyl group in the same position on rhodopin glucoside. Except for a small change in relative intensities of the vibronic bands of rhodopin glucoside, the spectra are not significantly affected by changing the solvent from a protic (methanol) to a nonprotic (acetonitrile) polar solvent. It should be mentioned that the glucoside moiety has no effect on the positions and intensities of the absorption bands. The spectra of rhodopin glucoside and rhodopinal glucoside are indistinguishable from the corresponding spectra of rhodopin and rhodopinal.3
The absorption spectra of the LH2 complexes from Rbl. acidophilus 10050, 7050 HL, and 7050 LL recorded at room temperature are shown in Figure 3. All spectra show the strong S0 (11Ag–) → S2 (11Bu+) transition characteristic of carotenoids in the 400–550 nm region. Also, the positions of the BChl Soret band at ∼375 nm and the BChl QX band at ∼590 nm are nearly identical for all of the complexes. However, one BChl QY band of the LH2 complex is located at 800 nm, and the other is at 859 nm for strain 10050, at 855 nm for 7050 HL, and at 823 nm for 7050 LL. In addition, compared to the spectrum of the LH2 complex from strain 10050, the spectra of the LH2 complexes from 7050 HL and 7050 LL show more absorption in the region between 550 and 600 nm where the spectrum of the carotenoid partially overlaps with the BChl QX band at ∼590 nm. This is due to the presence of rhodopinal and rhodopinal glucoside in the LH2 complexes from strain 7050. These carotenoids are not present in the LH2 complex of Rbl. acidophilus 10050. It should be mentioned that the growth conditions for the cells of Rbl. acidophilus 7050 will always result in a very small amount of the B800-820 LH2 complex in HL cells due to the effect of light shading in the culture media. Likewise, a small amount of B800-850 LH2 complex will be present in the LL cells due to the fact that there is a limit to how low the light intensity can be adjusted to ensure a realistic amount of bacterial growth. A spectral analysis of the BChl absorption bands in the QY region (Figure S1 in the Supporting Information) shows that this amount is less than 20%. Moreover, it should be noted that the regulatory pathways for the switch from rhodopin glucoside to rhodopinal glucoside and from B800-850 to B800-820 are independent of each other. During growth at progressively decreasing light intensity, the carotenoid pathway switch is activated before, i.e., at a higher light intensity than the switch that controls the type of complex present.3 Therefore, it is possible to obtain a B800-850 complex that contains a significant amount of rhodopinal glucoside as is the case for LH2 complex isolated from 7050 HL cells (Table 1). The pronounced similarity in the structures of the B800-850 and B800-820 protein complexes precludes complete separation by chromatographic techniques. However, by a judicious choice of excitation and detection wavelengths in the steady-state and transient absorption spectroscopic experiments, the properties of the individual pigment–protein complexes can be studied.
Figure 3.

Normalized steady-state absorption spectra of the LH2 complexes from Rbl. acidophilus 10050, 7050 LL, and 7050 HL recorded in 2 mm path length cuvettes at room temperature.
Table 1. Molar Percentages of the Carotenoid Pigments in the LH2 Complexes Isolated from Rbl. acidophilus 10050, 7050 HL, and 7050 LLa.
| molar
percentage |
|||
|---|---|---|---|
| 10050 | 7050 HL | 7050 LL | |
| rhodopin glucoside | 52 | 28 | 5 |
| rhodopin | 40 | 28 | 10 |
| rhodopinal glucoside | ndb | 32 | 58 |
| rhodopinal | nd | nd | 7 |
| lycopene | 8 | 8 | 13 |
| unknown | nd | 4 | 8 |
Percentages are based on the average of multiple extractions and HPLC analyses. Uncertainties in the values, based on standard deviations from the mean, were equal to or less than two percentage points.
Not detected.
The carotenoid composition of the different LH2 complexes was determined by HPLC analyses carried out as illustrated in Figure 4. The molar percentages of the carotenoids in the different LH2 complexes are given in Table 1. These data are in agreement with previous reports that LL grown Rbl. acidophilus 7050 cells display a significant increase in total rhodopinal (defined in this context as rhodopinal plus rhodopinal glucoside) concurrent with a decrease in total rhodopin (defined here as rhodopin plus rhodopin glucoside) compared to that found in the bacterium grown under HL conditions.3,4 Total rhodopinal in the LH2 complexes increased from 32% in the 7050 HL sample to 65% (58% + 7%) in the 7050 LL sample (Table 1). Concurrently, total rhodopin in the LH2 complexes decreased from 56% (28% + 28%) to 15% (5% + 10%) when cells were grown using LL (Table 1). As previously reported3,33 and confirmed by the present work, the LH2 complex from Rbl. acidophilus strain 10050 did not contain any rhodopinal or rhodopinal glucoside.
Figure 4.

HPLC chromatograms of the pigment extract from Rbl. acidophilus 7050 LH2 complexes prepared from cells grown under LL (top trace) and HL (bottom trace) conditions. Both chromatograms were detected at 502 nm. The major pigments were identified as follows: 1, rhodopinal glucoside; 2, rhodopinal; 3, rhodopin glucoside; 4, BChl a; 5, rhodopin; and 6, lycopene. The minor unlabeled peaks are primarily cis isomers of the major carotenoids.
The fluorescence spectra of the LH2 complexes recorded using 591 nm excitation, which excites the BChl QX band, are shown in Figure 5 (blue traces). The maximum wavelength of emission occurs at 870 nm for the LH2 complexes from 10050 and 7050 HL, and at 860 nm for the LH2 complex from 7050 LL. Fluorescence spectra were also recorded using excitation wavelengths of 560, 570, 580, and 590 nm, but no changes in the position or shape of the resulting emission spectra were observed. Fluorescence excitation spectra of the LH2 complexes are also shown in Figure 5 (red traces). These spectra were recorded by detecting the fluorescence from the samples at the maximum wavelength of BChl emission, but identical lineshapes were observed using any detection wavelength between 820 and 880 nm (Figure S2 in the Supporting Information).
Figure 5.

Emission (blue), excitation (red), and 1-T (black) spectra of LH2 complexes obtained from Rbl. acidophilus 10050, 7050 LL, and 7050 HL. The green line shows the ratio of the normalized excitation and 1-T spectra and in the region of carotenoid absorption gives a quantitative measurement of the carotenoid-to-BChl energy transfer efficiency.
It is somewhat surprising that the fluorescence maximum of the B800-820 complex occurs at 860 nm rather than closer to the 820 nm QY band. However, as mentioned above, previous work detailing the effect of light intensity and temperature on cell growth and the formation of the B800-820 complex indicated that the conversion of rhodopin to rhodopinal occurs prior to the conversion of B800-850 to B800-820.3 Therefore, it is likely that the fraction of B800-850 complex in our LL sample (see Figure S1 in the Supporting Information) contains rhodopinal and represents the main emission component. This interpretation rationalizes the appearance of the fluorescence maximum at 860 nm and the fluorescence excitation spectra not being affected by changing the detection wavelength.
The absorption spectra, expressed as 1-T, where T is transmittance (black traces), and the excitation spectra (red traces) were normalized at the BChl QX and QY bands, and the ratio of the excitation and 1-T spectral amplitudes were determined in the region from 300 to 650 nm (green traces). These traces represent the efficiency of excitation energy transfer (EET) to BChl, which was found in the carotenoid absorption region between 425 and 550 nm to be in the range of 55% to 61% for the 10050 LH2 complex consistent with previously published results.33,34 The LH2 complexes from 7050 HL and 7050 LL displayed higher carotenoid-to-BChl EET efficiencies and were in the range of 63% to 71% and 76% to 86%, respectively.
HPLC analysis (Table 1) revealed that the LH2 samples from the 7050 samples contain both rhodopin and rhodopinal (and their associated glucosides) in different amounts. Therefore, in order to examine the contributions of these individual chromophores to the spectra of the pigment–protein complexes, reconstructions of the 1-T (left panel, Figure 6) and fluorescence excitation (right panel, Figure 6) spectra were carried out based on the absorption spectra of the HPLC-purified carotenoids recorded in benzyl alcohol. The spectra of the carotenoids in the LH2 protein (Figure 3) are well-reproduced by their spectra in benzyl alcohol (Figure 2) due to the fact that this solvent has a polarity and polarizability similar to the average of those of the protein in the binding environment of the carotenoid.33 The BChl Soret and QX bands were modeled by sums of Gaussian functions. The spectral reconstructions yielded the specific carotenoid-to-BChl EET efficiencies for rhodopin and rhodopinal from the ratios of the individual fluorescence excitation and 1-T bands in the profiles. (Because rhodopin and rhodopinal have identical absorption (and 1-T) spectra as their corresponding glucoside derivatives,3 in this context and unless explicitly noted otherwise, any statements about the spectra of rhodopin or rhodopinal should be taken to mean the combined contribution from the chromophores associated with both the glucoside and non-glucoside molecules.) The EET efficiency for rhodopin in the LH2 complex from the 10050 sample becomes evident from a side-by-side, horizontal comparison of the amplitudes of the 1-T and fluorescence excitation spectra (Figures 6A and 6B) in the region of carotenoid absorption, and was found to be 56 ± 1%, consistent with previous reports.33,34 A similar analysis was carried out to obtain the values for the individual carotenoid-to-BChl EET efficiencies in the LH2 complex from the 7050 LL sample (Figures 6C and 6D), which were found from the spectral reconstruction to be 54 ± 5% for rhodopin (orange traces) and 97 ± 2% for rhodopinal (purple traces). The computed individual carotenoid-to-BChl EET efficiencies for the LH2 complex prepared from 7050 HL cells (Figures 6E and 6F) were 50 ± 3% for rhodopin (orange traces) and 98 ± 2% for rhodopinal (purple traces), consistent with the values determined for the LH2 complex from 7050 LL. These results are summarized in Table 2 and reveal the remarkable finding that rhodopinal in the LH2 complex from Rbl. acidophilus 7050 transfers essentially all of its excited state energy to BChl with minimal loss through internal conversion to the ground state. This stands in striking contrast to rhodopin in the LH2 complexes from all Rbl. acidophilus strains, which transfers energy to BChl with only ∼50% efficiency.
Figure 6.

Reconstruction of the (A, C, E) 1-T and (B, D, F) fluorescence excitation spectra (black traces) of the LH2 complexes from Rbl. acidophilus 10050, 7050 LL, and 7050 HL. The 1-T spectra of purified rhodopin glucoside (orange traces) and rhodopinal glucoside (purple traces) were recorded in benzyl alcohol and summed to generate the reconstructed spectra (red traces). The BChl bands in the Soret region between 300 and 400 nm and in the QX region near 600 nm were modeled using Gaussian functions (green lines) for simplicity.
Table 2. Efficiency of Carotenoid-to-BChl Excitation Energy Transfer Derived from the Amplitudes of the Spectral Profiles Needed To Reconstruct the Fluorescence Excitation and 1-T Spectra of the LH2 Complexes from Rbl. acidophilus 10050, 7050 LL, and 7050 HL As Shown in Figure 6a.
| amplitude |
|||
|---|---|---|---|
| fluorescence excitation | 1-T | EET efficiency (%) | |
| 10050 | |||
| rhodopin | 0.44 ± 0.01 | 0.78 ± 0.01 | 56 ± 1 |
| 7050 LL | |||
| rhodopin | 0.13 ± 0.01 | 0.24 ± 0.01 | 54 ± 5 |
| rhodopinal | 0.309 ± 0.005 | 0.320 ± 0.005 | 97 ± 2 |
| 7050 HL | |||
| rhodopin | 0.22 ± 0.01 | 0.44 ± 0.01 | 50 ± 3 |
| rhodopinal | 0.185 ± 0.003 | 0.189 ± 0.003 | 98 ± 2 |
The uncertainties in the amplitudes were obtained by comparing the reconstructed spectra with those experimentally recorded. Those values were then propagated to obtain the uncertainties in the EET efficiencies.
Transient Absorption Spectroscopy
Transient Absorption and Dynamics of Carotenoids in Solution
Figure 7 shows ultrafast time-resolved transient absorption spectra of rhodopin glucoside (left panels) and rhodopinal glucoside (right panels) recorded in carbon disulfide, benzyl alcohol, methanol, or acetonitrile at various delay times after laser excitation. Upon excitation, an immediate onset of bleaching of the strongly allowed S0 (11Ag–) → S2 (11Bu+) transition occurs, resulting in a negative signal in the 450–550 nm region. In addition, a strong positive signal in the 520–700 nm region appears that can be attributed to excited state absorption (ESA) associated with the S1 (21Ag–) → SN transition. This suggests that the decay of the S2 state via internal conversion to populate the S1 state is occurring on the same time scale as the instrument response time of ∼100 fs. Similar to the steady-state absorption spectra of the carotenoids, the excited state absorption bands shift to longer wavelength and are broader as the polarizability of the solvent increases. The spectra are broadest and most red-shifted in the highly polarizable solvent, carbon disulfide, compared to the spectra recorded in the other solvents. A similar effect is evident in the spectrum of rhodopinal glucoside in carbon disulfide and benzyl alcohol (Figure 7, right panels), where it is also clear that the spectral bands are broader overall than the spectra of rhodopin glucoside in the same solvents (Figure 7, left panels). Also, an additional peak at ∼740 nm, which is not found in the spectra of rhodopin glucoside, is seen in the transient absorption spectra from rhodopinal glucoside. Unlike the main S1 (21Ag–) → SN transient absorption band, this feature is insensitive to the polarizability of the solvent, and therefore appears more separated from the main ESA feature in methanol and acetonitrile compared to in carbon disulfide.
Figure 7.

Transient absorption spectra of rhodopin glucoside and rhodopinal glucoside in carbon disulfide, benzyl alcohol, methanol, and acetonitrile recorded at room temperature using the indicated excitation wavelengths.
In order to obtain detailed information regarding the dynamics of the excited states of the carotenoids, global fitting according to a sequential decay model, resulting in evolution associated difference spectra (EADS), was carried out on the transient absorption data sets. EADS components obtained from this fitting are shown in Figure 8. For both rhodopin glucoside and rhodopinal glucoside in all four solvents, the first EADS has a very short lifetime ranging from <100 to 120 fs, and the profile of this component shows bleaching of the ground state S0 (11Ag–) → S2 (11Bu+) absorption and stimulated emission from the S2 (11Bu+) state. It is important to point out here that although the best global fitting results are achieved in some cases using time constants smaller than 100 fs, these very small values cannot be taken factually because the instrument response time of the laser spectrometer is on the order of ∼100 fs. Hence, these values are specified as <100 fs. More precise values in this time domain were reported by Macpherson et al.33 who used fluorescence upconversion spectroscopy and found the S2 (11Bu+) lifetime of rhodopin glucoside in benzyl alcohol to be 124 ± 8 fs. The second EADS component for both molecules has a time constant that ranges from 330 to 530 fs in the different solvents. This component can be assigned to a transition from a vibronically hot S1 (21Ag–) → SN excited singlet state due to the fact that its broad ESA peak narrows and shifts to shorter wavelength upon decaying to form the third EADS component.57−61 The second and third EADS for rhodopinal glucoside in all solvents also show the additional peak at ∼740 nm alluded to above, which is not found in the spectra of rhodopin glucoside. The fact that this feature does not depend on solvent polarity indicates that it is not associated with the formation of an intramolecular charge transfer (ICT) state in rhodopinal glucoside.62,63
Figure 8.

Evolution associated difference spectra (EADS) obtained from globally fitting the transient absorption data sets from rhodopin glucoside and rhodopinal glucoside in carbon disulfide, benzyl alcohol, methanol, and acetonitrile given in Figure 7.
The band profile of the third EADS component for both molecules is very strong and well-known to be associated with ESA from the relaxed S1 (21Ag–) state making a transition to a higher excited singlet state. The lifetime of this component for rhodopin glucoside in all solvents was found to be in the narrow range of 3.8 to 4.3 ps with no obvious effect of solvent polarity on the value. However, the S1 (21Ag–) lifetime for rhodopinal glucoside in the polar solvents methanol and acetonitrile was 3.7 and 3.9 ps respectively, which are slightly shorter than the 4.4 and 4.7 ps values found for the molecule in the less polar solvents, benzyl alcohol and carbon disulfide, respectively. The fact that the lifetime of this component is reasonably similar for both rhodopin glucoside and rhodopinal glucoside indicates that neither the configuration, which is 13-cis for rhodopinal glucoside in solution compared to all-trans for rhodopin glucoside (Figure 1A), nor the presence of the aldehyde group at carbon C20 on rhodopinal glucoside compared to the methyl group at the same position on rhodopin glucoside results in any significant change in the dynamics of the S1 state that would impact its role in light-harvesting.
The fourth EADS component of both molecules in all solvents has a lifetime that ranges from 5.9 to 15.3 ps. This component is rather weak, but displays negative features associated with ground state bleaching as well as a positive feature on the short wavelength side of the main S1 → SN absorption profile. The negative features indicate that some fraction of the carotenoid population is still in an excited state. The short wavelength band is reminiscent of the S* state initially proposed to be an intermediate state between the S1 (21Ag–) and S2 (11Bu+) excited singlet states that is involved in both S2 (11Bu+) depopulation and carotenoid triplet state formation in light harvesting complexes.64−66 Subsequent work59 on several open-chain carotenoids has shown that the S* yield is larger for molecules with longer π-electron conjugation suggestive of it being associated with a twisted molecular conformation of the carotenoid in the S1 (21Ag–) state.59,67 Finally, a very weak, infinitely long-lived component was necessary to obtain a completely satisfactory fit to the data sets.
Transient Absorption of LH2 Complexes
The LH2 complexes were excited in the region of carotenoid absorption at either 525 or 570 nm, and then transient absorption spectra were recorded at various delay times after the pump laser pulse (Figure 9). The LH2 complex from Rbl. acidophilus 10050 displayed transient absorption profiles (top panel of Figure 9) that were similar to previously reported spectra and include the instantaneous onset of bleaching of the carotenoid ground state spectrum and broad positive ESA at intermediate times, followed by the appearance of a strong narrow S1 → SN transition at ∼580 nm at later times.34 The HPLC pigment analysis of the LH2 complex from strain 10050 (Table 1) revealed that the carotenoid composition consists of roughly equal amounts of rhodopin and rhodopin glucoside with a small amount of lycopene, all of which have identical absorption spectra. Using this information regarding the spectra of the carotenoids in the LH2 complex from Rbl. acidophilus 10050 as a control, the features attributable to rhodopin and rhodopinal can be distinguished in the transient spectra of the LH2 complexes prepared from 7050 LL and 7050 HL cells, which contain a mixture of these carotenoids (Table 1). (Recall that any reference to rhodopin or rhodopinal in this context should be taken to mean the combined spectral properties of the molecules and their respective glucosides, which are indistinguishable.) Laser excitation at 525 nm of the 7050 LL or 7050 HL LH2 complexes results in a combination of transient absorption signals from rhodopin and rhodopinal because both molecules absorb at this wavelength. Selective excitation of rhodopinal can be achieved by tuning the pump laser to 570 nm, which is a wavelength where rhodopin does not absorb. (See Figure 6.)
Figure 9.

Transient absorption spectra of LH2 complexes from Rbl. acidophilus 10050, 7050 LL, and 7050 HL recorded at room temperature using the indicated excitation wavelengths.
Transient absorption spectra from the 7050 LL and HL LH2 complexes excited at 525 nm (combined rhodopin plus rhodopinal excitation) or at 570 nm (selective rhodopinal excitation) are shown in Figure 9. Similar to the transient absorption spectra from strain 10050, the transient spectra recorded for these LH2 complexes at a 50 fs delay time (black traces in Figure 9) have negative features corresponding to the bleaching of the carotenoid S0 (11Ag–) → S2 (11Bu+) ground state absorption bands. In addition, there is a positive signal in the 540–700 nm region which represents an S1 (21Ag–) → SN transition indicating very fast decay of the S2 (11Bu+) state to populate the S1 (21Ag–) state of the carotenoid. In the 200 fs delay time spectra (red traces), the ground state bleaching has partially recovered, indicative of energy transfer to BChl, but the strong positive S1 (21Ag–) → SN absorption band has gained amplitude and is broader compared to the subsequent 1 ps delay time spectrum (green traces). The gain in amplitude of the feature associated with the S1 (21Ag–) → SN transition indicates that internal conversion from S2 to populate the S1 state is competing effectively with EET from S2 to BChl.
A close examination of the 1 ps time delay (green trace) spectrum recorded for the 7050 LL LH2 excited at 525 nm (second panel in Figure 9) shows a narrow positive feature at ∼580 nm and a broader one at ∼630 nm. Comparison of this spectrum with those taken at the same time delay from the 10050 LH2 excited at 525 nm (selective rhodopin excitation, upper panel of Figure 9) and the 7050 LL LH2 sample excited at 570 nm (selective rhodopinal excitation, third panel of Figure 9) reveals that the narrow peak at ∼580 nm in the spectrum from the 7050 LL LH2 excited at 525 nm is due to the S1 → SN transition of rhodopin whereas the ∼630 nm peak is from rhodopinal. This is expected because excitation of the 7050 LL sample using 525 nm light excites both carotenoids which are present in this LH2 sample (Table 1). This interpretation is supported by the transient absorption spectra resulting from 525 nm excitation of the 7050 HL LH2 complex (fourth panel of Figure 9). Note that the narrow positive feature at ∼580 nm in the 1 ps time delay spectrum (green trace) attributable to the S1 → SN transition of rhodopin is much more pronounced relative to the broader band at ∼630 nm associated with rhodopinal. This is because the LH2 complex from 7050 HL contains 56% total rhodopin compared to the 7050 LL LH2 sample, which has only 15% rhodopin (Table 1). As expected, selective excitation of rhodopinal at 570 nm in the 7050 HL LH2 sample (bottom panel of Figure 9) shows no sign of the narrow S1 → SN feature belonging to rhodopin. The major positive band in the 1 ps time delay spectrum (green trace) is that of the S1 → SN ESA of rhodopinal.
The 5 ps delay time spectra of the 10050 and 7050 LL LH2 samples (blue traces in Figure 9) show significantly diminished carotenoid ground state bleaching and reduced S1 → SN ESA indicating that a substantial amount of the carotenoid S1 state excited state population either has been transferred to BChl or has decayed via internal conversion back to the ground state. Also in this time frame, an additional peak appears at ∼560 nm on the short wavelength side of the main ESA peak and persists longer than 100 ps (magenta trace). This is very likely attributable to a carotenoid triplet state.68
Global Analysis of Transient Absorption Data
The EADS components of the LH2 complexes obtained from a global fitting of the transient absorption data sets are shown in Figure 10. The fitting of the transient absorption spectra required five components, the first of which has a lifetime <100 fs for all the LH2 complexes and has features associated with the bleaching of the ground state absorption as well as stimulated emission from S2 (11Bu+). This is consistent with the value of 57 fs reported by Macpherson et al.33 for the S2 lifetime of rhodopin in the LH2 complex from Rbl. acidophilus 10050. The second EADS component (red traces in Figure 10) has a lifetime ranging from 250 to 490 fs and has broad features in the carotenoid absorption region characteristic of vibronically hot S1 (21Ag–) → SN excited singlet state transition. This second EADS has weaker negative bands in the carotenoid ground state absorption region than the first EADS, indicating that some of the carotenoid molecules have returned to the ground state via EET from the S2 state to BChl. Also evident in the second EADS is a small negative dip at ∼590 nm appearing on the broad positive ESA spectrum. This is due to the bleaching of the BChl QX band brought about by EET to BChl from the carotenoids. As the second EADS component decays into a third (green lines in Figure 10), the line shape narrows considerably for the 10050 LH2 excited at 525 nm and a strong band associated with the S1 (21Ag–) → SN transition is evident at 580 nm. This line narrowing is accompanied by a decrease in the extent of ground state bleaching indicating that more of the carotenoid molecules have returned to the ground state, perhaps by EET from the vibronically hot S1 state. This third component decays in 3.0 ps for the 10050 LH2 and represents the S1 lifetime of rhodopin in the LH2 pigment–protein complex. The peak at 580 nm has much less amplitude in the third EADS component from the 7050 LL LH2 sample obtained from data also using 525 nm excitation (green trace in the second panel of Figure 10). This is due to the fact that this sample has much less total rhodopin (rhodopin plus rhodopin glucoside) than the 10050 LH2. In fact, the peak at 580 nm is completely absent in the third EADS obtained from data using 570 nm excitation (green trace in the third panel of Figure 10). Instead, a broad line shape peaking at ∼620 nm and belonging to rhodopinal is observed. This is because excitation at 570 nm selectively excites rhodopinal. Note that the lifetime of this component is 1.2 ps in the 7050 LL LH2 and 1.3 ps in the 7050 HL LH2, which is significantly shorter than the average value of 4.1 ps found for rhodopinal in the different solvents and also shorter than the value of 3.0 ps found for rhodopin in the LH2 complex from strain 10050. (See Tables 3 and 4.) This is suggestive of significantly faster EET to BChl from the S1 state of rhodopinal compared to rhodopin.
Figure 10.

Evolution associated difference spectra (EADS) obtained from globally fitting the transient absorption data sets of LH2 complexes from Rbl. acidophilus 10050, 7050 LL, and 7050 HL given in Figure 9.
Table 3. Lifetimes of the EADS Components Obtained by Global Fitting of the Transient Absorption Data Sets Recorded for Rhodopin Glucoside and Rhodopinal Glucoside in Various Solventsa.
| lifetime (ps) |
|||||
|---|---|---|---|---|---|
| carotenoid | solvent | τ1 | τ2 | τ3 | τ4 |
| rhodopin glucoside | CS2 | 0.10 ± 0.01 | 0.53 ± 0.05 | 4.2 ± 0.3 | 15 ± 1 |
| benzyl alcohol | <0.10 | 0.37 ± 0.02 | 4.2 ± 0.2 | 7 ± 1 | |
| MeOH | <0.10 | 0.43 ± 0.04 | 4.3 ± 0.2 | 7.3 ± 0.2 | |
| ACN | <0.10 | 0.39 ± 0.01 | 3.8 ± 0.1 | 8.4 ± 0.9 | |
| rhodopinal glucoside | CS2 | <0.10 | 0.38 ± 0.03 | 4.7 ± 0.3 | 15.3 ± 0.3 |
| benzyl alcohol | <0.10 | 0.35 ± 0.01 | 4.4 ± 0.2 | 9 ± 1 | |
| MeOH | 0.11 ± 0.01 | 0.33 ± 0.02 | 3.7 ± 0.1 | 5.9 ± 0.6 | |
| ACN | 0.12 ± 0.01 | 0.52 ± 0.03 | 3.9 ± 0.2 | 8 ± 1 | |
The uncertainties in the values were obtained by exploring the region of solution for each parameter according to the goodness of fit and minimization of the residuals. An infinitely long (on the time scale of the experiment) component was required for a good fit in all cases. CS2, carbon disulfide; MeOH, methanol; ACN, acetonitrile.
Table 4. Lifetimes of the EADS Components Obtained by Global Fitting of the Transient Absorption Data Sets Recorded for the LH2 Complexes from Rbl. acidophilus 10050, 7050 LL, and 7050 HLa.
| lifetime
(ps) |
|||||
|---|---|---|---|---|---|
| LH2 | excitation λ (nm) | τ1 | τ2 | τ3 | τ4 |
| 10050 | 525 | <0.10 | 0.32 ± 0.02 | 3.0 ± 0.1 | 27 ± 3 |
| 7050 LL | 525 | <0.10 | 0.49 ± 0.05 | 2.6 ± 0.2 | 13 ± 1 |
| 570 | <0.10 | 0.25 ± 0.02 | 1.2 ± 0.1 | 18 ± 2 | |
| 7050 HL | 525 | <0.10 | 0.4 ± 0.1 | 2.7 ± 0.2 | 15 ± 2 |
| 570 | <0.10 | 0.36 ± 0.01 | 1.3 ± 0.1 | 18 ± 2 | |
The uncertainties were obtained by exploring the region of solution for each parameter according to the goodness of fit and minimization of the residuals. An infinitely long (on the time scale of the experiment) component was required for a good fit in all cases.
The fourth EADS component has a lifetime in the range 13 to 27 ps for all the data sets and a significantly diminished overall amplitude relative to the preceding EADS profiles. The lifetime of this component, along with the clearly evident positive band on the short wavelength side of the feature attributable to the main S1 → SN absorption band, and the wavy features in the region of the carotenoid ground state absorption are all characteristics of the S* state in accord with previous reports.34,59,64−66,69,70 The fifth and final EADS component has an infinitely long lifetime on the time scale of the experiment and was necessary to obtain a satisfactory fit in all cases. The primary spectral feature in this last EADS component is the negative amplitude at 590 nm, which corresponds to the bleaching of the BChl QX band that is expected to persist on the order of nanoseconds until the S1 state of BChl relaxes back to the ground state.
Quantum Computational Analysis
Quantum computations were carried out to augment the experimental results, but in order to make them tractable, the majority were carried out on the model chromophores shown in Figures 11C and 11D. The model chromophores include the entire central polyene portion of rhodopin and rhodopinal, but replace the glucoside and aliphatic end groups with methyl groups. The resulting model polyenes have Cs or C2h symmetry, and this symmetry, in combination with the smaller size, allows higher quality calculations to be carried out than would otherwise be possible. Test calculations on the full and model chromophores indicate that the end groups do not have a significant impact on the atomic charges other than small changes in the charges on the carbon atoms at the ends of the polyene chains. Single CI calculations on the full system (Figures 11A and 11B) and the model systems (Figures 11C and 11D) demonstrate that the end groups create less than a 0.02 eV shift in the transition energies. This conclusion is consistent with the observation that the absorption spectra of rhodopin and rhodopin glucoside are indistinguishable.3
Figure 11.

B3LYP/6-31G(d) calculated structures of (A) trans-rhodopin glucoside, (B) trans-rhodopinal glucoside, (C) trans-rhodopin, (D) trans-rhodopinal, (E) the S1 relaxed excited state of trans-rhodopinal, (F) 13-cis-rhodopinal, and 13-cis-rhodopinal model. The structures given in panels C, D, E, and G are simplified, higher-symmetry analogues used in the MNDO-PSDCI, EOM-CCSD and CAS-SCF theoretical calculations, which retain the full π-system. The calculated vacuum dipole moments (in debyes (D)) and the dipole moment vectors (the length is not relevant) are shown underneath those structures that have a dipole moment. The dashed ellipse in panel D shows the primary repulsive atom–atom interaction responsible for making the cis configuration more stable than the trans configuration by ∼8 kJ/mol in nonpolar solvent (n-hexane) and ∼8.5 kJ/mol in polar solvent (acetonitrile).
Discussion
Carotenoid Structure, Energy Levels, and Electronic Transitions
Configuration of Rhodopinal in Solution
Although a primary goal of this work is to understand the photophysical properties of rhodopinal in LH2 complexes, the process is started by identifying the geometry of rhodopinal in solution. Previous studies have proposed that rhodopinal acquires a cis configuration in solution.19,71−73 Based on density functional theory and an analysis of the absorption spectra, it is demonstrated here that rhodopinal takes on a cis configuration in both nonpolar and polar solvent. The all-trans rhodopinal chromophore exhibits just one significant intramolecular repulsion involving the interaction of the aldehyde hydrogen with the nearest hydrogen atom on the main polyene chain. This repulsive interaction is marked using a dashed ellipse in Figure 11D. The repulsion is both electrostatic (both atoms have positive charge) and steric (the atoms are separated by ∼2 Å). There are two dihedral distortions that can remove this repulsion. The aldehyde group can rotate out of plane, or the double bond adjacent to the aldehyde group can rotate ∼180° to create a cis linkage near the center of the polyene chain. Calculations indicate that the latter is energetically more favorable. Based on B3LYP/6-31G(d)/PCM calculations the resulting 13-cis configuration is more stable than the all-trans configuration by ∼8 kJ/mol in nonpolar solvent (n-hexane) and ∼8.5 kJ/mol in polar solvent (acetonitrile). This number is invariant to whether the calculation is done on the smaller model chromophore (Figure 11D) or the full chromophore (Figure 11B). The value in n-hexane increases to 9.3 kJ/mol when a much larger basis set [6-311+G(2d,p)] is used.
Experimental support for the 13-cis configuration of rhodopinal in solution is provided by comparing the excited state manifolds calculated for both the cis and the trans configurations with the experimental spectra. The results for n-hexane are shown in Figure 12. Note that there is a relatively strong vibronically resolved band at 28 kK (28,000 cm–1) observed in the experimental spectra (solid yellow). The MNDO-PSDCI calculations indicate that this band is associated with a 1Ag+ excited state (top right-hand panel of Figure 12), resulting in transition from the ground state that is often called the “cis-band”.74 It should be mentioned that the viability of the MNDO-PSDCI methods was explored by carrying out an EOM-CCSD calculation on rhodopin. The level ordering of the first eight excited singlet states was identical with the exception that the EOM-CCSD methods predicted that the 1Bu– state is higher in energy than the 1Bu+ state. The high relative intensity of the “cis-band” band provides spectroscopic evidence for a cis linkage near the center of the polyene chain.54 Very similar results are obtained for rhodopinal in acetonitrile. The combination of theory and experiment provide strong support for rhodopinal having a cis configuration in both polar and nonpolar solvent.
Figure 12.

Analysis of the excited state manifold responsible for the electronic absorption spectrum of rhodopinal in n-hexane (solid yellow spectra) based on MNDO-PSDCI theory. Four configurations (Figure 11) were investigated relative to experimental observations: trans-rhodopinal (upper left), 13-cis-rhodopinal (upper right), trans-rhodopinal in a corkscrew conformation (lower left), and 13-cis-rhodopinal in a corkscrew conformation (lower right). The corkscrew conformation was generated by adjusting the dihedral angles of the single bonds 10° from planar and the double bonds 5° from planar, with all dihedral distortions in the same direction. The cis configuration involves rotation of the double bond directly connected to the aldehyde group, identified using the torsional arrow in Figure 11D. The heights of the bars are proportional to the calculated oscillator strengths of the transitions, and the color reflects the ionic versus covalent character (Figure 13). The approximate symmetry is indicated for selected states, and 1 kilokayser (kK) = 1000 cm–1.
The computations suggest, however, that 13-cis-rhodopinal may form a corkscrew conformation to help stabilize the molecule in solution. A corkscrew conformation involves clockwise or counterclockwise dihedral distortion involving both single and double bonds, with a majority of the distortion in the single bonds.59 The change in geometry costs very little in terms of torsional distortion energy but provides intramolecular electrostatic stabilization in nonpolar solvent and solute–solvent stabilization in polar solvent. A modest corkscrew rotation of 10° in the single bonds and 5° in the double bonds generates improved agreement between experiment and theory (bottom panels in Figure 12). It should be emphasized that the same improvement in simulating the observed spectra is obtained by generating modest, random dihedral distortions, such as would be generated via thermal motions and occupation of low-frequency torsional modes.
Photophysical Properties of Rhodopinal in the LH2 Complex
The crystal structure of the B800-820 LH2 complex18 did not fully resolve the rhodopinal structure, but provided ample evidence that the structure is in an all-trans configuration. Given the above results that demonstrate that 13-cis-rhodopinal is more stable than trans-rhodopinal in solution, the question arises as to why an all-trans configuration for rhodopinal exists in the LH2 complex. There are a number of trivial reasons for this. First, the binding site for rhodopinal glucoside, which, as mentioned previously, is formed independently of, and prior to, the conversion of B800-850 to B800-820, must also serve as the binding site for rhodopin glucoside, whose most stable configuration is undisputedly all-trans. Second, the formation of rhodopinal requires enzymatic activity to attach the aldehyde group. The enzyme would likely release trans-rhodopinal glucoside into solution for assembly into the pigment–protein complex, and formation of the 13-cis-rhodopinal glucoside would require either an isomerase or >30 min for thermal isomerization to generate the equilibrium structure.
Theoretical Simulation of the Transient Absorption Spectra
As shown in Figure 7, there are significant differences in the transient absorption spectra of rhodopinal compared to rhodopin. In particular, the transient absorption maximum is red-shifted and an additional feature at ∼740 nm is observed for rhodopinal. To explore these differences theoretically, MNDO-PSDCI theory was used to calculate the energies and oscillator strengths for excitations from the ground state and the relaxed first excited state (Figure 13). The computations also simulated the transient absorption spectra based on the assumption that the origin states are the fully relaxed lowest-excited S1 (21Ag–) states generated using full single CI and acetonitrile as the solvent. However, the MNDO-PSDCI calculations are for vacuum conditions, and the effect of solvent is limited to the geometry of the relaxed origin state. The simulated spectra (Figure 14) reproduce the key features shown in Figure 7 by predicting both the red shift of the transient maximum and the farther red-shifted weaker band observed only for rhodopinal. The calculations of the S1 → SN transitions for rhodopin predict a maximum absorbance at ∼500 nm, which corresponds to the experimental band observed at ∼600 nm. This band is associated with a transition from the relaxed S1 (21Ag–) excited state to the 11th excited (51Bu) singlet state (Figure 13). This state also gives rise to a weakly allowed transition from the ground state calculated to be at ∼340 nm. This ensuing discussion of the transient absorption spectrum of rhodopinal in solution is limited to an analysis of the 13-cis configuration because it was demonstrated above that the 13-cis-isomer dominates in that environment (Figure 12). The strong band observed spectroscopically for rhodopinal at ∼630 nm (calculated to be at ∼520 nm) is associated with a transition from the relaxed S1 (21Ag–) excited state to the 11th excited (51Bu) singlet state (Figure 13), which is an assignment identical to that for the intense band of rhodopin. The major difference is a lower energy transition calculated to be at ∼680 nm and experimentally observed at ∼740 nm. This more red-shifted band is associated with a transition from the 21Ag– excited state to the eighth excited (51Ag+) singlet state (Figure 13). Durchan et al.75 reported similar red-shifted transient absorption bands from 8′-apo-β-carotenal and also interpreted the results in terms of a transition from the S1 (21Ag–) state to a higher Ag+ state. Moreover, they proposed that the allowedness for the transition arises due to the carbonyl group introducing asymmetry into the conjugated polyene system. The presence of asymmetry in the molecule would have the effect of relaxing the selection rules that render the transition forbidden in more symmetric, linear carotenoids, e.g., rhodopin.
Figure 13.
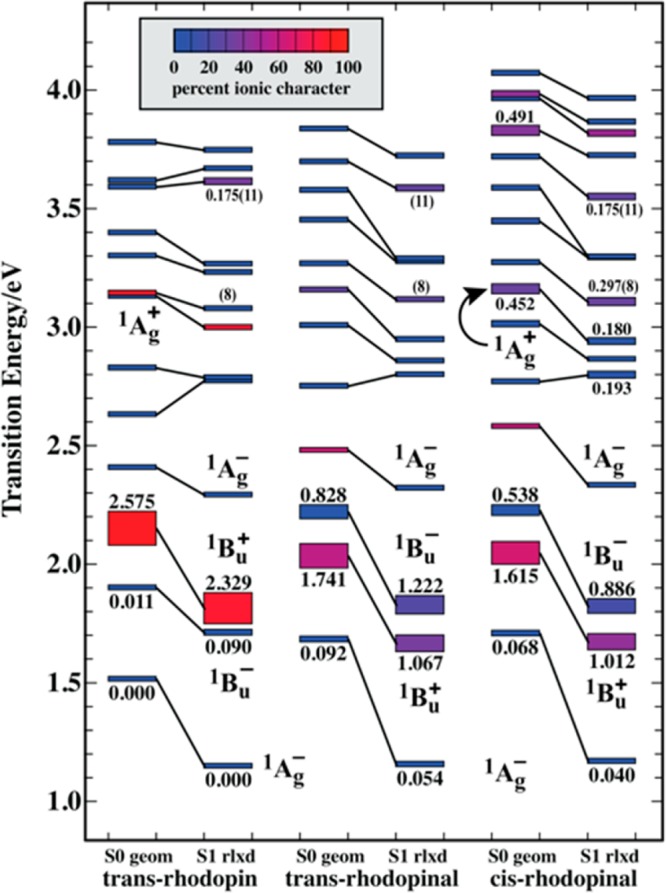
Excited state ππ* level ordering for trans-rhodopin, trans-rhodopinal, and 13-cis-rhodopinal for excitations from the ground state for the equilibrium ground state conformation (S0 geom) and the relaxed first excited singlet conformation (S1 rlxd). The energies and oscillator strengths were calculated based on MNDO-PSDCI theory using a CI basis set of the 10 highest energy filled π orbitals and the 10 lowest energy unfilled π orbitals. The stationary states are represented by rectangles where the height is proportional to the oscillator strength, and the color reflects the ionic versus covalent character of the state (see inset). The symmetry labels are approximate. The values in parentheses index electronic states 8 and 11 discussed in the text.
Figure 14.

Simulation of the S1 to SN spectra of trans-rhodopin (top), trans-rhodopinal (middle), and 13-cis-rhodopinal (bottom) based on MNDO-PSDCI theory (full single and double configuration interaction involving the 11 highest energy filled and 11 lowest energy unfilled π orbitals). All calculations assumed the S1 relaxed excited state geometries from Figure 13. The horizontal axis is linear in energy, where 1 kilokayser (kK) = 1000 cm–1, and the corresponding wavelength is marked as an inset in green.
Although there are higher energy bands calculated to be present only in 13-cis-rhodopinal (compare the middle and bottom spectra in Figure 14), the above-mentioned red-shifted band calculated to be at ∼680 nm appears to be present in both cis- and trans-rhodopinal. This observation can be traced to the fact that, whereas a transition from the ground S0 (11Ag–) state to the 51Ag+ state only has intensity in molecules with cis configurations, hence its designation as the “cis-band”, a transition from the S1 (21Ag–) excited state is strong for both trans- and cis-rhodopinal. Therefore, the additional red-shifted band seen only in the transient absorption spectrum of rhodopinal in solution is due to the presence of the aldehyde group on the molecule, and not to the configuration of the carotenoid.
Energy Transfer in the LH2 Complexes
Reconstruction and comparison of the 1-T and fluorescence excitation spectra from the LH2 complexes (Figures 5 and 6) show clearly that rhodopinal is much more efficient than rhodopin at transferring excited state energy to BChl. The precise factors responsible for this effect can be obtained from a consideration of the rate constants for de-excitation of the carotenoid excited states derived from the global fitting analysis.
The S1 and S2 states of carotenoids represent important donor excited states for EET to BChl. These routes are represented in Figure 15 by the rate constants kET1 and kET2, respectively. Deactivation of these two excited states may also occur via internal conversion, and these processes are indicated in the figure by the rate constants, k10 and k21. It is important to mention here that broadband 2D electronic spectroscopic results provide compelling evidence for the participation in EET of a dark intermediate state of the carotenoid having an energy in the vicinity of the state associated with the QX transition of BChl.35 This dark state was reported to be populated in 21 fs and depopulated in 62 fs. Both of these times are shorter than the ∼100 fs time resolution of the laser spectrometer used in the present work. Hence, the rate constant kET2 illustrated in Figure 15 should be interpreted as including the kinetics of this dark state in addition to those of S2.
Figure 15.

Pathways of energy transfer in the LH2 complex. a, absorption; ta, transient absorption. Dashed arrows indicate radiationless processes.
The total EET efficiency, ϕET, resulting from both the S1 and S2 pathways is given by the expression
| 1 |
where the rate constants correspond to the processes illustrated in Figure 15. The rate constants can be computed from the lifetimes of the S1 and S2 excited states measured in solution, τSiSOLN, and in the LH2 complexes, τSi. The relevant expressions are34
| 2 |
and
| 3 |
Tables 3, 4, and 5 summarize the lifetimes obtained from the global fits and the rate constants and efficiencies obtained either from the data presented here and using eqs 1–3 or from previous work.33,34
Table 5. Rate Constants, kET1, kET2, k10, and k21, and Energy Transfer Efficiencies, ϕET1, ϕET2, ϕET(dyn), and ϕET(fl), for Rhodopin and Rhodopinal in LH2 Complexes Isolated from Rbl. acidophilusa.
| LH2 complex (carotenoid) | kET1 (ps–1) | k10 (ps–1) | ϕET1 (%) | kET2 (ps–1) | k21 (ps–1) | ϕET2 (%) | ϕET(dyn)b (%) | ϕET(fl)c (%) | ref |
|---|---|---|---|---|---|---|---|---|---|
| 10050 (rhodopin) | 0.089d | 0.24 | 27 | 7.0e | 10.5 | 40 | 56 | 56 | this work and (33) |
| 7050 LL (rhodopinal) | 0.59f | 0.24 | 71 | 90g | 10 | 90 | 97 | 97 | this work |
The values were obtained using eqs 1–3 given in the text. Rate constants for the LH2 complexes were obtained using laser excitation at 525 nm (rhodopin excitation) for the sample prepared from Rbl. acidophilus strain 10050 (which contains only the rhodopin chromophore) and at 570 nm (selective rhodopinal excitation) for the sample prepared from Rbl. acidophilus strain 7050 LL.
Determined from the dynamics (dyn) of the excited states according to eq 1.
Determined from steady-state fluorescence excitation spectroscopy (fl) as shown in Figures 5 and 6.
Computed from eq 2 using the values of 3.0 ps (τ3 in Table 4) and 4.1 ps measured here for the lifetime of the S1 state of rhodopin in the LH2 complex and as an average value in solution (τ3 in Table 3), respectively.
Computed from eq 2 using the values of 57 and 95 fs for the lifetime of the S2 state in the LH2 complex and in solution, respectively. The 57 fs value was obtained from fluorescence upconversion spectroscopic experiments reported in ref (33). The lifetime of the S2 state in solution was treated as an adjustable parameter to achieve agreement between the energy transfer efficiency of 56% computed from the dynamics data and that measured by fluorescence excitation spectroscopy.
Computed from eq 2 using the values of 1.2 ps (τ3 in Table 4) and 4.1 ps measured here for the lifetime of the S1 state of rhodopinal in the LH2 complex and as an average value in solution (τ3 in Table 3), respectively.
Computed from eq 2 using the values of 10 and 100 fs for the lifetime of the S2 state in the LH2 complex and in solution, respectively. In fact, the S2 lifetime obtained for rhodopinal glucoside in solution was found here to be <100 fs, which means that the k21 value of 10 ps–1 based on this lifetime is a lower limit to what the value could be. The lifetime of the S2 state in the complex was treated as an adjustable parameter to achieve agreement between the energy transfer efficiency of 97% computed from the dynamics data and that measured by fluorescence excitation spectroscopy.
The key result for rhodopin (and rhodopin glucoside) in the LH2 complex from Rbl. acidophilus 10050 is the extent of partitioning between the S1 and S2 donor states of the efficiency of energy transfer to BChl. The data in Table 5 show that ϕET1 = 27% and ϕET2 = 40%, which according to eq 1 leads to an overall energy transfer efficiency of 56%. However, it is important to point out that, in the current analysis, the lifetime of the S2 state of rhodopin in solution was treated as an adjustable parameter and set to 95 fs to achieve agreement between the energy transfer efficiency of 56% computed from the dynamics data, and that measured by fluorescence excitation spectroscopy (Figures 5 and 6). The value of 95 fs is in very good agreement with the S2 lifetime of ∼105 fs reported by Macpherson et al.33 for rhodopin glucoside in ethanol, and is consistent with the present findings that the value is <100 fs. Previous workers concur that the S2 pathway is most important in the carotenoid-to-BChl energy transfer mechanism in this LH2 complex (Table 5).33,34
When rhodopinal (and rhodopinal glucoside) is present in the LH2 complex, as is the case for Rbl. acidophilus 7050 LL and HL, the overall carotenoid-to-BChl energy transfer efficiency becomes much greater. As shown clearly from the analysis of the fluorescence excitation spectra given in Figure 6, this can be traced directly to the fact that rhodopinal is much more efficient at transferring energy to BChl than rhodopin. The data presented in Table 5 reveal that this enhancement is due to a significant increase in both kET1 and kET2 for rhodopinal compared to those obtained for rhodopin. Note from the data in Table 5 that kET1 increases from 0.089 ps–1 to 0.59 ps–1 and kET2 increases from 7.0 ps–1 to 90 ps–1 in going from rhodopin to rhodopinal as the energy donor to BChl in the LH2 complex from 7050 LL. These combined increases result in a substantial enhancement in the carotenoid-to-BChl EET efficiency from 56% for rhodopin to 97% for rhodopinal. However, as was the case for the S2 lifetime of rhodopin discussed above, owing to the fact that lifetimes of the S2 state of rhodopinal in solution and in the LH2 complex are faster than the time resolution of the laser spectrometer, these values were treated as adjustable parameters to achieve agreement between the energy transfer efficiency computed from the dynamics data and that measured by fluorescence excitation spectroscopy.
A consideration of the fundamental quantum mechanical expression for the rate constant for EET76,77
| 4 |
where T is the electronic coupling term and J is the normalized spectral overlap
| 5 |
and Fd(ν) is the emission spectrum of the donor carotenoid and εa(ν) is the absorption spectrum of the BChl acceptor, leads to the conclusion that the increase in the values of the rate constants in going from rhodopin to rhodopinal (Table 5) cannot be attributed solely to the different positions of the energy levels of the carotenoids, and consequently neither to differences in spectral overlap. This is particularly evident for the route involving the S2 (11Bu+) state of the carotenoid and the state corresponding to the QX band of BChl. Taking the S0 (11Ag–) → S2 (11Bu+) absorption spectrum of rhodopin and rhodopinal reflected about their spectral origins as approximations to their (very weak) emission profiles, and overlaying these lineshapes with the QX absorption band of BChl in the LH2 complex (Figure 16), one obtains a rhodopinal-to-rhodopin spectral overlap ratio of 1.2. This value is significantly different from the rhodopinal-to-rhodopin ratio of kET2 rate constants given in Table 5 which indicate a value of (90/7.0) = 13. Although it is impossible to compute the spectral overlap integrals associated with the S1 (21Ag–) state of the carotenoid due to the lack of either detectable S0 (11Ag–) → S1 (21Ag–) absorption or fluorescence from the S1 (21Ag–) state, the small difference in the S1 lifetimes of rhodopin and rhodopinal in solution (Table 3) suggests very similar S1 excited state energies for the two molecules. Therefore, a minimal effect of the position of the energy levels, and consequently of spectral overlap, is expected for the kET1 rate constant in the LH2 complexes. However, a significant change in kET1 is evidenced by comparing the S1 lifetime of rhodopin in the LH2 complex from Rbl. acidophilus 10050 (3.0 ps) with that of rhodopinal (selectively excited at 570 nm) in the LH2 complex from Rbl. acidophilus 7050 LL (1.2 ps). Using eq 2 and an average lifetime of 4.1 ps for the carotenoids in the four different solvents, the value of kET1 is shown in Table 5 to increase by a factor of (0.59/0.089) = 6.6 in going from rhodopin to rhodopinal. Because only small differences in excited state energies and spectral overlap with the BChl QX and QY absorption bands are evident for both the S1 and S2 states of these carotenoids, stronger electronic coupling between the donor and acceptor electronic states induced by the presence of the aldehyde group on the π-electron polyene chain in rhodopinal must be a major factor determining why rhodopinal is much more efficient at carotenoid-to-BChl EET than rhodopin in the LH2 pigment–protein complex.
Figure 16.
Spectral overlap of the hypothetical fluorescence of the carotenoid donor (orange and purple traces) and absorption of the BChl acceptor (black trace). The absorption spectra of the carotenoids were reflected about their spectral origins to obtain approximations to the S2 (11Bu+) → S0 fluorescence spectra.
Although a rigorous analysis of the Coulomb coupling terms describing EET from S1 and S2 is beyond the scope of this paper, this issue is addressed for S1 by the level ordering analysis shown in Figure 13. The lowest excited singlet state of both cis- and trans-configurations is calculated to be a “forbidden” 21Ag– state that gains oscillator strength due to dipole-induced coupling with the higher energy, strongly allowed 11Bu+ state. The above kinetics analysis has revealed that energy is transferred from the S1 (21Ag–) state to the BChl acceptor 6.6 times faster than the corresponding state in rhodopin. The computations predict that the enhanced energy transfer rate is associated in part with a significant increase in the oscillator strength of the S1 state in rhodopinal relative to rhodopin. Moreover, the increase in oscillator strength in trans-rhodopinal is ∼35% larger than observed in 13-cis-rhodopinal (Figure 13). Because the Förster coupling efficiency is proportional to the allowedness of the donor excited state, the all-trans configuration of rhodopinal provides added value to its light-harvesting function.
As mentioned in the Introduction, when Rbl. acidophilus 7050 is grown under LL conditions, two major changes in the spectrum of the LH2 complex occur: A blue shift of the BChl QY band from ∼850 nm to ∼820 nm, which is caused by a change in the orientation of the C3-acetyl group of the B850 BChl; and a red shift and broadening of the spectrum of the carotenoid, which is a consequence of the enzymatic substitution of an aldehyde group for a methyl group on rhodopin resulting in its conversion to rhodopinal. An important question is then, which of these factors is most important for enhancing the rate and efficiency of carotenoid-to-BChl EET? The answer is that the conversion of rhodopin to rhodopinal is more important than the shift of the BChl QY band. Data suggestive of this conclusion was provided previously by Deinum et al.,4 who investigated the B800-820 LH2 complex from Rbl. acidophilus 7750. Cells of this strain grown either at low temperatures or at LL do not contain rhodopinal (or rhodopinal glucoside),3,78 and the carotenoid-to-BChl EET efficiency of its associated LH2 complex, which contains primarily rhodopin and rhodopin glucoside, was found to be 45 ± 5%.4 If the change in the position of the BChl QY band from ∼850 nm to ∼820 nm was important for enhancing the efficiency of EET from the carotenoid to BChl, one would expect that the efficiency for Rbl. acidophilus strain 7750 would have a value above 45% or even higher than 56%, which is the value found for rhodopin in the B800-850 LH2 complex from strain 10050 (Table 2). The fact that it is not larger than 56%, and in fact is smaller than this value, i.e., 45 ± 5%, indicates that the change in the position of the QY band of BChl is not a factor in determining the efficiency of carotenoid-to-BChl EET. Instead, the conversion of rhodopin to rhodopinal, which incidentally occurs prior to the conversion of B800-850 to B800-820, is the primary controlling factor leading to more efficient EET in the LH2 complex of Rbl. acidophilus 7050 LL compared to the LH2 of Rbl. acidophilus strain 10050.
Conclusions
The enzymatic conversion of rhodopin to rhodopinal in cells of Rbl. acidophilus 7050 grown under LL conditions results in a significant enhancement in the ability of the organism to transfer absorbed light energy to the reaction center. This is due almost entirely to the fact that rhodopinal, and its corresponding glucoside, are nearly 100% efficient at transferring excited state energy to BChl in the LH2 complex. Also, the spectrum of rhodopinal occurs at a longer wavelength compared to that of rhodopin, which allows the bacterium containing this carotenoid to capture light energy in a spectral region where its photosynthetic bacterial competitors do not absorb light. This provides an important advantage for this organism as it competes for life-sustaining photons in the water column. Moreover, based on the kET1 and kET2 rate constants given in Table 5, the energy absorbed by rhodopinal is transferred to BChl in the LH2 complex 6.6 times faster from the S1 state and >10 times faster from the S2 state than energy absorbed by rhodopin. More effective electronic coupling between the electronic states of the carbonyl-containing rhodopinal and BChl is the primary reason for the increase in these rates.
Even though the blue shift of the BChl QY band from ∼850 nm to ∼820 nm induced by growing Rbl. acidophilus 7050 under LL conditions does not have an effect on the rate and efficiency of carotenoid-to-BChl EET, this spectral change has another consequence. It has been shown on the basis of singlet–singlet annihilation measurements that, compared to the B800-850 complex, the B800-820 complex provides a more effective energy barrier for preventing back transfer of excitation energy out of the reaction center core complex and into the photosynthetic unit.4 Thus, the combined effects of alterations in carotenoid and BChl structures and spectral properties resulting from the adaptation of the bacterial photosynthetic organism to the challenging environmental condition of limited light availability contribute in a very tangible way to ensure survival of this species.
Acknowledgments
Work in the laboratory of H.A.F. was supported by grants from the National Science Foundation (MCB-1243565) and the University of Connecticut Research Foundation. Funding for the work performed in the laboratory of R.J.C. was provided by BBSRC. A-M.C. helped with the growth and harvest of the Rbl. acidophilus cells and the preparation of the LH2 pigment–protein complexes, which was carried out using support from the Photosynthetic Antenna Research Center (PARC), an Energy Frontier Research Center funded by the U.S. Department of Energy, Office of Science, Office of Basic Energy Sciences, under Award Number DE-SC0001035. Work in the laboratory of R.R.B. was supported in part by grants from the NIH (GM-34548), NSF (EMT-0829916), and the Harold S. Schwenk Sr. Distinguished Chair at the University of Connecticut.
Supporting Information Available
Determination of the amount of B800-850 protein in the sample of the LH2 pigment–protein complex prepared from cells of Rbl. acidophilus 7050 LL, and fluorescence excitation spectra of LH2 complexes from Rbl. acidophilus 7050 HL and 7050 LL detected at various emission wavelengths. This material is available free of charge via the Internet at http://pubs.acs.org.
The authors declare no competing financial interest.
Funding Statement
National Institutes of Health, United States
Supplementary Material
References
- Cogdell R. J.; Durant I.; Valentine J.; Lindsay J. G.; Schmidt K. The Isolation and Partial Characterization of the Light-Harvesting Pigment-Protein Complement of Rhodopseudomonas acidophila. Biochim. Biophys. Acta 1983, 722, 427–435. [Google Scholar]
- Angerhofer A.; Cogdell R. J.; Hipkins M. F. A Spectral Characterization of the Light-Harvesting Pigment-Protein Complexes from Rhodopseudomonas acidophila. Biochim. Biophys. Acta 1986, 848, 333–341. [Google Scholar]
- Gardiner A. T.; Cogdell R. J.; Takaichi S. The Effect of Growth Conditions on the Light-Harvesting Apparatus in Rhodopseudomonas acidophila. Photosynth. Res. 1993, 38, 159–167. [DOI] [PubMed] [Google Scholar]
- Deinum G.; Otte S. C. M.; Gardiner A. T.; Aartsma T. J.; Cogdell R. J.; Amesz J. Antenna Organization of Rhodopseudomonas acidophila: A Study of the Excitation Migration. Biochim. Biophys. Acta 1991, 1060, 125–131. [Google Scholar]
- Cogdell R. J.; Howard T. D.; Isaacs N. W.; McLuskey K.; Gardiner A. T. Structural Factors Which Control the Position of the Qy Absorption Band of Bacteriochlorophyll a in Purple Bacterial Antenna Complexes. Photosynth. Res. 2002, 74, 135–141. [DOI] [PubMed] [Google Scholar]
- Gabrielsen M.; Gardiner A. T.; Cogdell R. J.. Peripheral Complexes of Purple Bacteria. In The Purple Phototrophic Bacteria; Hunter C. N., Daldal F., Thurnauer M. C., Beatty J. T., Eds.; Springer: Dordrecht, The Netherlands, 2009; Vol. 28, pp 135–153. [Google Scholar]
- Gardiner A. T.; Takaichi S.; Cogdell R. J. The Effect of Changes in Light Intensity and Temperature on the Peripheral Antenna of Rhodopseudomonas acidophila. Biochem. Soc. Trans. 1992, 21, 6S. [DOI] [PubMed] [Google Scholar]
- Prince S. M.; Papiz M. Z.; Freer A. A.; McDermott G.; Hawthornthwaite-Lawless A. M.; Cogdell R. J.; Isaacs N. W. Apoprotein Structure in the LH2 Complex from Rhodopseudomonas acidophila Strain 10050: Modular Assembly and Protein Pigment Interactions. J. Mol. Biol. 1997, 268, 412–423. [DOI] [PubMed] [Google Scholar]
- Heinemeyer E.-A.; Schmidt K. Changes in Carotenoid Biosynthesis Caused by Variations of Growth Conditions in Cultures of Rhodopseudomonas acidophila Strain 7050. Arch. Microbiol. 1983, 134, 217–221. [Google Scholar]
- Takaichi S.; Gardiner A. T.; Cogdell R. J. Pigment Composition of Light-Harvesting Pigment-Protein Complexes from Rhodopseudomonas acidophila: Effect of Light Intensity. Res. Photosynth., Proc. Int. Congr. Photosynth., 9th 1992, 1, 149–152. [Google Scholar]
- Bauer C. E.; Bird T. H. Regulatory Circuits Controlling Photosynthesis Gene Expression. Cell 1996, 85, 5–8. [DOI] [PubMed] [Google Scholar]
- Giraud E.; Fardoux J.; Fourrier N.; Hannibal L.; Genty B.; Bouyer P.; Dreyfus B.; Vermeglio A. Bacteriophytochrome Controls Photosystem Synthesis in Anoxygenic Bacteria. Nature 2002, 417, 202–205. [DOI] [PubMed] [Google Scholar]
- Evans K.; Georgiou T.; Hillon T.; Fordham-Skelton A.; Papiz M.. Bacteriophytochromes Control Photosynthesis in Rhodopseudomonas palustris. In The Purple Phototrophic Bacteria; Hunter C. N., Daldal F., Thurnauer M. C., Beatty J. T., Eds.; Springer: Dordrecht, The Netherlands, 2009; Vol. 28, pp 799–809. [Google Scholar]
- Brunisholz R. A.; Zuber H.. Primary Structure Analyses of Bacterial Antenna Polypeptides: Correlation of Aromatic Amino Acids with Spectral Properties. Structural Similarities with Reaction Center Polypeptides. In Photosynthetic Light-Harvesting Systems; Scheer H., Schneider S., Eds.; Walter de Gruyter & Co.: New York, 1988; pp 103–114. [Google Scholar]
- Fowler G. J. S.; Visschers R. W.; Grief G. G.; van Grondelle R.; Hunter C. N. Genetically Modified Photosynthetic Antenna Complexes with Blueshifted Absorbance Bands. Nature 1992, 355, 848–850. [DOI] [PubMed] [Google Scholar]
- Fowler G. J.; Sockalingum G. D.; Robert B.; Hunter C. N. Blue Shifts in Bacteriochlorophyll Absorbance Correlate with Changed Hydrogen Bonding Patterns in Light-Harvesting 2 Mutants of Rhodobacter sphaeroides with Alterations at Alpha-Tyr-44 and Alpha-Tyr-45. Biochem. J. 1994, 299, 695–700. [DOI] [PMC free article] [PubMed] [Google Scholar]
- Cogdell R. J.; Gall A.; Köhler J. The Architecture and Function of the Light-Harvesting Apparatus of Purple Bacteria: From Single Molecules to in Vivo Membranes. Q. Rev. Biophys. 2006, 39, 227–324. [DOI] [PubMed] [Google Scholar]
- McLuskey K.; Prince S. M.; Cogdell R. J.; Isaacs N. W. The Crystallographic Structure of the B800-820 LH3 Light-Harvesting Complex from the Purple Bacteria Rhodopseudomonas acidophila Strain 7050. Biochemistry 2001, 40, 8783–8789. [DOI] [PubMed] [Google Scholar]
- Aasen A. J.; Jensen S. L. Bacterial Carotenoids Xxiv. Acta Chem. Scand. 1967, 21, 2185–2204. [DOI] [PubMed] [Google Scholar]
- Takaichi S.Carotenoids and Carotenogenesis in Anoxygenic Photosynthetic Bacteria In The Photochemistry of Carotenoids; Frank H. A., Young A. J., Britton G., Cogdell R. J., Eds.; Kluwer Academic Publishing: Dordrecht, 1999; Vol. 8, pp 39–69. [Google Scholar]
- Takaichi S.Distribution and Biosynthesis of Carotenoids. In The Purple Phototrophic Bacteria; Hunter C. N., Daldal F., Thurnauer M. C., Beatty J. T., Eds.; Springer Science: Dordrecht, The Netherlands, 2009; Vol. 28, pp 97–117. [Google Scholar]
- Krueger B. P.; Scholes G. D.; Jimenez R.; Fleming G. R. Electronic Excitation Transfer from Carotenoid to Bacteriochlorophyll in the Purple Bacterium Rhodopseudomonas acidophila. J. Phys. Chem. B 1998, 102, 2284–2292. [Google Scholar]
- Pariser R. Theory of Electronic Spectra and Structure of the Polyacenes and of Alternant Hydrocarbons. J. Chem. Phys. 1955, 24, 250–268. [Google Scholar]
- Hudson B.; Kohler B. Linear Polyene Electronic Structure and Spectroscopy. Annu. Rev. Phys. Chem. 1974, 25, 437–460. [Google Scholar]
- Callis P. R.; Scott T. W.; Albrecht A. C. Perturbation Selection Rules for Multiphoton Electronic Spectroscopy of Neutral Alternant Hydrocarbons. J. Chem. Phys. 1983, 78, 16–22. [Google Scholar]
- Birge R. R. Two Photon Spectroscopy of Protein-Bound Chromophores. Acc. Chem. Res. 1986, 19, 138–146. [Google Scholar]
- Kohler B. E.Electronic Structure of Carotenoids. In Carotenoids; Britton G., Liaaen-Jensen S., Pfander H., Eds.; Birkhäuser Verlag AG: Basel, 1995; Vol. 1B, Spectroscopy, pp 3–12. [Google Scholar]
- Christensen R. L.The Electronic States of Carotenoids. In The Photochemistry of Carotenoids; Frank H. A., Young A. J., Britton G., Cogdell R. J., Eds.; Kluwer Academic Publishers: Dordrecht, 1999; Vol. 8, pp 137–159. [Google Scholar]
- Christensen R. L.; Barney E. A.; Broene R. D.; Galinato M. G. I.; Frank H. A. Linear Polyenes: Models for the Spectroscopy and Photophysics of Carotenoids. Arch. Biochem. Biophys. 2004, 430, 30–36. [DOI] [PubMed] [Google Scholar]
- Frank H. A.; Young A. J.; Britton G.; Cogdell R. J.. The Photochemistry of Carotenoids. In Advances in Photosynthesis; Govindjee, Ed.; Kluwer Academic Publishers: Dordrecht, 1999; Vol. 8. [Google Scholar]
- McDermott G.; Prince S. M.; Freer A. A.; Hawthornthwaite-Lawless A. M.; Papiz M. Z.; Cogdell R. J.; Isaacs N. W. Crystal Structure of an Integral Membrane Light-Harvesting Complex from Photosynthetic Bacteria. Nature (London) 1995, 374, 517–521. [Google Scholar]
- Scholes G. D.; Fleming G. R. On the Mechanism of Light Harvesting in Photosynthetic Purple Bacteria: B800 to B850 Energy Transfer. J. Phys. Chem. B 2000, 104, 1854–1868. [Google Scholar]
- Macpherson A. N.; Arellano J. B.; Fraser N. J.; Cogdell R. J.; Gillbro T. Efficient Energy Transfer from the Carotenoid S2 State in a Photosynthetic Light-Harvesting Complex. Biophys. J. 2001, 80, 923–930. [DOI] [PMC free article] [PubMed] [Google Scholar]
- Cong H.; Niedzwiedzki D.; Gibson G. N.; LaFountain A. M.; Kelsh R. M.; Gardiner A. T.; Cogdell R. J.; Frank H. A. Ultrafast Time-Resolved Carotenoid-to-Bacteriochlorophyll Energy Transfer in LH2 Complexes from Photosynthetic Bacteria. J. Phys. Chem. B 2008, 112, 10689–10703. [DOI] [PMC free article] [PubMed] [Google Scholar]
- Ostroumov E. E.; Mulvaney R. M.; Cogdell R. J.; Scholes G. D. Broadband 2D Electronic Spectroscopy Reveals a Carotenoid Dark State in Purple Bacteria. Science 2013, 340, 52–56. [DOI] [PubMed] [Google Scholar]
- Pfennig N. Rhodopseudomonas acidophila, Sp. N., a New Species of the Budding Purple Nonsulfur Bacteria. J. Bacteriol. 1969, 99, 597–602. [DOI] [PMC free article] [PubMed] [Google Scholar]
- Ilagan R. P.; Christensen R. L.; Chapp T. W.; Gibson G. N.; Pascher T.; Polivka T.; Frank H. A. Femtosecond Time-Resolved Absorption Spectroscopy of Astaxanthin in Solution and in α-Crustacyanin. J. Phys. Chem. A 2005, 109, 3120–3127. [DOI] [PubMed] [Google Scholar]
- Fuciman M.; Enriquez M. M.; Polivka T.; Dall’Osto L.; Bassi R.; Frank H. A. Role of Xanthophylls in Light Harvesting in Green Plants: A Spectroscopic Investigation of Mutant LHCII and Lhcb Pigment-Protein Complexes. J. Phys. Chem. B 2012, 116, 3834–3849. [DOI] [PubMed] [Google Scholar]
- van Stokkum I. H. M.; Larsen D. S.; van Grondelle R. Global and Target Analysis of Time-Resolved Spectra. Biochim. Biophys. Acta 2004, 1657, 82–104. [DOI] [PubMed] [Google Scholar]
- Becke A. D. Density-Functional Thermochemistry. III. The Role of Exact Exchange. J. Chem. Phys. 1993, 98, 5648–5652. [Google Scholar]
- Lee C.; Yang W.; Parr R. G. Development of the Colle-Salvetti Correlation-Energy Formula into a Functional of the Electron Density. Phys. Rev. B: Condens. Matter 1988, 37, 785–789. [DOI] [PubMed] [Google Scholar]
- Frisch M. J.; Trucks G. W.; Schlegel H. B.; Scuseria G. E.; Robb M. A.; Cheeseman J. R.; Scalmani G.; Barone V.; Mennucci B.; Petersson G. A.; et al. Gaussian 09; Gaussian, Inc.: Wallingford, CT, 2009. [Google Scholar]
- Foresman J. B.; Head-Gordon M.; Pople J. A.; Frisch M. J. Toward a Systematic Molecular Orbital Theory for Excited States. J. Phys. Chem. 1992, 96, 135–149. [Google Scholar]
- Caricato M.; Mennucci B.; Scalmani G.; Trucks G. W.; Frisch M. J. Electronic Excitation Energies in Solution at Equation of Motion CCSD Level within a Specific Polarizable Continuum Model Approach. J. Chem. Phys. 2010, 132, 084102. [DOI] [PubMed] [Google Scholar]
- Fukuda R.; Ehara M.; Nakatsuji H.; Cammi R. Nonequilibrium Solvation for Vertical Photoemission and Photoabsorption Processes Using the Symmetry-Adapted Cluster-Configuration Interaction Method in the Polarizable Continuum Model. J. Chem. Phys. 2011, 134, 104109. [DOI] [PubMed] [Google Scholar]
- Marenich A. V.; Cramer C. J.; Truhlar D. G.; Guido C. A.; Mennucci B.; Scalmani G.; Frisch M. J. Practical Computation of Electronic Excitation in Solution: Vertical Excitation Model. Chem. Sci. 2011, 2, 2143–2161. [Google Scholar]
- Shima S.; Ilagan R. P.; Gillespie N.; Sommer B. J.; Hiller R. G.; Sharples F. P.; Frank H. A.; Birge R. R. Two-Photon and Fluorescence Spectroscopy and the Effect of Environment on the Photochemical Properties of Peridinin in Solution and in the Peridinin-Chlorophyll-Protein from Amphidinium carterae. J. Phys. Chem. A 2003, 107, 8052–8066. [Google Scholar]
- Ren L.; Martin C. H.; Wise K. J.; Gillespie N. B.; Luecke H.; Lanyi J. K.; Spudich J. L.; Birge R. R. Molecular Mechanism of Spectral Tuning in Sensory Rhodopsin II. Biochemistry 2001, 40, 13906–13914. [DOI] [PubMed] [Google Scholar]
- Martin C. H.; Birge R. R. Reparametrizing MNDO for Excited State Calculations Using ab Initio Effective Hamiltonian Theory: Application to the 2,4-Pentadien-1-iminium Cation. J. Phys. Chem. A 1998, 102, 852–860. [Google Scholar]
- Stanton J. F.; Bartlett R. J. The Equation of Motion Coupled-Cluster Method. A Systematic Biorthogonal Approach to Molecular Excitation Energies, Transition Probabilities, and Excited State Properties. J. Chem. Phys. 1993, 98, 7029–7039. [Google Scholar]
- Koch H.; Kobayashi R.; Sánchez de Merás A.; Jørgensen P. Calculation of Size-Intensive Transition Moments from the Coupled Cluster Singles and Doubles Linear Response Function. J. Chem. Phys. 1994, 100, 4393–4400. [Google Scholar]
- Kállay M.; Gauss J. Calculation of Excited-State Properties Using General Coupled-Cluster and Configuration-Interaction Models. J. Chem. Phys. 2004, 121, 9257–9269. [DOI] [PubMed] [Google Scholar]
- Premvardhan L.; Sandberg D. J.; Fey H.; Birge R. R.; Buchel C.; van Grondelle R. The Charge-Transfer Properties of the S-2 State of Fucoxanthin in Solution and in Fucoxanthin Chlorophyll-a/c(2) Protein (FCP) Based on Stark Spectroscopy and Molecular-Orbital Theory. J. Phys. Chem. B 2008, 112, 11838–11853. [DOI] [PMC free article] [PubMed] [Google Scholar]
- Pendon Z. D.; Sullivan J. O.; van der Hoef I.; Lugtenburg J.; Cua A.; Bocian D. F.; Birge R. R.; Frank H. A. Stereoisomers of Carotenoids: Spectroscopic Properties of Locked and Unlocked cis-Isomers of Spheroidene. Photosynth. Res. 2005, 86, 5–24. [DOI] [PubMed] [Google Scholar]
- Niedzwiedzki D. M.; Sandberg D. J.; Cong H.; Sandberg M. N.; Gibson G. N.; Birge R. R.; Frank H. A. Ultrafast Time-Resolved Absorption Spectroscopy of Geometric Isomers of Carotenoids. Chem. Phys. 2009, 357, 4–16. [DOI] [PMC free article] [PubMed] [Google Scholar]
- Dunning T. H. Jr.; Hay P. J.. Modern Theoretical Chemistry. In Modern Theoretical Chemistry; Schaefer H. F., Ed.; Plenum: New York, NY, 1976; Vol. 3, pp 1–28. [Google Scholar]
- Pendon Z. D.; Gibson G. N.; van der Hoef I.; Lugtenburg J.; Frank H. A. Effect of Isomer Geometry on the Steady-State Absorption Spectra and Femtosecond Time-Resolved Dynamics of Carotenoids. J. Phys. Chem. B 2005, 109, 21172–21179. [DOI] [PubMed] [Google Scholar]
- Niedzwiedzki D. M.; Sullivan J. O.; Polivka T.; Birge R. R.; Frank H. A. Femtosecond Time-Resolved Transient Absorption Spectroscopy of Xanthophylls. J. Phys. Chem. B 2006, 110, 22872–22885. [DOI] [PubMed] [Google Scholar]
- Niedzwiedzki D.; Koscielecki J. F.; Cong H.; Sullivan J. O.; Gibson G. N.; Birge R. R.; Frank H. A. Ultrafast Dynamics and Excited State Spectra of Open-Chain Carotenoids at Room and Low Temperatures. J. Phys. Chem. B 2007, 111, 5984–5998. [DOI] [PubMed] [Google Scholar]
- Enriquez M. M.; Fuciman M.; LaFountain A. M.; Wagner N. L.; Birge R. R.; Frank H. A. The Intramolecular Charge Transfer State in Carbonyl-Containing Polyenes and Carotenoids. J. Phys. Chem. B 2010, 114, 12416–12426. [DOI] [PMC free article] [PubMed] [Google Scholar]
- Magdaong N. M.; Niedzwiedzki D. M.; Greco J. A.; Liu H.; Yano K.; Kajikawa T.; Sakaguchi K.; Katsumura S.; Birge R. R.; Frank H. A. Excited State Properties of a Short Π-Electron Conjugated Peridinin Analogue. Chem. Phys. Lett. 2014, 593, 132–139. [DOI] [PMC free article] [PubMed] [Google Scholar]
- Bautista J. A.; Connors R. E.; Raju B. B.; Hiller R. G.; Sharples F. P.; Gosztola D.; Wasielewski M. R.; Frank H. A. Excited State Properties of Peridinin: Observation of a Solvent Dependence of the Lowest Excited Singlet State Lifetime and Spectral Behavior Unique among Carotenoids. J. Phys. Chem. B 1999, 103, 8751–8758. [Google Scholar]
- Frank H. A.; Bautista J. A.; Josue J.; Pendon Z.; Hiller R. G.; Sharples F. P.; Gosztola D.; Wasielewski M. R. Effect of the Solvent Environment on the Spectroscopic Properties and Dynamics of the Lowest Excited States of Carotenoids. J. Phys. Chem. B 2000, 104, 4569–4577. [Google Scholar]
- Gradinaru C. C.; Kennis J. T. M.; Papagiannakis E.; van Stokkum I. H. M.; Cogdell R. J.; Fleming G. R.; Niederman R. A.; van Grondelle R. An Unusual Pathway of Excitation Energy Deactivation in Carotenoids: Singlet-to-Triplet Conversion on an Ultrafast Timescale in a Photosynthetic Antenna. Proc. Natl. Acad. Sci. U.S.A. 2001, 98, 2364–2369. [DOI] [PMC free article] [PubMed] [Google Scholar]
- Papagiannakis E.; Kennis J. T. M.; van Stokkum I. H. M.; Cogdell R. J.; van Grondelle R. An Alternative Carotenoid-to-Bacteriochlorophyll Energy Transfer Pathway in Photosynthetic Light Harvesting. Proc. Natl. Acad. Sci. U.S.A. 2002, 99, 6017–6022. [DOI] [PMC free article] [PubMed] [Google Scholar]
- Papagiannakis E.; van Stokkum I. H.; Vengris M.; Cogdell R. J.; van Grondelle R.; Larsen D. S. Excited-State Dynamics of Carotenoids in Light-Harvesting Complexes. 1. Exploring the Relationship between the S(1) and S* States. J. Phys. Chem. B 2006, 110, 5727–5736. [DOI] [PubMed] [Google Scholar]
- Cong H.; Niedzwiedzki D. M.; Gibson G. N.; Frank H. A. Ultrafast Time-Resolved Spectroscopy of Xanthophylls at Low Temperature. J. Phys. Chem. B 2008, 112, 3558–3567. [DOI] [PubMed] [Google Scholar]
- Niedzwiedzki D. M.; Kobayashi M.; Blankenship R. E. Triplet Excited State Spectra and Dynamics of Carotenoids from the Thermophilic Purple Photosynthetic Bacterium Thermochromatium tepidum. Photosynth. Res. 2011, 107, 177–186. [DOI] [PubMed] [Google Scholar]
- Papagiannakis E.; Das S. K.; Gall A.; Stokkum I. H. M.; Robert B.; van Grondelle R.; Frank H. A.; Kennis J. T. M. Light Harvesting by Carotenoids Incorporated into the B850 Light-Harvesting Complex from Rhodobacter sphaeroides R-26.1: Excited-State Relaxation, Ultrafast Triplet Formation, and Energy Transfer to Bacteriochlorophyll. J. Phys. Chem. B 2003, 107, 5642–5649. [Google Scholar]
- Wohlleben W.; Buckup T.; Hashimoto H.; Cogdell R. J.; Herek J. L.; Motzkus M. Pump-Deplete-Probe Spectroscopy and the Puzzle of Carotenoid Dark States. J. Phys. Chem. B 2004, 108, 3320–3325. [Google Scholar]
- Liaaen-Jensen S. Selected Examples of Structure Determination of Natural Carotenoids. Pure Appl. Chem. 1969, 20, 421–448. [DOI] [PubMed] [Google Scholar]
- Ke B.; Imsgard F.; Kjøsen H.; Liaaen-Jensen S. Electronic Spectra of Carotenoids at 77 K. Biochim. Biophys. Acta 1969, 210, 139–152. [PubMed] [Google Scholar]
- Chin C.-A.; Song P.-S. Electronic Spectra of Carotenoids: A Theoretical Analysis of the Electronic Spectrum of Rhodopinal. J. Mol. Spectrosc. 1974, 52, 216–223. [Google Scholar]
- Zechmeister L.Cis-Trans Isomeric Carotenoids, Vitamin A, and Arylpolyenes; Academic Press: New York, 1962. [Google Scholar]
- Durchan M.; Fuciman M.; Šlouf V.; Keşan G.; Polívka T. Excited-State Dynamics of Monomeric and Aggregated Carotenoid 8′-Apo-β-carotenal. J. Phys. Chem. A 2012, 1165012330–12338. [DOI] [PubMed] [Google Scholar]
- Scholes G. D.; Harcourt R. D.; Fleming G. R. Electronic Interactions in Photosynthetic Light-Harvesting Complexes: The Role of Carotenoids. J. Phys. Chem. B 1997, 101, 7302–7312. [Google Scholar]
- Desamero R. Z. B.; Chynwat V.; van der Hoef I.; Jansen F. J.; Lugtenburg J.; Gosztola D.; Wasielewski M. R.; Cua A.; Bocian D. F.; Frank H. A. Mechanism of Energy Transfer from Carotenoids to Bacteriochlorophyll: Light-Harvesting by Carotenoids Having Different Extents of π-Electron Conjugation Incorporated into the B850 Antenna Complex from the Carotenoidless Bacterium Rhodobacter sphaeroides R-26.1. J. Phys. Chem. B 1998, 102, 8151–8162. [Google Scholar]
- Schmidt K. Carotenoids of Purple Nonsulfur Bacteria. Arch. Microbiol. 1971, 77, 231–238. [PubMed] [Google Scholar]
Associated Data
This section collects any data citations, data availability statements, or supplementary materials included in this article.