Abstract
Background
Occupational stress in resident physicians has profound implications for wellness, professionalism, and patient care. This observational pilot trial measured psychological and physiological stress biomarkers before, during, and after the start of anesthesia residency.
Methods
Eighteen physician interns scheduled to begin anesthesia residency were recruited for evaluation at three time points: baseline (collected remotely before residency in June 2013); first month visit 1 (July); and follow-up visit 2 (residency month 3–5, Sept–Nov). Validated scales were used to measure stress, anxiety, resilience, and wellness at all 3 time points. During visits 1 and 2, we measured resting heart rate variability, responses to laboratory mental stress (hemodynamic, catecholamine, cortisol, and interleukin-6) and chronic stress indices (C-reactive protein, 24 h ambulatory heart rate and blood pressure, 24 h urinary cortisol and catecholamines, overnight heart rate variability).
Results
Thirteen interns agreed to participate (72% enrollment). There were seven men and six women, ages 27–33 years. The mean ± SD of all study variables are reported.
Conclusion
The novelty of our report is the prospective design in a defined cohort of residents newly exposed to the similar occupational stress of the operating environment. Because of the paucity of literature specific to the measures and stress conditions in this investigation, no data were available to generate a priori definition of primary outcomes and a data analytic plan. These findings will allow power analysis for future design of trials examining occupational stress and stress-reducing interventions. Given the importance of physician burnout in our country, the impact of chronic stress on resident wellness requires further study.
BACKGROUND
The health and well-being of physicians and other health care providers is critical to our nation’s healthcare system. Unfortunately, increasing evidence suggests that the nation’s physicians and nurses are experiencing epidemic levels of burnout, dissatisfaction, and work-related stress.1–3 These factors appear to be a particular concern for resident physicians where burnout and distress have been shown to impact patient safety4,5 and be related to medical knowledge as assessed by standardized tests.6 Stress encompasses a wide range of psychological and physical perturbations that negatively affect health, relationships, quality of life and well-being. Recent surveys have shown increasing levels of stress and burnout in physicians3 and also a connection between burnout and patient outcomes.1 Given this association, an intense area of new empirical interest is occupational stress in the context of professionalism among healthcare workers. This is particularly important in perioperative resident physicians who have the least experience in the operating room organizational hierarchy. Furthermore, compared to other healthcare providers, residents are most affected in health, personal support, professional support, and outside activities.7
To identify the impact of stress on well-being, one strategy is to select a cohort of residents who will encounter an anticipated training stressor. The first month of anesthesiology residency represents an extreme degree of psychological, intellectual, procedural, technical, managerial, and logistical stress. In addition to the factors just described, the start of anesthesiology residency may also impact health behaviors, including a stress component that can be considered “deprivation stress,” which may involve less sleep, an irregular sleeping schedule, a reduction in physical activity level, a reduction in pleasurable activities or hobbies, poor nutrition, and a reduction in personal or family time.8
The emotional stress and burnout risk in residency training has been well documented, but the method of data collection has primarily been through psychological surveys that evaluate stress level, burnout or mood. Similarly, for physiological measures, while some variables have been recorded in simulator training modules,9 nothing has been collected during real-time “in the field” patient care activities. Thus, there is a major knowledge gap in the quantifiable psychological and physiological effects of the profound occupational stress associated with novice medical residents transitioning to residency training. Reliable markers of stress would be considered essential repeated measures in interventional trials aimed at reducing stress and optimizing the training experience, with implications for resident wellness, professionalism, and patient care.
With this information as background, the purpose of this pilot and feasibility trial was to prospectively collect high-resolution psychological and physiological data in new clinical anesthesia year-one trainees. Therefore, the study goals were to 1) quantify the acute psychological stress of starting anesthesia residency by measuring physical activity level, perceived stress, state anxiety, resilience, and perceptions of well-being; 2) record heart rate variability (HRV) as a marker of cardiac autonomic modulation; 3) measure chronic markers of stress including 24 h urinary catecholamines (epinephrine and norepinephrine), 24 h urinary cortisol, and C-reactive protein (CRP); and 4) administer an acute mental stress protocol in our laboratory to generate a data base of acute cardiovascular and biomarker responses during the first month of anesthesiology residency and a follow-up visit.
MATERIALS AND METHODS
Subjects
This study received approval from the Department of Anesthesiology and the Mayo Clinic Institutional Review Board, Rochester, MN. Eighteen incoming clinical anesthesia year-one residents scheduled to begin anesthesia training on July 1, 2013, were recruited in June 2013. All individuals were completing postgraduate year-1 (PGY-1) at the time of recruitment. An Institutional Review Board-approved written informed consent form and health screening questionnaire was sent to each incoming resident by mail. Upon return of the signed consent form, the health screen was reviewed by the research nurses to ensure that no medical, psychiatric, or physical conditions would preclude participation in this study. Personal details such as marital status, children, or personal conflicts were not obtained. To ensure confidentiality, no investigator had access to the participants’ health screen or medical records. Even though this was considered a minimal risk protocol, pregnant women were excluded. Under the principles of protection of human subjects, no information was gathered on individuals who declined participation.
Preanesthesia residency “baseline” condition
As shown in figure 1, participants were evaluated during three time conditions: pre-stress baseline (collected remotely pre-residency in June 2013); first month visit 1, between five and 14 working days after starting residency (July 8–19, 2013); and follow-up visit 2 (any working day during an operating room or pain service rotation 3–5 months after starting residency between September 18 and November 21, 2013). During the pre-stress baseline, subjects completed the following survey instruments, which are provided in appendices 1–4:
Figure 1. Study timeline.
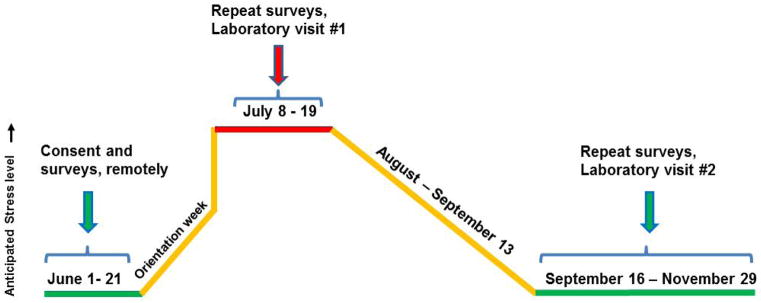
Incoming clinical anesthesia year-one (CA-1) trainees were evaluated in 2013 during three conditions. The month prior to starting anesthesia was considered baseline and psychological data were collected remotely. In-person visit 1 occurred in weeks 2 and 3 of the first month of CA-1 training. Follow-up visit 2 was identical to visit 1 and occurred during an operating room or pain rotation in the fall.
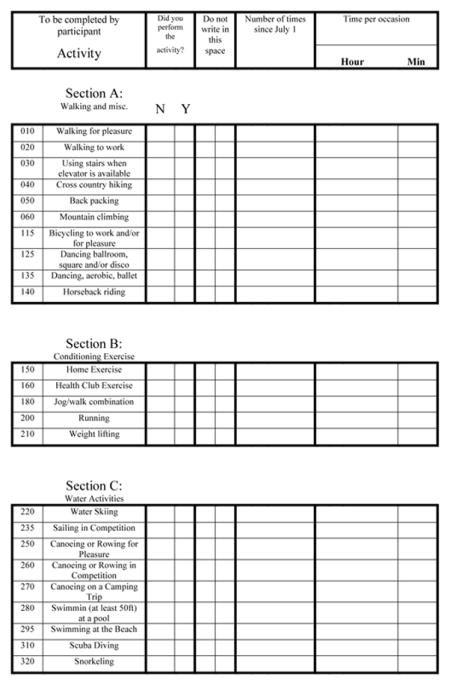
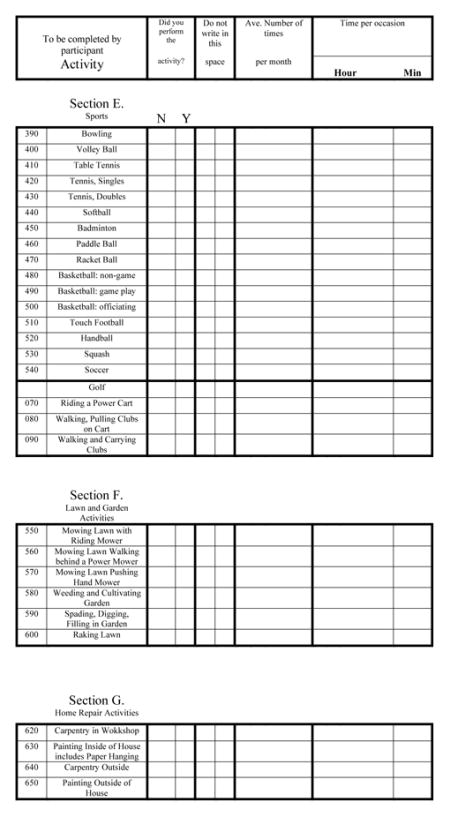
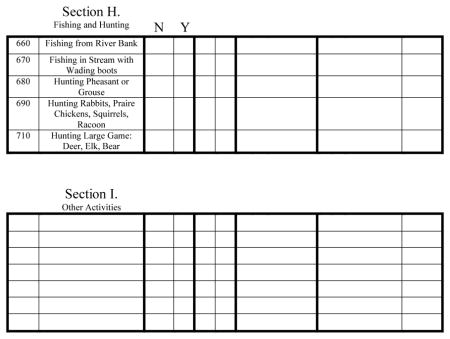
Appendix 1: Minnesota Leisure-Time Physical Activity Questionnaire (MLTPAQ), to determine the amount of energy expended over the previous 12 months. The questionnaire recorded information on frequency and duration of activities, providing an estimate of the amount of energy expended per activity, averaged per day in metabolic equivalents (METs).10
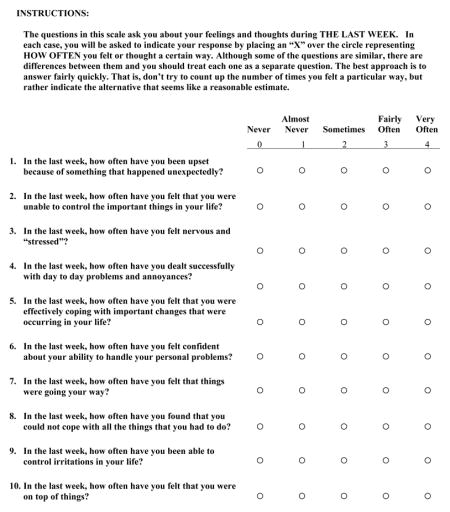
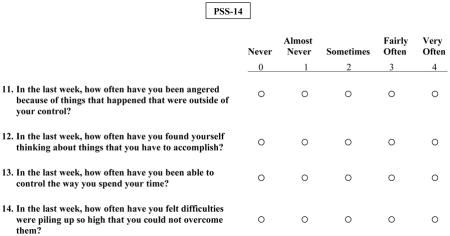
Appendix 2: Cohen’s Perceived Stress Scale (PSS), a 14-item scale designed to measure the degree to which situations in one’s life are appraised as stressful.11 The PSS has been shown to be a predictor of psychological symptoms, physical symptoms, and utilization of health services. The mean Cohen’s PSS score for working adult men and women ages 26–35 years is 25.0 ± 8.2.12 The mean Cohen’s PSS scores for college-age men is 22.4 ± 6.8, and for college-age women is 23.6 ± 7.6.13 Cronbach’s alpha coefficient for the internal reliability of the scale is 0.78.14
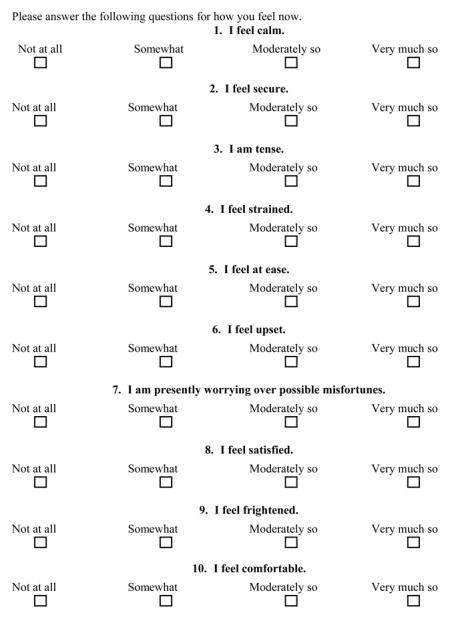
Appendix 3: Spielberger State Anxiety Index, a scale for measuring anxiety and has been used in simulated trauma scenarios for resident trainees.15 It includes 20 questions with a scale (20 to 80 points, higher score indicates higher anxiety) to describe how the respondent feels at a particular moment in time (state anxiety) using subjective feelings of apprehension, tension, nervousness, worry, and activation/arousal of the autonomic nervous system.16 In a population of working adults (n = 1,387/451 Men/Women), the mean Spielberger State Anxiety Index is 35.7 ± 10.4, and in college students (n = 296/481 M/W) the mean is 38.8 ± 12.17 The internal consistency of the state anxiety scale has an alpha of 0.92.15
Appendix 4: Resiliency and Daily Well-being Surveys. Two questions provided an abbreviated index of the Connor-Davidson Resilience Scale.18 The mean Connor-Davidson Resilience Scale score is 6.91 ± 1.5 in a general adult population.18 Four questions provided a fast and simple assessment of daily well-being as used in employee wellness trials at our institution.19 For the stress level (scale 0–10), a report at our institution on a cohort of 104 employees undergoing a stress reduction program found a mean stress level of 4.2 ± 2.25 at baseline, and 5.6 ± 2.07 after the 12-week program.19
First month visit 1
Three days before this visit, subjects were fitted with a Body Media Sensewear (BodyMedia, Inc., Pittsburgh, PA) physical activity monitor.20 This is an elastic band worn on the upper arm that measures activity, energy expenditure, sleep, and sleep efficiency. Subjects wore the band for three days and nights until arriving for their study visit. The Daily Well-being and Resiliency Surveys were also completed at this time. To control for daytime variations, all study visits were conducted between noon and 4 pm in the Clinical Research Unit (CRU). Upon arrival, vital signs were obtained; the Daily Well-being and Resiliency Surveys were completed by the subjects. To measure dietary habits, an Automated Self-Administered 24-Hour Dietary Recall was administered.21 Subjects were placed supine in a quiet room. An 18–20 gauge intravenous catheter was placed in the antecubital fossa for blood draws. Heart rate (HR) was measured by 3-lead electrocardiogram and recorded at 1000 Hz on LabChart (AD Instruments, Colorado Springs, CO). Respiratory rate was measured by capnography with a nasal cannula, and blood pressure was measured continuously by finger plethysmography (Nexfin, Edwards Lifesciences, Irvine, CA) and confirmed periodically with an automated brachial oscillometric cuff. Stroke volume (SV), cardiac output (CO), and systemic vascular resistance (SVR) were derived from pulse contour analysis of the finger plethysmography waveform according to Nexfin algorithms.22 A Polar chest belt was fitted that transmits HR to a proprietary HRV application on a smart phone (@-life, Mikropis Holding, Inc. Zalec, Slovenia).23
After resting in the supine position for 20 minutes, HR was recorded for HRV analysis. The electrocardiogram signal was imported into the Nevrokard Advanced HRV Analyses software (version 13.2.1, Nevrokard Kiauta k.d., Slovenia) for time and frequency domain analyses as described recently.24 Following this, venous blood draws were collected for the following assays. Serum CRP was determined as a generalized measure of systemic inflammation, elevated in chronic job strain and caregiver strain.25,26 Serum cortisol, serum epinephrine, and serum norepinephrine were determined to measure the degree of sympathoexcitation at rest and during mental stress.27 Salivary cortisol was also collected for comparison with serum cortisol. Serum interleukin-6 was collected as a biomarker shown to respond to mental stress to a greater extent than CRP.28 Inter-assay variability and coefficients of variation are described in detail in appendix 5.
Once resting blood samples were drawn, subjects were moved to a semi-recumbent chair for a computerized mental stress protocol, described in detail in appendix 5.29 Following 2 min of baseline HR and blood pressure recording and 30 s of instructions, a mathematical subtraction test commenced for 5 min, followed by the Stroop colored word conflict test for 5 min, and concluding with 4.5 min of a second mathematical subtraction test, for a total stress duration of 15 min. At the end of the 15 min, blood sampling was repeated for serum cortisol, serum epinephrine and norepinephrine, and serum interleukin-6. Saliva was collected for salivary cortisol. Following a 5 min recovery period, subjects were de-instrumented and completed a psychological distress survey modified from a mental arithmetic stress survey by Reims and colleagues.30
As detailed in the appendix 5, prior to discharge, subjects were fitted with a 24 h ambulatory blood pressure monitor. Blood pressure and HR were measured using the Spacelabs 90202 recorder (Spacelabs Inc., Snoqualmie, WA) as described by our lab.31 Subjects were also instructed to wear the Polar chest belt from bedtime to awakening the next morning, and HR was recorded by the proprietary application on a mobile smartphone (@-life, Mikropis Holding, Inc.). Finally, subjects received containers for 24 h urine collection and were instructed to return all devices 24 h later. Urine was analyzed for cortisol, epinephrine, and norepinephrine as indicators of stress over 24 h and controls for circadian variability.32–34
Follow-up visit 2
Subjects were not scheduled following a call night or during a critical care rotation. All procedures were identical to first month visit 1 as described above (last paragraph of page 8).
Measurements and statistical analysis
Data are summarized using mean ± SD for continuous variables. Daily Well-being and Resiliency scores were averaged for the three preceding days and the visit day, on the day of study visits 1 and 2.
RESULTS
Demographics
Thirteen of 18 (72%) incoming anesthesia residents were consented and enrolled. Enrolled subjects consisted of seven men and six women. No health issues or medications were detected by the screen nurses that precluded participation. The mean age of enrollees was 29.2 ± 1.9 years and the mean body mass index was 22.6 ± 2.8 kg/m2. All thirteen subjects completed the screen questionnaires and the first month visit 1, while one subject was automatically excluded from follow-up visit 2 because of pregnancy.
Psychological variables
Table 1 displays the psychological and estimated daily physical activity variables that were collected at all three time points. Reference values are listed for each survey where applicable.
Table 1.
Psychological variables and activity at screen, first month, and follow-up visit.
| Variable | Screen | First month visit 1 | Follow-up visit 2 | Reference values |
|---|---|---|---|---|
| Cohen’s PSS (0–56: low–high) | 17.8 ± 6.5 | 23.6 ± 5.3 | 19.1 ± 6.1 | 25.0 ± 8.212 |
| Spielberger SAI (20–80: low–high) | 34.5 ± 9.4 | 38.7 ± 10.7 | 32.7 ± 6.3 | 35.7 ± 10.417 |
| CD-RISC2 (0–8: low–high) | 6.9 ± 1.0 | 6.6 ± 0.8 | 6.5 ± 0.9 | 6.9 ± 1.518 |
| Stress Level (0–10: low–high) | 3.5 ± 1.8 | 5.9 ± 2.0 | 4.4 ± 1.7 | 4.2 ± 2.2519 |
| Energy Level (0–10: low–high) | 6.8 ± 2.2 | 5.4 ± 2.1 | 6.2 ± 1.5 | |
| Concentration (0–10: poor–good) | 7.1 ± 2.1 | 6.2 ± 1.2 | 6.5 ± 1.4 | |
| Quality of Sleep (0–10: poor–good) | 7.2 ± 2.5 | 5.8 ± 2.4 | 6.8 ± 1.5 | |
| Est. Daily Physical Activity (METS) | 7.3 ± 4.9 | 7.2 ± 4.2 | 6.3 ± 6.7 |
Data are presented as mean ± SD. Data for the screen condition was collected by mail-in questionnaires prior to the start of residency, including estimated daily physical activity that was determined by the Minnesota Leisure-Time Physical Activity Questionnaire. PSS, perceived stress scale; SAI, state anxiety index; CD-RISC, Connor-Davidson Resiliency Scale abbreviated; METS, metabolic equivalents. As described in the Methods, reference values are published means from similar populations where available.
Measured health behaviors and chronic stress biomarkers during first-month visit 1 and follow-up visit 2
Table 2 displays energy expenditure, physical activity, sleep, and sleep efficiency measured by the arm accelerometer band. Dietary caloric intake and caloric components from the Automated Self-Administered 24-Hour Dietary Recall online service are shown. Finally, the 24 h urinary cortisol, catecholamines, and CRP are also depicted.
Table 2.
Measured health behaviors and chronic stress biomarkers during study visits.
| Variable | First month visit 1 | Follow-up visit 2 |
|---|---|---|
| Daily Energy Expenditure (Cal) | 3021 ± 691 | 3111 ± 663 |
| Daily Physical Activity > 3 METS (hr) | 3.8 ± 1.4 | 4.1 ± 1.2 |
| Daily Sleep (hrs) | 6.5 ± 1.1 | 6.7 ± 1.2 |
| Daily Sleep Efficiency (%) | 83.8 ± 4.7 | 85.4 ± 5.4 |
| Caloric Intake, 24-hr (Cal) | 2349 ± 1282 | 2189 ± 871 |
| • Fat Intake, 24-hr (g) | 97.7 ± 57.9 | 81.5 ± 41.9 |
| • Saturated Fat Intake, 24-hr (g) | 36.7 ± 23.4 | 30.8 ± 21.3 |
| • Carbohydrate Intake, 24-hr (g) | 244.2 ± 148.5 | 244.7 ± 116.1 |
| • Sodium Intake, 24-hr (mg) | 4088 ± 1953 | 4287 ± 1523 |
| Urine Cortisol, 24-hr (mcg/dl) | 30.23 ± 14.02 | 29.42 ± 9.20 |
| Urine Epinephrine, 24-hr (mcg/dl) | 8.85 ± 6.01 | 8.46 ± 5.11 |
| Urine Norepinephrine, 24-hr (mcg/dl) | 36.62 ± 16.23 | 35.67 ± 10.04 |
| Serum C-Reactive Protein (mg/dl) | 0.066 ± 0.086 | 0.074 ± 0.077 |
Data are presented as mean ± SD. Data for the screen condition was collected by mail-in questionnaires prior to the start of residency, including estimated daily physical activity that was determined by the Minnesota Leisure-Time Physical Activity Questionnaire. PSS, perceived stress scale; SAI, state anxiety index; CD-RISC, Connor-Davidson Resiliency Scale abbreviated; METS, metabolic equivalents.
Cardiac autonomic modulation at rest and during acute mental stress
Table 3 lists the HRV measures during 10 min supine rest and 15 min mental stress, and the Reims perceived stress scores that were collected immediately after completion of the mental stressor.
Table 3.
Heart rate variability during supine rest and during mental stress
| First month visit 1 | Follow-up visit 2 | |||
|---|---|---|---|---|
| Variable | Rest | Mental stress | Rest | Mental stress |
| Mean NN | 1044.5 ± 177.1 | 811.1 ± 180.2 | 1062.9 ± 209.9 | 825.0 ± 151.1 |
| SDNN (ms) | 71.1 ± 38.9 | 77.0 ± 27.2 | 66.9 ± 27.7 | 75.6 ± 24.4 |
| RMSSD (ms) | 68.0 ± 56.9 | 42.1 ± 25.2 | 57.5 ± 27.2 | 42.1 ± 19.9 |
| LF (ms2) | 750.1 ± 1212.6 | 330.1 ± 272.0 | 574.3 ± 881.6 | 329.0 ± 224.6 |
| HF (ms2) | 567.1 ± 917.7 | 164.8 ± 127.2 | 455.1 ± 507.8 | 152.7 ± 80.6 |
| LFnu | 51.3 ± 14.1 | 62.3 ± 12.4 | 47.8 ± 16.4 | 60.9 ± 12.6 |
| HFnu | 44.8 ± 12.9 | 30.1 ± 12.4 | 48.3 ± 16.1 | 30.1 ± 10.3 |
| LF/HF | 1.37 ± 0.9 | 2.6 ± 1.6 | 1.3 ± 1.0 | 2.5 ± 1.7 |
| Perceived Stress Score | 24.1 ± 4.3 | 22.9 ± 3.4 | ||
Data presented as mean ± SD. Perceived stress scores acquired immediately after stress trial as described in text. Mean NN, mean normal-to-normal interval; SDNN, standard deviation of the N-N intervals; RMSSD, square root of the mean squared differences of successive N-N intervals; LF, low frequency; HF, high frequency; LFnu, low frequency normalized units; HFnu, high frequency normalized units; LF/HF, LF-to-HF ratio; MAP, mean arterial pressure.
Cardiovascular hemodynamics and acute stress biomarkers at rest, during, and after acute mental stress
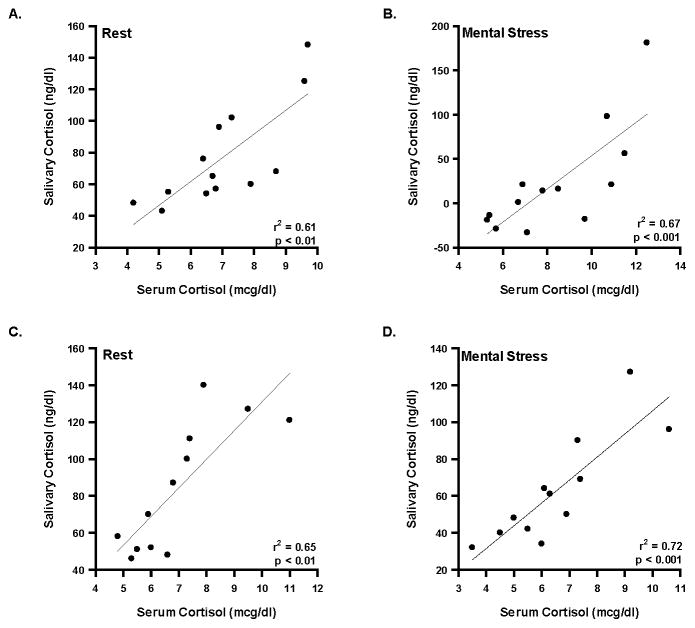
Hemodynamic variables in the mental stress trials are listed for both visits in table 4. The acute stress biomarkers collected at the conclusion of the resting HRV and immediately following mental stress are displayed in table 5. To compare the two methods of obtaining cortisol (serum and saliva), a linear regression was performed on the absolute values of serum versus salivary cortisol at rest and during mental stress in both visits. The serum and saliva samples were collected in separate tubes and processed in different labs (serum cortisol: Immunochemical lab in the Mayo CRU; salivary cortisol: Endocrinology lab at Mayo). As shown in figure 2, the correlation coefficients in all four conditions were significant (P < 0.01 for all).
Table 4.
Hemodynamics before, during, and recovery from mental stress
| First month visit 1 | Follow-up visit 2 | |||||
|---|---|---|---|---|---|---|
| Variable | Rest | Mental stress | Recovery | Rest | Mental stress | Recovery |
| HR (bpm) | 64.0 ± 12.4 | 78.2 ± 16.1 | 63.6 ± 12.9 | 58.4 ± 21.1 | 69.9 ± 24.9 | 57.0 ± 19.8 |
| SBP (mmHg) | 129.9 ± 9.1 | 143.3 ± 12.4 | 136.9 ± 14.1 | 117.6 ± 36.8 | 132.1 ± 40.9 | 124.0 ± 38.8 |
| DBP (mmHg) | 75.0 ± 5.7 | 83.2 ± 7.8 | 77.8 ± 8.4 | 68.0 ± 21.2 | 75.6 ± 24.1 | 69.4 ± 21.8 |
| MAP (mmHg) | 95.5 ± 5.4 | 107.2 ± 9.3 | 100.2 ± 9.1 | 87.0 ± 27.0 | 97.9 ± 30.9 | 89.9 ± 28.1 |
| Cardiac Output (L/min) | 6.8 ± 1.4 | 8.3 ± 1.7 | 7.0 ± 1.4 | 6.3 ± 2.1 | 7.6 ± 2.5 | 6.5 ± 2.2 |
| Stroke Volume (ml) | 108.7 ± 21.3 | 108.3 ± 19.7 | 111.9 ± 21.0 | 102.6 ± 36.6 | 104.0 ± 36.4 | 107.5 ± 37.5 |
| SVR (dyn·s/cm5) | 1172.8 ± 268.3 | 1079.6 ± 241.2 | 1180.5 ± 226.6 | 1122.2 ± 158.2 | 1036.5 ± 141.8 | 1126.3 ± 154.5 |
Data presented as mean ± SD. HR, heart rate; SBP, systolic blood pressure; DBP, diastolic BP, MAP, mean arterial pressure; SVR, systemic vascular resistance.
Table 5.
Stress biomarkers before and after mental stress
| First month visit 1 | Follow-up visit 2 | |||
|---|---|---|---|---|
| Variable | Rest | Mental stress | Rest | Mental stress |
| Serum cortisol (mcg/dl) | 7.01 ± 1.66 | 8.36 ± 2.46 | 7.0 ± 1.80 | 6.53 ± 1.96 |
| Salivary cortisol (ng/dl) | 76.7 ± 31.9 | 99.4± 63.5 | 84.3 ± 34.5 | 62.8 ± 28.8 |
| Serum Epi (pg/ml) | 13.7 ± 9.4 | 25.4 ± 16.1 | 17.3 ± 11.7 | 27.8 ± 12.3 |
| Serum NE (pg/ml) | 155.4 ± 53.0 | 203.7 ± 58.9 | 171.2 ± 52.4 | 212.1 ± 62.5 |
| Serum IL-6 (pg/ml) | 0.81 ± 0.69 | 0.83 ± 0.69 | 0.84 ± 0.71 | 0.85 ± 0.70 |
Data are presented as mean ± SD. Epi, epinephrine; NE, norepinephrine; IL-6, interleukin-6. Due to the counter-intuitive nature of cortisol decreasing in response to mental stress during visit 2, a linear regression analysis was highly significant for serum vs. salivary cortisol in all four conditions (rest, mental stress, visit 1, visit 2) as described in the text.
Figure 2. Linear regression analysis of serum versus salivary cortisol.
A) displays the correlation between serum and salivary cortisol at rest during visit 1; B) displays the correlation between serum and salivary cortisol during mental stress in visit 1. C) displays the correlation between serum and salivary cortisol at rest during visit 2; D) displays the correlation between serum and salivary cortisol during mental stress in visit 2.
Ambulatory hemodynamics and nighttime cardiac autonomic modulation
Table 6 displays the 24 h ambulatory blood pressure monitor variables from the ambulatory cuff and nighttime HRV from the chest belt.
Table 6.
Twenty-four hour ambulatory hemodynamics and night-time heart rate variability
| Variable | First month visit 1 | Follow-up visit 2 |
|---|---|---|
| HR (bpm) | ||
| 24-hr | 67.3 ± 10.6 | 70.1 ± 10.3 |
| Day | 70.6 ± 11.7 | 73.3 ± 10.5 |
| Night | 58.6 ± 8.8 | 60.3 ± 9.8 |
| SBP (mmHg) | ||
| 24-hr | 118.8 ± 11.7 | 119.4 ± 8.7 |
| Day | 121.7 ± 11.3 | 121.2 ± 7.6 |
| Night | 110.0 ± 13.5 | 109.4 ± 12.3 |
| DBP (mmHg) | ||
| 24-hr | 71.3 ± 8.6 | 71.3 ± 8.0 |
| Day | 75.1 ± 8.9 | 75.6 ± 8.4 |
| Night | 60.4 ± 8.9 | 59.1 ± 6.8 |
| MAP (mmHg) | ||
| 24-hr | 86.7 ± 8.7 | 86.4 ± 7.0 |
| Day | 90.1 ± 8.5 | 91.1 ± 8.1 |
| Night | 76.8 ± 9.3 | 75.4 ± 7.4 |
| Night-time HRV | ||
| Mean NN | 1114.3 ± 179.8 | 1009.1 ± 158.5 |
| SDNN (ms) | 131.0 ± 24.8 | 150.0 ± 85.5 |
| RMSSD (ms) | 66.6 ± 22.8 | 70.3 ± 59.6 |
| LF (ms2) | 869.5 ± 695.2 | 906.3 ± 972.4 |
| HF (ms2) | 721.0 ± 585.9 | 976.4 ± 1705.3 |
| LFnu% | 54.4 ± 10.1 | 58.2 ± 10.5 |
| HFnu% | 45.6 ± 10.1 | 41.8 ± 10.5 |
| LF:HF ratio | 1.31 ± 0.62 | 1.53 ± 0.59 |
Data are presented as mean ± SD. HR, heart rate; SBP, systolic blood pressure; DBP, diastolic blood pressure; MAP, mean arterial pressure; HRV, heart rate variability. LFnu% is derived from LF/LF+HF and HFnu% is derived from HF/LF+HF as described in the text.
DISCUSSION
The overall goal of this pilot study was to determine the feasibility of enrolling and collecting high-resolution psychological and physiological variables in incoming resident physicians. The exploratory study objective was to measure stress variables and related health behaviors that have direct implications for professionalism, quality of healthcare, and well-being of residents. The novel nature of our report is the prospective design in a defined cohort of new residents newly exposed to the similar occupational stress of the operating environment. Because of the paucity of literature specific to the repeated measures and stress conditions in this investigation, no data were available to generate a priori definition of primary outcomes and a data analytic plan. The sample size was dependent on the number of incoming residents that were available, with a 72% enrollment rate. While the sample size was underpowered to make statistical inferences from our findings, the findings instead will allow power analysis for future study design of trials examining occupational stress and stress-reducing interventions.
Well-being in residents is associated with their capacity for empathy and patient care,35,36 and it has been postulated that the stressors of residency may counter the goals of training to promote professionalism and high-quality patient care.37,38 Scores indicative of burnout have been associated with lower medical student empathy scores and with lower professionalism climate scores observed in medical students, residents, and faculty.39,40 Specific to anesthesiology, perioperative patient safety and efficiency requires high performance by a health care team that absolutely depends on professionalism among anesthesia providers.7 Early in training, anesthesia residents are likely to perceive a low degree of latitude in the setting of high expectations or demand.
Additional measures of well-being such as health behaviors were gathered to gain insight into factors that would potentially influence perceived stress. Resilience is a measure of coping ability, hardiness, and the ability to thrive in the face of adversity.18 Based on the resiliency scores, our subjects appeared to adapt their schedules and health behaviors to combat the sudden disruption in work-life balance, an idea that has been described as a “time for temporary imbalance,” when professional effort gives way to other life domains.8 It is cautionary that residents may have already become accustomed to intermittent work-life imbalances, as a variety of internship rotations were likely filled with novel professional and personal challenges. Residents may also be particularly optimistic about the onset of training in their field of choice, and welcomed the onset of anesthesiology as a stressful yet engaging stressor.
Decreased HRV indicates a sympathetic dominance and/or reduced vagal activity which occurs in normal aging and many pathological conditions including hypertension, diabetes, and heart failure.41 Detrimental effects of job strain are partly mediated through increased HR reactivity to a stressful workday, increased systolic blood pressure, and lower vagal tone.42 A recent study using 24 h Holter monitors on 54 residents in multiple specialties found that those who reported high job strain (high-demand, low-latitude) had decreased HRV compared to low strain residents.43 This is consistent with an earlier study in non-physician middle-age males that showed job strain and low decision latitude were associated with a reduction in cardiac vagal control (HF) and elevations in sympathetic control (LF).44 Thus, we measured both daytime resting and nighttime HRV in the first month and follow-up visit. We were also interested in the HRV response to laboratory mental stress during the stress encountered in starting residency, as we have previously shown that dietary sodium affects HRV at rest and during mental stress in healthy non-physician men and women.24 One drawback of this methodology is the detection of HRV alterations in subjects who are healthy, physically fit trainees with little change in their lifestyle habits (including sleep). Additionally, while some authors have reported that vagal control (HF) is reduced with stress42,45,46 other studies have shown no relationship,47,48 and the overall utility of HRV in sleep deprivation is mixed.49 Finally, perceived control is highly predictive of stress, and because residents select their training site, they may have a high level of perceived control over the challenges they encounter as new residents.50
Two endocrine response systems are particularly reactive to psychological stress: the hypothalamic-pituitary-adrenocortical (HPA) axis and the sympathoadrenal system.51 Cortisol, the primary effector of HPA activation in humans, is a common biomarker in stress research. Catecholamines, which are released in response to sympathoadrenal activation, work in concert with the autonomic nervous system to exert regulatory effects on the cardiovascular and immune system among others. Prolonged or repeated activation of the HPA axis and sympathoadrenal systems can interfere with their control of other physiological systems, resulting in increased risk for physical and psychiatric disorders.11,52 It is noteworthy that in healthy volunteers, the search for a consistent and reliable chronic stress biomarker remains a major challenge as recently reviewed in a meta-analysis of 31 studies on 38 biomarkers.53
A limitation of measuring serum and salivary cortisol levels is the wide range of inter-individual variance. The kinetics of cortisol production and metabolism is dependent on circadian rhythm, menstrual cycle, oral contraceptives, and cortisol binding globulin which, aside from circadian rhythm, were not controlled for in this study cohort.32,54 Additionally, an interpretive challenge arises when the change in cortisol values from rest to stress falls within the assay’s coefficient of variation, as it did for several of our subjects. For example, the finding that cortisol values decreased in response to mental stress during the follow-up visit seemed counterintuitive. To address this, we found that serum cortisol strongly correlated with salivary cortisol, which re-enforced the integrity of the cortisol values.
Additional limitations of this report deserve mention. Despite the strength that every participant in this cohort was subjected to a similar occupational stressor (the operating room environment at one institution as opposed to a multitude of rotations), the delicate nature of studying new resident trainees within the ethical boundaries of confidentiality and coercion limited the number of participants. We acknowledge the potential for selection bias, as the degree of resiliency in our participants may be such that many of the psychological and physiological variables explored were not affected by the stress of starting residency, but might be affected in a broader population of trainees. Finally, protocols of this nature are limited by the logistical challenge of prospective data collection in resident volunteers across convenient time points.
Preservation of health behaviors with respect to diet, physical activity level, and quality of sleep confer resiliency during periods of acute stress. Strategies to preserve or enhance these health behaviors merit further evaluation. The overall implication for resident education and occupational wellness is that subjective surveys quantifying psychological stress remain an important tool for prospective, longitudinal cohort studies. The development of objective, high-resolution physiological variables remains a significant challenge in identifying useful variables in a cohort of physician trainees. Given the importance of physician burnout in our country, the impact of chronic stress on resident wellness requires further study. Future protocols with larger samples capable of detecting psychological and physiological effects of occupational stress will require multiple time points to appreciate the full nature of chronic job strain and its relevance to interventions designed to optimize the training experience. This report demonstrates the feasibility of studies of this nature, and provides the preliminary data necessary to generate a priori definition of primary outcomes and a data analytic plan.
Acknowledgments
Darrell R. Schroeder, M.S.
Affiliation: Department of Biostatistics, Mayo Clinic, Rochester, MN
Ravinder J. Singh, Ph.D.
Affiliation: Department of Laboratory Medicine/Pathology, Mayo Clinic, Rochester, MN
Hilary E. Blair
Affiliation: Department of Laboratory Medicine/Pathology, Mayo Clinic, Rochester, MN
Sarah C. Wolhart, R.N.
Affiliation: Affiliation: Department of Anesthesiology, Mayo Clinic, Rochester, MN
Funding: This research is supported by Mikropis Holding, Aškerčeva 4a, 3310 Žalec, Slovenija; the Mayo Clinic Department of Anesthesiology, 200 First Street SW, Rochester, MN 55905; and by grant (UL1 TR000135) National Institutes of Health Center for Translational Science Activities, Bethesda, MD.
Appendix 1: Minnesota Leisure Time Activity Questionnaire
Appendix 2: Cohen’s Perceived Stress Scale-14
Appendix 3. Spielberger State Anxiety Index
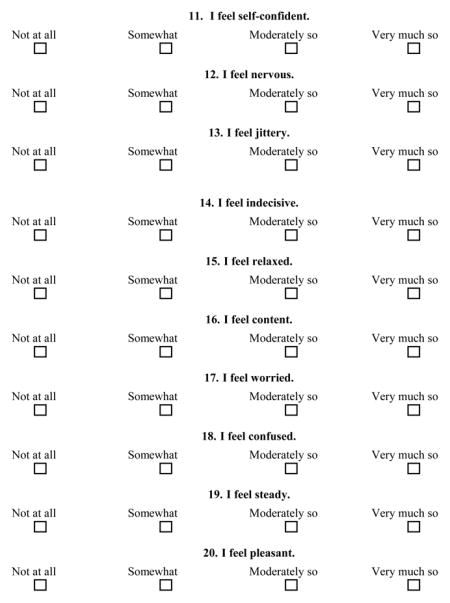
Appendix 4: Resiliency and Daily Well-being Surveys
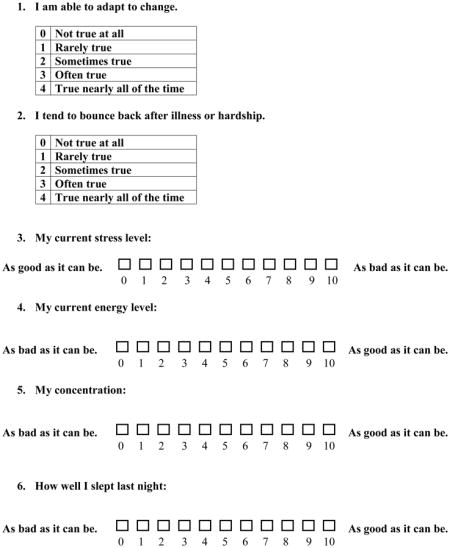
Appendix 5. Supplemental methods
Heart rate variability
Components of HRV included mean HR, mean NN interval, standard deviation of normalized RR intervals (SDNN), square root of the mean squared difference of successive normalized RR intervals (RMSSD), low frequency (LF), high frequency (HF), low frequency normalized units (LFnu), high frequency normalized units (HFnu), and LF/HF ratio.
Mental stress
The computerized mental stress protocol was conducted in a semi-recumbent study chair with the legs elevated to the approximate level of the heart. Headphones were placed for automated audio input. Following 2 min of baseline HR and BP recording, a voiced recording of the printed instructions were played for each subject lasting 30 seconds. The instructions reminded subjects that their best effort was required and that their performance on the test would be compared to the other subjects. A computerized mathematical subtraction test for 4.5 minutes, was administered as described in detail elsewhere.24 To maximize the stress induced, the standard recording (via headphones) used vocally consistent monologue urging each subject to respond faster and to concentrate fully throughout the test. This was followed by 30 second instructions for a Stroop colored word test, then a 4.5 min computerized version of the Stroop colored word conflict test used previously in our laboratory was given.29 When this portion was completed, a second 5 min mental stress test immediately commenced, for a total stress duration of 15 minutes.
Following a 5 min recovery period, subjects were de-instrumented and completed a psychological distress survey modified from a mental arithmetic stress survey by Reims and colleagues, consisting of three questions: (1) Did you feel stressed while performing the color word task? (i.e., “perceived stress”); (2) Was it important for you to obtain a good result on the color word task? (3) How did you experience the task altogether? In response to each question, subjects marked one of ten unnumbered boxes between extremes of least to highest degrees of perceived stress, effort, and overall discomfort, respectively.
Ambulatory blood pressure monitoring
Following discharge from our laboratory, subjects were outfitted with an ambulatory blood pressure monitor (ABPM) Spacelabs 90202 recorder (Spacelabs Inc., Issaquah, WA, USA) as described by our lab.31 The participants were asked to continue their regular activities and to go to bed no later than 11 PM, but were not allowed to exercise during the 24-hr recording period. Systolic BP (SBP), diastolic BP (DBP) and heart rate were measured every 15 min from 6 AM to 10 PM, and every 20 min from 10PM to 6 AM. The daytime period was defined as the interval from 8 AM to 10 PM; nighttime, from midnight to 6 AM (40,41). The standard deviation (SD) and coefficient of variation (CV) of the 24-h recordings were used as an index of HR, systolic blood pressure (SBP) and mean arterial pressure (MAP) variability. Nocturnal dipping was expressed as the nocturnal fall in BP calculated as the difference between daytime and nighttime BP adjusted for the daytime BP level and expressed in percentages.
Overnight heart rate variability
Subjects were also instructed to wear the Polar chest belt from bedtime to awakening the next morning, and HR was recorded by the proprietary application on a mobile smartphone (@-life, Mikropis Holding, Inc. Zalec, Slovenia).
Biomarker measurements and assays
Serum cortisol was measured by a competitive binding immunoenzymatic assay on the DxI automated immunoassay system (Beckman Instruments, Chaska, MN 55318). Intra-assay CV’s are 13.1%, 9.4%, and 6.6% at 1.56, 2.85 and 30.2 ug/dL respectively. Inter-assay CV’s are 9.0%, 8.1%, and 9.3% at 2.47, 17.3, and 27.5 ug/dL respectively. (12-22-09). The lower limit of the CRR is 0.4 μg/dL.
Salivary cortisol was measured by liquid chromatography-tandem mass spectrometry (LC-MS/MS) (Thermo Fisher Scientific, Franklin, Massachusetts 02038 and Applied Biosystems-MDS Sciex, Foster City, CA 94404). Saliva intra-assay C.V.’s are 5.6%, 4.5%, and 2.6% at 53.5, 292.5, and 1611.5 ng/dl, resp.; Inter-assay C.V.’s are 15.2%, 7.5%, and 8.1% at 49.6, 293.3, and 1560.5 ng/dl, resp.
Urinary cortisol was measured by liquid chromatography-tandem mass spectrometry (LC-MS/MS) (Thermo Fisher Scientific, Franklin, Massachusetts 02038 and Applied Biosystems-MDS Sciex, Foster City, CA 94404). Intra-assay C.V.’s are 6.8%, 6.9%, and 5.0% at 0.84, 4.88, and 13.57 mcg/dl, resp. Urine inter-assay C.V.’s are 10.3%, 6.7%, 6.8% at 0.88, 4.6, and 13.0 mcg/dl, resp.
Serum catecholamines were measured by reversed phase HPLC with electrochemical detection after extraction with activated alumina. Serum intra-assay C.V.’s are: Norepinephrine 4.5% and 3.3% at 224 and 429 pg/mL; Epinephrine 12.2% and 3.6% at 13.8 and 242 pg/mL; Inter-assay C.V.’s are: Norepinephrine 4.6% and 8.6% at 235 and 1096 pg/mL; Epinephrine 6.4% and 8.2% at 61and 917 pg/mL.
Urine catecholamines were measured by reversed phase HPLC with electrochemical detection after extraction with activated alumina. Urine intra-assay C.V.’s are: Norepinephrine 2.1% at 6.0 ng/ml; Epinephrine 3.9% at 2.3 ng/ml; Urine inter-assay C.V.’s are: Norepinephrine 13.8%, 9.0% and 11.9% at 1.3, 22, and 156 ng/ml, resp; Epinephrine 11.0%, 7.3%, and 8.7% at 0.96, 8.9, and 34 ng/ml, resp.
Serum C-Reactive Protein, High Sensitivity was measured on the Roche Cobas c311 chemistry analyzer (Roche Diagnostics, Indianapolis, IN 46250) by a latex particle enhanced immunoturbidimetric assay from Roche Diagnostics. Intra-assay CV’s are 1.9%, 1.0%, and 0.2% at 0.107, 0.179, and 1.227 mg/dL respectively. Inter-assay CV’s are 2.4%, 1.7%, and 3.4% at 0.107, 0.171, and 1.226 mg/dL respectively.
Interleukin 6, high sensitivity was measured by a quantitative two-site enzyme immunoassay from R & D Systems (Minneapolis, MN 55413). Intra-assay C.V.’s are 8.4%, 3.6% and 4.0% at 0.42, 3.88, and 9.77 pg/mL respectively. Inter-assay C.V.’s are 9.7%, 7.6%, and 7.7% at 0.52, 2.91, and 5.53 pg/mL respectively.
Footnotes
Competing Interests:
John H. Eisenach, M.D., Juraj Sprung, M.D., Ph.D., and Matthew M. Clark, Ph.D. received travel expense reimbursement from Mikropis Holding LLC, for oral presentation at “European Conference on the Physiology of Stress” in Ljubljana, Slovenia on May 20–21, 2013. All other authors declare no competing interests.
Contributor Information
John H. Eisenach, Department of Anesthesiology, Mayo Clinic, Rochester, MN
Juraj Sprung, Department of Anesthesiology, Mayo Clinic, Rochester, MN
Matthew M. Clark, Department of Psychology, Mayo Clinic Rochester, MN
Tait D. Shanafelt, Division of Hematology, Department of Medicine; Mayo Clinic, Rochester, MN
Bruce D. Johnson, Department of Cardiovascular Diseases, Mayo Clinic, Rochester, MN
Timothy N. Kruse, Department of Anesthesiology, Mayo Clinic, Rochester, MN
Daniel P. Chantigian, Department of Anesthesiology, Mayo Clinic, Rochester, MN
Jason R. Carter, Department of Kinesiology and Integrative Physiology, Michigan Technological University, Houghton, MI
Timothy R. Long, Department of Anesthesiology, Mayo Clinic, Rochester, MN
References
- 1.Shanafelt T. Burnout in anesthesiology: A call to action. Anesthesiology. 2011;114:1–2. doi: 10.1097/ALN.0b013e318201cf92. [DOI] [PubMed] [Google Scholar]
- 2.Shanafelt TD, Sloan JA, Habermann TM. The well-being of physicians. Am J Med. 2003;114:513–9. doi: 10.1016/s0002-9343(03)00117-7. [DOI] [PubMed] [Google Scholar]
- 3.Shanafelt TD, Boone S, Tan L, Dyrbye LN, Sotile W, Satele D, West CP, Sloan J, Oreskovich MR. Burnout and satisfaction with work-life balance among US physicians relative to the general US population. Arch Intern Med. 2012;172:1377–85. doi: 10.1001/archinternmed.2012.3199. [DOI] [PubMed] [Google Scholar]
- 4.West CP, Huschka MM, Novotny PJ, Sloan JA, Kolars JC, Habermann TM, Shanafelt TD. Association of perceived medical errors with resident distress and empathy: A prospective longitudinal study. JAMA. 2006;296:1071–8. doi: 10.1001/jama.296.9.1071. [DOI] [PubMed] [Google Scholar]
- 5.West CP, Tan AD, Habermann TM, Sloan JA, Shanafelt TD. Association of resident fatigue and distress with perceived medical errors. JAMA. 2009;302:1294–300. doi: 10.1001/jama.2009.1389. [DOI] [PubMed] [Google Scholar]
- 6.West CP, Shanafelt TD, Kolars JC. Quality of life, burnout, educational debt, and medical knowledge among internal medicine residents. JAMA. 2011;306:952–60. doi: 10.1001/jama.2011.1247. [DOI] [PubMed] [Google Scholar]
- 7.Hyman SA, Michaels DR, Berry JM, Schildcrout JS, Mercaldo ND, Weinger MB. Risk of burnout in perioperative clinicians: A survey study and literature review. Anesthesiology. 2011;114:194–204. doi: 10.1097/ALN.0b013e318201ce9a. [DOI] [PubMed] [Google Scholar]
- 8.Ratanawongsa N, Wright SM, Carrese JA. Well-being in residency: A time for temporary imbalance? Med Educ. 2007;41:273–80. doi: 10.1111/j.1365-2929.2007.02687.x. [DOI] [PubMed] [Google Scholar]
- 9.Hunziker S, Semmer NK, Tschan F, Schuetz P, Mueller B, Marsch S. Dynamics and association of different acute stress markers with performance during a simulated resuscitation. Resuscitation. 2012;83:572–8. doi: 10.1016/j.resuscitation.2011.11.013. [DOI] [PubMed] [Google Scholar]
- 10.Folsom AR, Jacobs DR, Jr, Caspersen CJ, Gomez-Marin O, Knudsen J. Test-retest reliability of the Minnesota Leisure Time Physical Activity Questionnaire. J Chronic Dis. 1986;39:505–11. doi: 10.1016/0021-9681(86)90195-5. [DOI] [PubMed] [Google Scholar]
- 11.Cohen S, Kessler RC, Gordon UL. Strategies for measuring stress in studies of psychiatric and physical disorder. In: Cohen S, Kessler RC, Gordon UL, editors. Measuring Stress: A Guide for Health and Social Scientists. New York: Oxford University Press; 1995. pp. 3–26. [Google Scholar]
- 12.Andreou E, Alexopoulos EC, Lionis C, Varvogli L, Gnardellis C, Chrousos GP, Darviri C. Perceived Stress Scale: Reliability and validity study in Greece. Int J Environ Res Public Health. 2011;8:3287–98. doi: 10.3390/ijerph8083287. [DOI] [PMC free article] [PubMed] [Google Scholar]
- 13.Cohen S, Kamarck T, Mermelstein R. A global measure of perceived stress. J Health Soc Behav. 1983;24:385–96. [PubMed] [Google Scholar]
- 14.Werneburg BL, Herman LL, Preston HR, Rausch SM, Warren BA, Olsen KD, Clark MM. Effectiveness of a Multidisciplinary Worksite Stress Reduction Programme for Women. Stress Health. 2011;27:356–64. [Google Scholar]
- 15.Harvey A, Bandiera G, Nathens AB, LeBlanc VR. Impact of stress on resident performance in simulated trauma scenarios. J Trauma Acute Care Surg. 2012;72:497–503. doi: 10.1097/ta.0b013e31821f84be. [DOI] [PubMed] [Google Scholar]
- 16.Julian LJ. Measures of anxiety: State-Trait Anxiety Inventory (STAI), Beck Anxiety Inventory (BAI), and Hospital Anxiety and Depression Scale-Anxiety (HADS-A) Arthritis Care Res. 2011;63 (Suppl 11):S467–72. doi: 10.1002/acr.20561. [DOI] [PMC free article] [PubMed] [Google Scholar]
- 17.Spielberger CD. STAI Adult Manual: State-Trait Anxiety Inventory for Adults (Forms Y1 and Y2) Mind Garden, Inc; Menlo Park, CA: 1983. [Google Scholar]
- 18.Vaishnavi S, Connor K, Davidson JR. An abbreviated version of the Connor-Davidson Resilience Scale (CD-RISC), the CD-RISC2: Psychometric properties and applications in psychopharmacological trials. Psychiatry Res. 2007;152:293–7. doi: 10.1016/j.psychres.2007.01.006. [DOI] [PMC free article] [PubMed] [Google Scholar]
- 19.Clark MM, Warren BA, Hagen PT, Johnson BD, Jenkins SM, Werneburg BL, Olsen KD. Stress level, health behaviors, and quality of life in employees joining a wellness center. Am J Health Promot. 2011;26:21–5. doi: 10.4278/ajhp.090821-QUAN-272. [DOI] [PubMed] [Google Scholar]
- 20.Johannsen DL, Calabro MA, Stewart J, Franke W, Rood JC, Welk GJ. Accuracy of armband monitors for measuring daily energy expenditure in healthy adults. Med Sci Sports Exerc. 2010;42:2134–40. doi: 10.1249/MSS.0b013e3181e0b3ff. [DOI] [PubMed] [Google Scholar]
- 21.Subar AF, Kirkpatrick SI, Mittl B, Zimmerman TP, Thompson FE, Bingley C, Willis G, Islam NG, Baranowski T, McNutt S, Potischman N. The Automated Self-Administered 24-hour dietary recall (ASA24): A resource for researchers, clinicians, and educators from the National Cancer Institute. J Acad Nutr Diet. 2012;112:1134–7. doi: 10.1016/j.jand.2012.04.016. [DOI] [PMC free article] [PubMed] [Google Scholar]
- 22.Critoph CH, Patel V, Mist B, Thomas MD, Elliott PM. Non-invasive assessment of cardiac output at rest and during exercise by finger plethysmography. Clin Physiol Funct Imaging. 2013;33:338–43. doi: 10.1111/cpf.12032. [DOI] [PubMed] [Google Scholar]
- 23.Wallen MB, Hasson D, Theorell T, Canlon B, Osika W. Possibilities and limitations of the Polar RS800 in measuring heart rate variability at rest. Eur J Appl Physiol. 2012;112:1153–65. doi: 10.1007/s00421-011-2079-9. [DOI] [PubMed] [Google Scholar]
- 24.Allen AR, Gullixson LR, Wolhart SC, Kost SL, Schroeder DR, Eisenach JH. Dietary sodium influences the effect of mental stress on heart rate variability: A randomized trial in healthy adults. J Hypertens. 2014;32:374–82. doi: 10.1097/HJH.0000000000000045. [DOI] [PubMed] [Google Scholar]
- 25.Emeny R, Lacruz ME, Baumert J, Zierer A, von Eisenhart Rothe A, Autenrieth C, Herder C, Koenig W, Thorand B, Ladwig KH. Job strain associated CRP is mediated by leisure time physical activity: Results from the MONICA/KORA study. Brain Behav Immun. 2012;26:1077–84. doi: 10.1016/j.bbi.2012.07.004. [DOI] [PubMed] [Google Scholar]
- 26.Gouin JP, Glaser R, Malarkey WB, Beversdorf D, Kiecolt-Glaser J. Chronic stress, daily stressors, and circulating inflammatory markers. Health Psychol. 2012;31:264–8. doi: 10.1037/a0025536. [DOI] [PMC free article] [PubMed] [Google Scholar]
- 27.Pike TL, Elvebak RL, Jegede M, Gleich SJ, Eisenach JH. Forearm vascular conductance during mental stress is related to the heart rate response. Clin Auton Res. 2009;19:183–7. doi: 10.1007/s10286-009-0005-6. [DOI] [PMC free article] [PubMed] [Google Scholar]
- 28.Steptoe A, Hamer M, Chida Y. The effects of acute psychological stress on circulating inflammatory factors in humans: A review and meta-analysis. Brain Behav Immun. 2007;21:901–12. doi: 10.1016/j.bbi.2007.03.011. [DOI] [PubMed] [Google Scholar]
- 29.Eisenach JH, McGuire AM, Schwingler RM, Turner ST, Joyner MJ. The Arg16/Gly beta2-adrenergic receptor polymorphism is associated with altered cardiovascular responses to isometric exercise. Physiol Genomics. 2004;16:323–8. doi: 10.1152/physiolgenomics.00152.2003. [DOI] [PubMed] [Google Scholar]
- 30.Reims HM, Sevre K, Fossum E, Hoieggen A, Eide I, Kjeldsen SE. Plasma catecholamines, blood pressure responses and perceived stress during mental arithmetic stress in young men. Blood Press. 2004;13:287–94. doi: 10.1080/08037050410016474. [DOI] [PubMed] [Google Scholar]
- 31.Hesse C, Charkoudian N, Liu Z, Joyner MJ, Eisenach JH. Baroreflex sensitivity inversely correlates with ambulatory blood pressure in healthy normotensive humans. Hypertension. 2007;50:41–6. doi: 10.1161/HYPERTENSIONAHA.107.090308. [DOI] [PubMed] [Google Scholar]
- 32.Hellhammer DH, Wust S, Kudielka BM. Salivary cortisol as a biomarker in stress research. Psychoneuroendocrinology. 2009;34:163–71. doi: 10.1016/j.psyneuen.2008.10.026. [DOI] [PubMed] [Google Scholar]
- 33.Joergensen A, Broedbaek K, Weimann A, Semba RD, Ferrucci L, Joergensen MB, Poulsen HE. Association between urinary excretion of cortisol and markers of oxidatively damaged DNA and RNA in humans. PLoS One. 2011;6:e20795. doi: 10.1371/journal.pone.0020795. [DOI] [PMC free article] [PubMed] [Google Scholar]
- 34.Hansen AM, Larsen AD, Rugulies R, Garde AH, Knudsen LE. A review of the effect of the psychosocial working environment on physiological changes in blood and urine. Basic Clin Pharmacol Toxicol. 2009;105:73–83. doi: 10.1111/j.1742-7843.2009.00444.x. [DOI] [PubMed] [Google Scholar]
- 35.Shanafelt TD, Bradley KA, Wipf JE, Back AL. Burnout and self-reported patient care in an internal medicine residency program. Ann Intern Med. 2002;136:358–67. doi: 10.7326/0003-4819-136-5-200203050-00008. [DOI] [PubMed] [Google Scholar]
- 36.Shanafelt TD, West C, Zhao X, Novotny P, Kolars J, Habermann T, Sloan J. Relationship between increased personal well-being and enhanced empathy among internal medicine residents. J Gen Intern Med. 2005;20:559–64. doi: 10.1111/j.1525-1497.2005.0108.x. [DOI] [PMC free article] [PubMed] [Google Scholar]
- 37.Mareiniss DP. Decreasing GME training stress to foster residents’ professionalism. AAMC. 2004;79:825–31. doi: 10.1097/00001888-200409000-00003. [DOI] [PubMed] [Google Scholar]
- 38.Firth-Cozens J. Interventions to improve physicians’ well-being and patient care. PLos Med. 2001;52:215–22. doi: 10.1016/s0277-9536(00)00221-5. [DOI] [PubMed] [Google Scholar]
- 39.Brazeau CM, Schroeder R, Rovi S, Boyd L. Relationships between medical student burnout, empathy, and professionalism climate. Acad Med. 2010;85:S33–6. doi: 10.1097/ACM.0b013e3181ed4c47. [DOI] [PubMed] [Google Scholar]
- 40.Dyrbye LN, Massie FS, Jr, Eacker A, Harper W, Power D, Durning SJ, Thomas MR, Moutier C, Satele D, Sloan J, Shanafelt TD. Relationship between burnout and professional conduct and attitudes among US medical students. JAMA. 2010;304:1173–80. doi: 10.1001/jama.2010.1318. [DOI] [PubMed] [Google Scholar]
- 41.Xhyheri B, Manfrini O, Mazzolini M, Pizzi C, Bugiardini R. Heart rate variability today. Prog Cardiovasc Dis. 2012;55:321–31. doi: 10.1016/j.pcad.2012.09.001. [DOI] [PubMed] [Google Scholar]
- 42.Vrijkotte TG, van Doornen LJ, de Geus EJ. Effects of work stress on ambulatory blood pressure, heart rate, and heart rate variability. Hypertension. 2000;35:880–6. doi: 10.1161/01.hyp.35.4.880. [DOI] [PubMed] [Google Scholar]
- 43.Hernandez-Gaytan SI, Rothenberg SJ, Landsbergis P, Becerril LC, De Leon-Leon G, Collins SM, Diaz-Vasquez FJ. Job strain and heart rate variability in resident physicians within a general hospital. Am J Ind Med. 2012;56:38–48. doi: 10.1002/ajim.22098. [DOI] [PubMed] [Google Scholar]
- 44.Collins SM, Karasek RA, Costas K. Job strain and autonomic indices of cardiovascular disease risk. Am J Ind Med. 2005;48:182–93. doi: 10.1002/ajim.20204. [DOI] [PubMed] [Google Scholar]
- 45.Eller NH, Kristiansen J, Hansen AM. Long-term effects of psychosocial factors of home and work on biomarkers of stress. Int J Psychophysiol. 2011;79:195–202. doi: 10.1016/j.ijpsycho.2010.10.009. [DOI] [PubMed] [Google Scholar]
- 46.Dishman RK, Nakamura Y, Garcia ME, Thompson RW, Dunn AL, Blair SN. Heart rate variability, trait anxiety, and perceived stress among physically fit men and women. Int J Psychophysiol. 2000;37:121–33. doi: 10.1016/s0167-8760(00)00085-4. [DOI] [PubMed] [Google Scholar]
- 47.van Amelsvoort LG, Schouten EG, Maan AC, Swenne CA, Kok FJ. Occupational determinants of heart rate variability. Int Arch Occup Environ Health. 2000;73:255–62. doi: 10.1007/s004200050425. [DOI] [PubMed] [Google Scholar]
- 48.Riese H, Van Doornen LJ, Houtman IL, De Geus EJ. Job strain in relation to ambulatory blood pressure, heart rate, and heart rate variability among female nurses. Scand J Work Environ Health. 2004;30:477–85. doi: 10.5271/sjweh.837. [DOI] [PubMed] [Google Scholar]
- 49.Stein PK, Pu Y. Heart rate variability, sleep and sleep disorders. Sleep Med Rev. 2012;16:47–66. doi: 10.1016/j.smrv.2011.02.005. [DOI] [PubMed] [Google Scholar]
- 50.Wallston KA, Wallston BS, Smith S, Dobbins CJ. Perceived control and health. Curr Psychol. 1987;6:5–25. [Google Scholar]
- 51.Cohen S, Janicki-Deverts D, Miller GE. Psychological stress and disease. JAMA. 2007;298:1685–7. doi: 10.1001/jama.298.14.1685. [DOI] [PubMed] [Google Scholar]
- 52.McEwen BS. Protective and damaging effects of stress mediators. N Engl J Med. 1998;338:171–9. doi: 10.1056/NEJM199801153380307. [DOI] [PubMed] [Google Scholar]
- 53.Danhof-Pont MB, van Veen T, Zitman FG. Biomarkers in burnout: A systematic review. J Psychosom Res. 2011;70:505–24. doi: 10.1016/j.jpsychores.2010.10.012. [DOI] [PubMed] [Google Scholar]
- 54.Sriram K, Rodriguez-Fernandez M, Doyle FJ., 3rd Modeling cortisol dynamics in the neuro-endocrine axis distinguishes normal, depression, and post-traumatic stress disorder (PTSD) in humans. PLoS Comput Biol. 2012;8:e1002379. doi: 10.1371/journal.pcbi.1002379. [DOI] [PMC free article] [PubMed] [Google Scholar]


