

Summary
Our tactile perception of external objects depends on skin-object interactions. The mechanics of contact dictates the existence of fundamental spatiotemporal input features—contact initiation and cessation, slip, and rolling contact—that originate from the fact that solid objects do not interpenetrate. However, it is unknown whether these features are represented within the brain. We used a novel haptic interface to deliver such inputs to the glabrous skin of finger/digit pads and recorded from neurons of the cuneate nucleus (the brain’s first level of tactile processing) in the cat. Surprisingly, despite having similar receptive fields and response properties, each cuneate neuron responded to a unique combination of these inputs. Hence, distinct haptic input features are encoded already at subcortical processing stages. This organization maps skin-object interactions into rich representations provided to higher cortical levels and may call for a re-evaluation of our current understanding of the brain’s somatosensory systems.
Highlights
-
•
Specific haptic input features were selectively delivered to glabrous skin
-
•
The input features were segregated in the neurons of the cuneate nucleus
-
•
These observations may call for a shift in current views of tactile processing
Jörntell et al. demonstrate that theoretically predicted haptic input features are extensively represented in the brain’s somatosensory system. Cuneate neurons, despite having similar receptive fields and general response properties, are shown to represent different specific combinations of the input features.
Introduction
The mechanical interaction between our skin and external objects is essential to everyday life and brain development (Bushnell and Boudreau, 1993, Forssberg et al., 1995, Huntley, 1997). To date, the characterization of the corresponding somatosensory systems of the brain has relied mostly on the identification of tactile submodalities and receptive fields from punctuate stimuli (Friedman et al., 2004, Johansson and Flanagan, 2009, Mountcastle, 1997). In keeping with this view, our current understanding of the neurons of the cuneate nucleus suggests that the information conveyed by single primary afferents is sufficient to be transmitted to the thalamus (Zachariah et al., 2001). Apart from the classical description of lateral inhibition and contrast enhancement (Kandel and Schwarz, 1985), little theory exists on the possible contribution to the brain’s somatosensory processing from the cuneate neurons. Owing to contact mechanics, however, tactile stimulation gives rise to mechanical gradients that are in essence nonlocal in the sensing organ, i.e., the skin, even under the assumption of quasistatic conditions (Hayward, 2011). The processing of such input would therefore be expected to run across submodalities and receptive fields.
For the visual system, from which much of our current understanding of the sensory processing in the brain originates, a key step was the early identification of fundamental sensory visual input features (Felsen et al., 2005, Gilbert and Wiesel, 1983). For the cutaneous tactile sensory system, the families of possible contact interactions can similarly be reduced into a number of fundamental input features (Hayward, 2011). However, the possible representation of these input features in the brain remains to be tested. Today, it is known that the rodent whisker system, which is the most extensively studied somatosensory system in mammals (Diamond et al., 2008), is capable of extracting a number of features of objects coming in contact with the vibrissae such as textural details (Arabzadeh et al., 2005), object location relative to the snout (Bagdasarian et al., 2013), motion (Ego-Stengel et al., 2012), and even elements of shape (Anjum et al., 2006). Nevertheless, only a few studies were aimed at identifying the prethalamic neural processing (Minnery and Simons, 2003, Szwed et al., 2003). Furthermore, the mechanics of touch in the vibrissal system fundamentally differ from the mechanics in fingers or paw pads (Hayward, 2011) because fingers and pads are in general softer than the objects they touch, giving rise to distinct families of contact interactions that can be viewed as spatiotemporal sensory input features.
In the tactile somatosensory system, the physical interactions between the skin and the object can be utilized to provide direct information about the mechanical properties of objects, such as texture, shape, frictional properties, compliance, and other aspects. Fundamental components of such interactions are the direct consequence of the contact mechanics of two elastic objects in relative motion (Boussinesq, 1885, Johnson, 1985, Tabor, 1955). A contact can be initiated or cease to exist. When a contact exists, it can be in a sliding state or a nonsliding state. These states are considered here to be fundamental. For contact initiation and cessation, the corresponding input features are labeled “contact on” and “contact off” whereas the input feature corresponding to sliding is labeled “slip” and that corresponding to nonsliding is labeled “roll” (Hayward, 2011). Here, we delivered these input features at different velocities using a novel haptic interface (Figure 1A). In humans, using the same interface, these inputs were perceived and correctly classified as actual contact on/off, slip, and roll, respectively (Hayward et al., 2014).
Figure 1.

Stimulus Patterns and Network Structure
(A) Schematic drawings illustrating the stimulus patterns used. The slip stimulus family is a region of high strain that is displaced in somatotopic coordinates over time. Along one single somatotopic coordinate, it can be represented by a 3D plot relating strain to space and time. The roll stimulus corresponded to a wide area of low strain that is displaced in somatotopic coordinates over time. The initiation of a contact, contact on, is characterized by progressive recruitment of strained tissue over time. Not shown is contact off, which is contact on played in reverse mode (and thus requiring a preceding contact on stimulation). The control quadrant stimulus activated a local area of the skin (∼1 mm2) with a very rapid stretch, lasting 5 ms, followed by sustained strain of 5 ms and a subsequent relaxation also lasting 5 ms. The quadrant stimulus could be delivered at one out of a three-by-three array of locations at a time. Each stimulus type was applied at a number of different speeds to obtain 18 spatiotemporal stimulus conditions (not including the quadrant stimulation).
(B) Schematic illustration of the position of the cuneate nucleus neurons in relation to the primary sensory afferents from the skin and the structures of the brain’s somatosensory system. Even though there are multiple afferents of the same submodality innervating the same skin area (Johansson and Vallbo, 1979), each primary afferent may still carry specific “flavors” of the tactile event, e.g., depending on the shape of a touched object (Goodwin et al., 1997), as suggested by the color code in the figure.
Cutaneous sensation is mediated by a variety of receptors, which are located in the skin and generate graded electrical potentials in response to mechanical stimuli (Abraira and Ginty, 2013, Grigg, 1986, Johansson and Flanagan, 2009). These electrical potentials are converted into spikes in peripheral nerve fibers, or primary afferent axons (Figure 1B; Lesniak et al., 2014). The primary afferent spikes are propagated into the central nervous system, where they are transferred via direct synapses on the output neurons of the cuneate nucleus (Abraira and Ginty, 2013, Jones, 2000). Here, the synaptic responses are translated into a spike output, which is propagated to the thalamus and to the neocortex, where it contributes to the generation of percepts of the skin-object interaction (Abraira and Ginty, 2013, Jones, 2000; Figure 1B). Because each primary afferent axon branches in the cuneate nucleus to give off multiple synapses (Weinberg et al., 1990), mechanical stimuli in a specific skin region (Figure 1B) may activate a large number of neurons in the cuneate nucleus. In addition, tactile afferents have overlapping innervation territories in the skin (Johansson and Vallbo, 1979), with each afferent having several mechanosensitive endings distributed within a local skin region (Iggo and Andres, 1982, Iggo and Ogawa, 1977, Paré et al., 2002). Hence, when a particular skin region is stimulated, a number of primary afferents innervating this region are activated and generate excitatory postsynaptic potentials (EPSPs) in all the cuneate cells that receive input from that same skin region. However, small differences in anatomical distribution of the mechanoreceptors in the skin (Lesniak et al., 2014) could potentially lead to differences in responsive properties within a population of primary afferents that innervate the same area of the skin. If such differences could be preserved or enhanced in the neurons of the cuneate nucleus and/or cortex, the information represented in the somatosensory system could potentially become richer than that provided solely by the localization of the receptive field or the submodality of the mechanoreceptors engaged and could for example make it possible to represent the theoretically predicted input features. To explore their possible representation in the brain, we recorded the responses of the neurons of the cuneate nucleus, the brain’s first level of processing for tactile perception, to the selective presentation of the individual input features.
Results
Recordings were made in nonanesthetized, decerebrated cats to allow the integration of afferent sensory information to be studied without descending cerebral inputs that would be expected to vary uncontrollably depending on the current state of the neocortex. All recorded neurons had receptive fields confined to one of the glabrous pads (digit 2, 3 or 4, in three cases on part of the central pad; Figure 1B). In addition, all neurons displayed a rapidly adapting response to maintained, local skin stretch (Figure S1 available online), but we could not determine whether this occurred because the neurons only received rapidly adapting sensor input or whether a local inhibitory mechanism cancelled out any possible slowly adapting sensor input. Once the location of the receptive field of the recorded neuron was established, we centered the haptic display on that location and repeatedly delivered the stimulus patterns described as slip, roll, contact on, and contact off (Figure 1A) at different specific speeds, referred to as stimulus conditions. Apart from these theoretically predicted input features, we also used a nonpatterned stimulus, termed “quadrant,” which stimulated selective skin regions (∼1 mm2) with a high-speed stretch that strongly activated the local mechanoreceptors. The quadrant stimulus could be delivered at nine different local skin regions (arranged three by three across the haptic interface) and was used to center the stimuli relative to the location of the receptive field of the recorded neuron. The quadrant stimulus was also used to verify that the stimulus conditions in the interface-skin contact were the same for all neurons (see below) using the responses to the central quadrant.
We started with an analysis of the postsynaptic potentials using whole-cell recordings in the current clamp mode (n = 5 neurons). To restrict our analysis to the synaptic inputs, we prevented the cuneate neurons from spiking using a mild hyperpolarizing current (Figure 2A). The synaptic responses to a few different stimulus conditions are illustrated by superimposed raw responses from two sample neurons (Figure 2B). We first compared the synaptic responses of the individual neuron to different stimulus conditions (n = 7 responses per neuron and stimulus condition). The statistical analysis was designed as follows. We first divided the initial 30 ms of the response to each stimulus condition into 1 ms bins. The responses to each stimulus condition were then compared bin by bin. The average number of bins that were statistically different in each comparison was 77% ± 16% (n = 19 comparisons in the five neurons using the Wilcoxon signed-rank test). This result indicates that the synaptic responses to different stimulus conditions were highly distinguishable within each neuron. We also compared the responses evoked under the same stimulus conditions in different neurons. In this case, the average number of bins that were statistically different in each comparison was 73% ± 19% (n = 12 comparisons), indicating that the synaptic responses to the same stimulus condition were readily distinguishable between cuneate neurons.
Figure 2.

Analysis of Evoked Synaptic Responses in Whole-Cell Recordings
(A) Sample long trace of a whole-cell recording with a brief stimulation (quadrant). Note the exceptional signal-to-noise ratio of the synaptic response, which is due to the very low spontaneous activity in most of the primary afferent axons and their very large unitary excitatory synaptic potentials (Bengtsson et al., 2013).
(B) Whole-cell recordings of synaptic responses in two sample cuneate neurons, organized in rows. For each cell, the responses to five repetitions of the same stimulus condition are superimposed in each subpanel. Three different stimulus conditions are shown for each cell (contact on 100 mm/s, slip 80 mm/s, and roll 20 mm/s). In the rightmost panel at top, an evoked spike is included in the illustration to demonstrate the quality of the recording.
(C) Relationship between synaptic responses and spike responses in a sample neuron for the quadrant stimulus condition. Note the highly consistent nature of the synaptic responses (top) and the somewhat less-consistent spike responses (middle five traces; the spikes were recorded in extracellular mode, before the whole-cell recording was obtained). However, by using a large number of repetitions (n = 50), the peristimulus histograms of the spike responses describe an average response, which has a temporal topography and graded intensity that is comparable to the synaptic response (bottom; the average trace of the intracellular signal is shown in red).
Using repeated stimulation, the spike output histogram of the cuneate neuron closely approximated the synaptic inputs (Figure 2C). Extracellular unitary spike recordings have the advantage that they are easier to maintain for a long time and hence allow a higher number of stimulus conditions to be delivered with a high number of repetitions. Therefore, to extend the findings from the analysis of the synaptic responses above, we made extracellular spike recordings from n = 18 neurons, each lasting for about 1 hr and allowing all stimulus conditions (n = 18) to be repeated 50 times each. The peristimulus histograms suggested that the neurons responded very differently to the set of applied stimulus conditions. The neuronal preference for certain stimulation patterns was evident, as illustrated for slip and roll (Figure 3). In addition, if two neurons responded to the same stimulation pattern, they often displayed different response patterns as illustrated in the histograms for the contact on stimulus (Figure 3). In contrast, during the rising phase of the faster, nonpatterned stimulation quadrant (Figure 3; the rising phase lasted 5.0 ms) the spike-firing probability across all neurons was highly consistent (1.00 ± 0.06 spikes; n = 18 neurons). This latter observation led to the conclusion that it is unlikely that the differences in response patterns were due to differences in the efficacy of activation of the skin sensors (Hayward et al., 2014).
Figure 3.
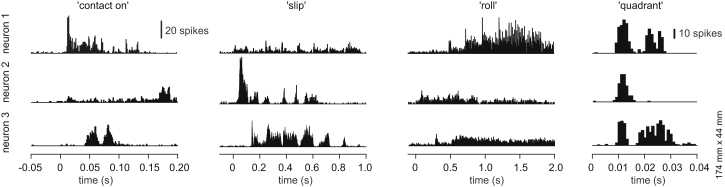
Specific Response Patterns and Preferred Stimuli for Spike Responses in Cuneate Neurons
Example responses, illustrated in peristimulus histograms, of three different cuneate neurons, organized in rows, to four different stimulus conditions, organized in columns. Each peristimulus histogram represents the summed activity of 50 repetitions of the indicated stimulus. The stimulus velocities were 10 mm/s for slip, 5 mm/s for roll, and 20 mm/s for contact on. Quadrant stimulation was used at one speed only.
Our first quantified comparison of the responses of the cuneate neurons was based on their response amplitudes, i.e., the total number of evoked spikes, to the different stimulation patterns. In this respect, the neurons formed complementary distributions (Figure 4A; data from three sample neurons). Hence, it was possible to segregate the neurons to some degree solely from the crude information given by the total number of spikes in the responses. For each stimulus type, the higher speeds tended to generate responses with more spikes, but the variability within the population was large (Figure 4B).
Figure 4.

Response Magnitudes
(A) Response amplitudes for three sample neurons to each of the tested stimulus conditions illustrated in a star plot. The plot illustrates the total number of spikes evoked for each stimulus condition. The set of vectors of each neuron are indicated by a specific color. The type of the stimulus condition and the speed with which it moved across the receptive field (in mm/s) are also indicated. Each type of stimulus condition is indicated by the same color code as in Figure 1A, for comparison with (D).
(B) The average (black line) and SD (gray shaded area) of the response amplitudes to the different stimulus conditions for the population of neurons.
(C) Relationship between the length of the analysis time and the rate of success of a linear classifier operating on the spike-response vectors illustrated in (D). The curves correspond to the average classification results for the entire set of neurons (n = 18) and for random subsets of neurons.
(D) Plots of the vector-based analysis of the spike responses per time bin. Each vector was defined by the number of spikes of each of our 18 neurons within the specified time bins; longer times of analysis indicate that a greater number of time bins were included and hence a higher dimensionality of the vectors calculated for each response. The 2D unfolding of this high-dimensional data cloud shows points corresponding to these spike-count vectors built by taking the j-th trial from every neuron. Each stimulus condition was illustrated using the same color code as in (A). The size of the dots indicates the speed of the stimulus (in mm/s, according to the key). At 15 ms, the classifier was able to roughly segregate stimulus families but the individual speeds were scrambled. At 30 ms, the speeds began to be clearly discriminated. At 150 ms, segregation was perfect, even for the least informative roll stimulus family.
For more detailed analysis, we constructed a classifier that counted the spikes evoked in cumulative time bins. The approach was motivated by the fact that the neocortex would be expected to receive information from a large number of cuneate neurons under each given stimulus condition. But whereas the spike times may not be preserved by millisecond precision all the way to the neocortex, the approximate spike density per time bin (as we defined them) is more likely to be preserved. Hence, for each time bin, the number of spikes for each neuron, each stimulus condition, and each repetition of that stimulus condition provided the data to calculate a high-dimensional spike count vector (see Experimental Procedures for details). The analysis, performed on the full set of these spike-count vectors, reported to what extent the responses to individual presentations of a given stimulus condition could be segregated from (or correctly classified) the responses obtained to the individual presentations of other stimulus conditions. The overall performance of the classifier increased steadily over time (Figure 4C), approaching 100% accuracy for a 150 ms observation window. However, the classification rate was high already after 30 ms of observation time (Figure 4C). The high performance of the classification could be further assessed by computing the distribution of the high-dimensional spike-count vectors in a 2D unfolding (Figure 4D). Spike-count vectors corresponding to the same stimulus and velocity tended to cluster, and the partitioning between stimulus types became more pronounced as the observation time increased (Figure 4D). The strong segregation was surprising because we sampled only a small proportion of the total number of cuneate neurons activated from the same skin area. For larger populations of neurons, the time needed to segregate the input features could be expected to be smaller. Alternatively, a larger number of neurons could segregate a much larger set of stimulus conditions than we tested. As is further analyzed below, both cases apply.
We also analyzed the specific time courses of the spike output. A quantification of the difference in the temporal response profiles of two neurons could be obtained by comparing the probability distributions of their spike times using the Kolmogorov-Smirnov (KS) statistical test. The results of this comparisons for n = 120 pairs of neurons and all stimulus conditions (n = 18) indicated that the patterns were statistically different from each other in almost all cases (Figures 5A, KS test, p < 0.05, and S2). The rare cases of absence of statistical significance were observed in the case of high-speed stimulation, where response saturation could explain the lower degree of segregation (Figure S3).
Figure 5.

Diversity of Response Patterns
(A) Statistical results for pairwise comparisons of neuronal response patterns for all stimulus conditions. The black squares mark the cases where two compared neurons had indistinguishable distributions of their spike times (KS test; alpha = 0.05). In all other cases, the response patterns were significantly different. Two out of the 18 neurons were excluded from this figure because they had nearly zero response to some stimuli, which prevented a reliable statistical estimation of their spike-response pattern.
(B) Graph showing the distribution of the response patterns of all 18 neurons in the 17-dimensional space defined by the dissimilarity matrix obtained using Jenson-Shannon divergence (see text). The graph represents the embedding of the neuronal responses into an arbitrary 3D space so as to optimally preserve the pairwise distances within the 17-dimensional space. A rotating version of this graph is presented in Movie S1.
(C) Dimensionality analysis of the tactile inputs. The graph illustrates the diversity of the temporal response patterns in n = 18 neurons by the evolution of the amount of variance between the response patterns of the neurons as a function of the number of dimensions considered. The upper curve represents the result of a principal component analysis and reports the accumulated variance explained for each added dimension. The contribution of individual dimensions is shown by the lower line.
The KS test provided a binary measure of the differences in the temporal response profiles between the neurons. A graded measure of the heterogeneity of the responses was obtained from the Jensen-Shannon (JS) divergence. Using this method, we obtained metric measures of the pairwise differences between the neurons, and these differences could be used to place each neuron in a 17-dimensional space (i.e., one dimension per neuron −1) using multidimensional scaling. This space was illustrated by an optimal difference-preserving embedding of each neuron in an arbitrary 3D space (Figure 5B; Movie S1). We further applied principal-component analysis to find the number of dimensions required to account for the variability of the “response locations” of the neurons in the full 17-dimensional space, i.e., the lowest number of dimensions that would preserve the distribution of the neurons within this space. The threshold value of 90% was attained using 12 dimensions (Figure 5C). This value would set a lower limit on the number of input dimensions in the tactile somatosensory system. Hence, these results suggest that there were more input dimensions in the system than the number of stimulus types that we used (also supported by the very few similarities in the KS tests in Figure 5A). This could be explained by the fact that, in addition to the proposed fundamental input features for skin-object interactions, intermediate states are known to exist (Terekhov and Hayward, 2011).The additional input dimensions detected were probably activated as unique vector components for each combination of stimulus type and neuron.
Discussion
Our findings indicate that a number of previously unrecognized haptic input features (Hayward, 2011) are well represented among the neurons of the cuneate nucleus, which hence can provide the neocortex with a high-dimensional representation of haptic events. Notably, each cuneate neuron had a unique set of responses to the inputs delivered, suggesting that each neuron carried a specific combination of these input features, in a manner that is similar to the “mixed selectivity” of task-related information in neurons of the prefrontal cortex (Rigotti et al., 2013). Our findings may have implications for how we view the organization of somatosensory processing in the brain. The currently prevailing idea is that the submodalities of skin input are segregated all the way up to area S1 of the neocortex. However, all of our neurons had rapidly adapting responses to touch, yet they displayed widely different responses to our stimulus conditions. This finding suggests that the information represented in the somatosensory system can be more complex than what can be estimated from submodalities and receptive fields alone. Although it remains to be shown, it is possible that the apparent but irregular submodality organization of the S1 neocortex (Friedman et al., 2004, Mountcastle, 1997, Sur et al., 1984) is an epiphenomenon of a more-detailed, input-feature-based organization.
Primary sensory afferents of the same submodality can have different response properties, depending on small differences in receptive field location or distribution (Jenmalm et al., 2003, Lesniak et al., 2014). The explanation for the differential primary sensory encoding could lie in the local anatomy and the mechanical properties it confers. The glabrous skin has complex biomechanical properties, such as ridge-induced anisotropy, multiple viscoelastic time constants (Wang and Hayward, 2007), and a striking organization of subcutaneous connective tissues (Hauck et al., 2004) that can manifest itself by causing receptors to respond even though they are located far away from the locus of surface stimulation (Bisley et al., 2000, Vallbo and Johansson, 1984). Mechanical effects beyond the basic contact mechanics of elastic media induced in the tissues where a skin receptor of a given submodality is embedded could therefore shape the activation of the mechanoreceptor according to the characteristics of spatiotemporal stimuli. Similarly, preneuronal processing mechanisms have been suggested also in the rat whisker system (Bagdasarian et al., 2013). Taking these considerations into account, components of the input features are likely to be present already in the population of primary sensory afferents.
A primary function of the cuneate nucleus may then be to recombine correlated primary afferent inputs (Johansson and Flanagan, 2009) in order to segregate and represent the input features more distinctly. The acquisition of specific afferent combinations in the cuneate neurons could be realized by weight reinforcement of the primary afferent synapses that have highly correlated spiking, possibly via conventional correlation-based synaptic plasticity (Malenka and Bear, 2004). The possible presence of a learning process in the cuneate neurons, by which only a few correlated primary afferent synapses are given a high synaptic weight, is consistent with recent findings regarding their synaptic integration (Bengtsson et al., 2013). Selection of correlated inputs to the single cuneate neuron would tend to lead to decorrelated activity in the population of the cuneate neurons, thereby increasing their information content (Averbeck et al., 2006). The local inhibitory interneurons of the cuneate nucleus (not represented in Figure 1B) could play an additional role in decorrelating the efferent activity of the projection neurons (Figure 1B) and hence assist the segregation of certain combinations of primary sensory afferent inputs. At least in the neocortex, decorrelating afferent synaptic inputs is believed to be an important function of the local inhibitory interneurons in the processing of sensory information (Renart et al., 2010). The cuneate neurons may receive an additional input from the spinal postsynaptic dorsal column neurons, which also receive tactile primary afferent synapses and send processed information to the cuneate nucleus (Abraira and Ginty, 2013, Dick et al., 2001). This system could also account for some of the tuning specificity we found in these neurons.
In conclusion, our findings suggest that the process of decorrelating sensory input originating from skin-object interactions has started well in advance of the cortical stage, with the consequence that the amount of information represented in the population of receiving neurons would be maximized (Averbeck et al., 2006). An early segregation of tactile inputs may ultimately facilitate the formation of distinct conscious percepts of specific aspects of tactile information, such as shape or slip velocity, and participate in the subcortical pathways engaged in shaping behavior, such as gripping, in the face of the enormous complexity of tactile mechanics (Adams et al., 2013, Hayward, 2011). Hence, by issuing decorrelated, input-feature-segregated information, the cuneate neurons supply the somatosensory neocortex with the richest possible information about the complex biomechanical events that underlie the process of haptic perception.
Experimental Procedures
Preparation
All animal experiments were approved in advance by the Malmö/Lund Animal Research Ethics Committee (permit number and approval ID: M05-12).
All experiments were made in vivo, in adult, decerebrated cats of either sex. Similar to humans and monkeys, the cat has glabrous skin on the tip of the five digits as well as on the central foot pad (Figure 1B). This glabrous tissue has the same set of sensors as the primate glabrous skin (Iggo and Andres, 1982, Iggo and Ogawa, 1977). Recordings from the cuneate nucleus in this particular preparation allowed long-term recordings from these neurons. Long-term recordings were required to obtain data on the neuronal responses to the full set of stimulus patterns. The preparation also allowed these recordings to be carried out under nonanesthetized conditions. Hence, the primary afferent convergence and intracuneate circuitry processing could be studied in isolation, unperturbed by any descending signals from the neocortex or by any degrading influences on the neuronal network from anesthetics.
Adult cats were prepared as previously described (Bengtsson et al., 2013, Jörntell and Ekerot, 2002). After initial anesthesia with propofol (Diprivan; Zeneca), the animals were decerebrated at the intercollicular level and the anesthesia was discontinued. The animals were artificially ventilated, and the end-expiratory CO2, the blood pressure, and the rectal temperature were monitored and maintained within physiological limits. Mounting in a stereotaxic frame, drainage of cerebrospinal fluid, pneumothorax, and clamping of the spinal processes of a few cervical and lumbar vertebral bodies served to increase the mechanical stability of the preparation.
Recordings and Stimulation
In vivo patch clamp recordings were made from neurons of the cuneate nucleus (n = 23) with patch pipettes pulled to 6–14 MOhm (potassium-gluconate-based internal solution). The general procedures for whole-cell recordings in this preparation have been described previously (Bengtsson et al., 2013). To obtain cuneate neuron recordings, we exposed the dorsal part of the lower brainstem by removing muscles overlying the junction between the skull and the first cervical vertebra. Parts of the caudal skull bone and the rostral C1 vertebra were also removed to improve access to the neural tissue. To improve stability, the exposed neural tissue was covered with agarose (2% in saline solution). Viewed through a stereomicroscope, the anatomical location of the cuneate nucleus is readily visible from the surface, with the landmarks of the obex and the groove between the cuneate nucleus and the spinal trigeminal nucleus being particularly helpful. The electrodes were inserted into the dorsal part of the nucleus. All our recorded neurons had receptive fields on the glabrous pads and, as determined qualitatively, rapidly adapting responses to touch (Johansson and Flanagan, 2009; see also Figure S1). Once a recording from such a neuron was obtained, the paw was mounted on the stimulation device (see description below). The present study includes only cuneate neurons that exhibited spontaneous burst-firing patterns with intraburst-firing frequencies higher than 600 Hz. Such spike-firing patterns are typical for cuneate projection neurons (Canedo and Aguilar, 2000). Qualitatively, all neurons had rapidly adapting responses to touch (Johansson and Flanagan, 2009).
Whole-cell recordings can provide high-quality intracellular signals in which individual synaptic responses can be analyzed with high signal-to-noise ratio. Such whole-cell recordings with sufficient duration to allow for a minimum number of repetitions (n = 7) of at least a couple of the spatiotemporal stimuli applied by the haptic interface device were obtained from five neurons. To analyze the EPSP responses induced by specific stimuli applied by the haptic interface device, we hyperpolarized the recorded neurons to prevent spiking. This was done by applying 50–150 pA of negative bias current, which lowered the membrane potential of the recorded cell from −52 mV to about −67 mV. In contrast, for the extracellular recordings of spike responses, obtained without any applied bias current, each stimulus condition was repeated 50 times. Spikes were separated from background noise by having a peak amplitude that exceeded the peak noise amplitude by at least five times. The spikes were identified as neuronal spikes of the same unit by defining a number of principal components. Clustering of these principal components was taken as an indication that the signal was generated by one and the same unit. This was further supported by the fact that their average spontaneous firing rate was similar to that previously reported for cuneate neurons in this preparation.
The skin of one of the glabrous pads was stimulated by a novel haptic interface operating on the basis of differential lateral tractions (Hayward et al., 2014, Wang and Hayward, 2010; Tactile Labs). This mechanical principle minimizes tactile stimulation uncertainty owing to the effects of nonlocal, viscoelastic skin mechanics. Differential traction makes it possible to locally stimulate small skin regions. The superposition of localized stimuli enables the synthesis of finely defined spatiotemporal stimuli that can be demonstrated to activate identical subpopulations of mechanoreceptors through multiple repetitions of the same stimulus (Hayward et al., 2014). The slip stimulus was synthesized by forming a highly localized region of strain and programming it to move through space. The roll stimulus was similar in structure but had a wide region of strained tissue. The contact on stimulus was characterized by a growing region of strained tissue. Reversing the process corresponded to the contact off stimulus. The quadrant stimulus corresponded to a strong activation of a small cluster of stimulated sites fixed in space. These patterns are symbolized in Figure 1A, fully described in Hayward et al. (2014), and theoretically justified in Wang and Hayward (2008).
All values are reported as mean ± SD unless otherwise stated.
Analysis
Synaptic Potentials in Whole-Cell Recordings
The cuneate cells were hyperpolarized to prevent spiking so that the raw synaptic responses could be compared (Figure 2B). Each stimulus type was repeated (n = 7), and responses were compared using the Wilcoxon signed-rank test. The responses to the stimulus with the shortest duration (quadrant) lasted only for 30 ms, so our quantitative analysis was limited to the first 30 ms of the evoked responses. The 30 ms interval was subdivided into 30 bins of 1.0 ms each, and the responses were compared bin by bin. All membrane potentials were aligned with respect to the preresponse baseline activity before the comparison.
Spike Response Histograms
A trigger pulse indicated the onset of stimulation through the haptic interface. For repeated delivery of the same stimulus condition, the resulting peristimulus histograms were made using the trigger pulse as time zero and counting the spike responses at each time point (bin) around it (Figure 3).
Average Firing Rate
For every neuron, the average firing rates were computed for each velocity condition of contact on, contact off, slip, and roll stimuli, which resulted in 18 values per neuron on total. All spikes that occurred during the stimulus condition were included. The plot in Figure 4A presents responses of three representative neurons. For the sake of presentation, their firing rates were normalized by the maximal response of each neuron across all conditions. The plot in Figure 4B illustrates the group average and SD.
Classification
The response classification based on the number of spikes response was performed for ten different observation intervals: 15, 20, 25, 30, 40, 50, 75, 100, 125, and 150 ms beginning from the stimulus onset. Each observation interval was divided into nonoverlapping time bins with boundaries at 5, 10, 15, 20, 30, 50, 100, and 150 ms. When the observation interval was shorter than 150 ms, only those bins falling in the interval were used; in this case, the upper limit of the last bin coincided with the interval duration. For every trial of every neuron, we counted the number of spikes falling in each time bin. The excess time bins were filled with zeroes whenever the observation time was longer than the duration of the stimulus. This operation produced a collection of high-dimensional spikes-count vectors , where stands for the neuron, stands for the stimulation condition, and k = 2,…,49 stands for the trial. The dimensionality of these vectors ranged from two to seven, depending on the duration of the observation interval. We used a simple linear classifier, implemented by the “classify” function of Matlab (R2011b). The classifier took as inputs the spikes-count vectors of all considered neurons. The input vector to the classifier for -th experimental condition was defined by taking one trial for each neuron and concatenating the corresponding spikes-count vectors,
where , …, are the selected trials. Depending on the length of the observation interval, the dimensionality of ranged from 34 to 119.
At the learning phase for each stimulus condition, we produced 24 input vectors , using random trials for each neuron. These vectors were used for supervised learning of the stimulation classes. In the test phase, we produced 1,000 vectors by concatenating randomly the trials that were not used at the learning phase. The accuracy of the classification for each condition was characterized by the percentage of correctly classified vectors from the test data. The entire learning-testing procedure was repeated 100 times, and the average and SD of the classification accuracy were computed. These values for different observation time windows are presented in Figure 4C.
The overall routine was applied to the entire set of n = 18 neurons as well as to its random subsets with cardinality 12, 6, and 3. The subsets were chosen in such a way that the subsets of smaller cardinality were selected out of the elements included in the subsets of larger cardinality. For example, if a 12-elemental subset included neurons with numbers from 1 to 12, then the six-elemental subsets were also selected out of these neurons. The curves in Figure 4C present the average classification results obtained for two 12-element, five six-element, and six three-element subsets of neurons.
In order to illustrate the partitioning of responses of the cuneate neurons when all 18 neurons are used to produce spike-count vectors, we computed 48 vectors for every condition, concatenating the trials with the same numbers. For illustration purposes, these high-dimensional data were embedded into a plane using curvilinear component analysis space (Demartines and Herault, 1997), implemented in the “cca” function of SOM Toolbox 2.0 for Matlab (http://www.cis.hut.fi/somtoolbox/). Note that at no stage of the data processing was information about the properties of the stimulus condition used. The emergence of clusters is hence due to inherent properties of the data and not to the analysis involved.
Response Patterns
To substantiate the observation that responses of two compared neurons had different temporal “topography” to the same stimulus, we employed the two-sample KS test. This test takes a pair of data samples as input and tests the null hypothesis that they are drawn from a same, yet unknown, distribution. The samples were obtained from the time-spike sequences of individual trials. The sequence for -th trial comprised the spike times, , measured from the stimulus onset, where is the time of the last spike in -th trial. The pair of samples was produced by pooling sequences from 48 trials (the first and the last trial were excluded) for the same neuron and the same stimulation condition. All possible pairs of 16 out of 18 neurons (120 pairs on total) were used in the analysis; the response in the two excluded neurons was too weak (less than ten spikes per trial), making the results of Kolmogorov-Smirnov test unreliable. The neurons were said to have different response topography if the KS test was below the level of 0.05. The cases when the results were insignificant are denoted with black squares in Figure 5A.
Dimensionality of the Neural Responses
The qualitative measure of dissimilarity of neuronal responses in all trials was assessed using JS divergence, a regularized version of Kullback-Leibler divergence. For every neuron and stimulation condition, a normalized histogram of spike times was computed with 2 ms bins. For two histograms, P and Q, the JS divergence is computed by the formula
where N is the number of bins in P and Q. The dissimilarity of two neurons was computed as a sum of JS divergences computed for every stimulation condition.
The dissimilarity matrix was calculated for n = 18 neurons, and a multidimensional scaling procedure was applied to embed the neurons in a 17-dimensional Euclidean space (the maximal number of dimensions that could be obtained for comparisons between the 18 neurons). Principal component analysis was performed on the resultant cloud of points, each of the points representing one of the neurons. The percentage of variance accounted by -th principal component and the cumulative variance accounted by first principal components are presented in Figure 5C. The dimensionality of the neuronal responses was estimated as the number of principal components necessary to account for 90% of variance. The relatively slow growth of the percentage of variance accounted by first principal components suggests rather uniform distribution of the data along all dimensions. For illustration, the cloud of points representing the neurons was embedded in the 3D space using curvilinear component analysis (see Classification above). The result is presented in Figure 5B and Movie S1.
Acknowledgments
This study was supported by the European Research Council (FP7) ERC Advanced Grant (PATCH) to V.H. (no. 247300), by a European Commission grant The Hand Embodied (THE, no. 248587) within the European FP7, and by the Swedish Medical Research Council.
Published: August 28, 2014
Footnotes
This is an open access article under the CC BY-NC-ND license (http://creativecommons.org/licenses/by-nc-nd/3.0/).
Supplemental Information includes three figures and one movie and can be found with this article online at http://dx.doi.org/10.1016/j.neuron.2014.07.038.
Supplemental Information
Note that the neurons remained well segregated, regardless of viewing angle.
References
- Abraira V.E., Ginty D.D. The sensory neurons of touch. Neuron. 2013;79:618–639. doi: 10.1016/j.neuron.2013.07.051. [DOI] [PMC free article] [PubMed] [Google Scholar]
- Adams M.J., Johnson S.A., Lefèvre P., Lévesque V., Hayward V., André T., Thonnard J.L. Finger pad friction and its role in grip and touch. J. R. Soc. Interface. 2013;10:20120467. doi: 10.1098/rsif.2012.0467. [DOI] [PMC free article] [PubMed] [Google Scholar]
- Anjum F., Turni H., Mulder P.G., van der Burg J., Brecht M. Tactile guidance of prey capture in Etruscan shrews. Proc. Natl. Acad. Sci. USA. 2006;103:16544–16549. doi: 10.1073/pnas.0605573103. [DOI] [PMC free article] [PubMed] [Google Scholar]
- Arabzadeh E., Zorzin E., Diamond M.E. Neuronal encoding of texture in the whisker sensory pathway. PLoS Biol. 2005;3:e17. doi: 10.1371/journal.pbio.0030017. [DOI] [PMC free article] [PubMed] [Google Scholar]
- Averbeck B.B., Latham P.E., Pouget A. Neural correlations, population coding and computation. Nat. Rev. Neurosci. 2006;7:358–366. doi: 10.1038/nrn1888. [DOI] [PubMed] [Google Scholar]
- Bagdasarian K., Szwed M., Knutsen P.M., Deutsch D., Derdikman D., Pietr M., Simony E., Ahissar E. Pre-neuronal morphological processing of object location by individual whiskers. Nat. Neurosci. 2013;16:622–631. doi: 10.1038/nn.3378. [DOI] [PubMed] [Google Scholar]
- Bengtsson F., Brasselet R., Johansson R.S., Arleo A., Jörntell H. Integration of sensory quanta in cuneate nucleus neurons in vivo. PLoS ONE. 2013;8:e56630. doi: 10.1371/journal.pone.0056630. [DOI] [PMC free article] [PubMed] [Google Scholar]
- Bisley J.W., Goodwin A.W., Wheat H.E. Slowly adapting type I afferents from the sides and end of the finger respond to stimuli on the center of the fingerpad. J. Neurophysiol. 2000;84:57–64. doi: 10.1152/jn.2000.84.1.57. [DOI] [PubMed] [Google Scholar]
- Boussinesq J. Gauthier-Villars; Paris: 1885. Application des potentiels à l’étude de l’équilibre et du mouvement des solides élastiques. [Google Scholar]
- Bushnell E.W., Boudreau J.P. Motor development and the mind: the potential role of motor abilities as a determinant of aspects of perceptual development. Child Dev. 1993;64:1005–1021. [PubMed] [Google Scholar]
- Canedo A., Aguilar J. Spatial and cortical influences exerted on cuneothalamic and thalamocortical neurons of the cat. Eur. J. Neurosci. 2000;12:2515–2533. doi: 10.1046/j.1460-9568.2000.00107.x. [DOI] [PubMed] [Google Scholar]
- Demartines P., Herault J. Curvilinear component analysis: a self-organizing neural network for nonlinear mapping of data sets. IEEE Trans. Neural Netw. 1997;8:148–154. doi: 10.1109/72.554199. [DOI] [PubMed] [Google Scholar]
- Diamond M.E., von Heimendahl M., Knutsen P.M., Kleinfeld D., Ahissar E. ‘Where’ and ‘what’ in the whisker sensorimotor system. Nat. Rev. Neurosci. 2008;9:601–612. doi: 10.1038/nrn2411. [DOI] [PubMed] [Google Scholar]
- Dick S.H., French A.S., Rasmusson D.D. Postsynaptic dorsal column and cuneate neurons in raccoon: comparison of response properties and cross-correlation analysis. Brain Res. 2001;914:134–148. doi: 10.1016/s0006-8993(01)02787-1. [DOI] [PubMed] [Google Scholar]
- Ego-Stengel V., Le Cam J., Shulz D.E. Coding of apparent motion in the thalamic nucleus of the rat vibrissal somatosensory system. J. Neurosci. 2012;32:3339–3351. doi: 10.1523/JNEUROSCI.3890-11.2012. [DOI] [PMC free article] [PubMed] [Google Scholar]
- Felsen G., Touryan J., Han F., Dan Y. Cortical sensitivity to visual features in natural scenes. PLoS Biol. 2005;3:e342. doi: 10.1371/journal.pbio.0030342. [DOI] [PMC free article] [PubMed] [Google Scholar]
- Forssberg H., Eliasson A.C., Kinoshita H., Westling G., Johansson R.S. Development of human precision grip. IV. Tactile adaptation of isometric finger forces to the frictional condition. Exp. Brain Res. 1995;104:323–330. doi: 10.1007/BF00242017. [DOI] [PubMed] [Google Scholar]
- Friedman R.M., Chen L.M., Roe A.W. Modality maps within primate somatosensory cortex. Proc. Natl. Acad. Sci. USA. 2004;101:12724–12729. doi: 10.1073/pnas.0404884101. [DOI] [PMC free article] [PubMed] [Google Scholar]
- Gilbert C.D., Wiesel T.N. Functional organization of the visual cortex. Prog. Brain Res. 1983;58:209–218. doi: 10.1016/S0079-6123(08)60022-9. [DOI] [PubMed] [Google Scholar]
- Goodwin A.W., Macefield V.G., Bisley J.W. Encoding of object curvature by tactile afferents from human fingers. J. Neurophysiol. 1997;78:2881–2888. doi: 10.1152/jn.1997.78.6.2881. [DOI] [PubMed] [Google Scholar]
- Grigg P. Biophysical studies of mechanoreceptors. J. Appl. Physiol. 1986;60:1107–1115. doi: 10.1152/jappl.1986.60.4.1107. [DOI] [PubMed] [Google Scholar]
- Hauck R.M., Camp L., Ehrlich H.P., Saggers G.C., Banducci D.R., Graham W.P. Pulp nonfiction: microscopic anatomy of the digital pulp space. Plast. Reconstr. Surg. 2004;113:536–539. doi: 10.1097/01.PRS.0000101053.03572.26. [DOI] [PubMed] [Google Scholar]
- Hayward V. Is there a ‘plenhaptic’ function? Philos. Trans. R. Soc. Lond. B Biol. Sci. 2011;366:3115–3122. doi: 10.1098/rstb.2011.0150. [DOI] [PMC free article] [PubMed] [Google Scholar]
- Hayward V., Terekhov A.V., Wong S.C., Geborek P., Bengtsson F., Jörntell H. Spatio-temporal skin strain distributions evoke low variability spike responses in cuneate neurons. J. R. Soc. Interface. 2014;11:20131015. doi: 10.1098/rsif.2013.1015. [DOI] [PMC free article] [PubMed] [Google Scholar]
- Huntley G.W. Differential effects of abnormal tactile experience on shaping representation patterns in developing and adult motor cortex. J. Neurosci. 1997;17:9220–9232. doi: 10.1523/JNEUROSCI.17-23-09220.1997. [DOI] [PMC free article] [PubMed] [Google Scholar]
- Iggo A., Ogawa H. Correlative physiological and morphological studies of rapidly adapting mechanoreceptors in cat’s glabrous skin. J. Physiol. 1977;266:275–296. doi: 10.1113/jphysiol.1977.sp011768. [DOI] [PMC free article] [PubMed] [Google Scholar]
- Iggo A., Andres K.H. Morphology of cutaneous receptors. Annu. Rev. Neurosci. 1982;5:1–31. doi: 10.1146/annurev.ne.05.030182.000245. [DOI] [PubMed] [Google Scholar]
- Jenmalm P., Birznieks I., Goodwin A.W., Johansson R.S. Influence of object shape on responses of human tactile afferents under conditions characteristic of manipulation. Eur. J. Neurosci. 2003;18:164–176. doi: 10.1046/j.1460-9568.2003.02721.x. [DOI] [PubMed] [Google Scholar]
- Johansson R.S., Vallbo A.B. Tactile sensibility in the human hand: relative and absolute densities of four types of mechanoreceptive units in glabrous skin. J. Physiol. 1979;286:283–300. doi: 10.1113/jphysiol.1979.sp012619. [DOI] [PMC free article] [PubMed] [Google Scholar]
- Johansson R.S., Flanagan J.R. Coding and use of tactile signals from the fingertips in object manipulation tasks. Nat. Rev. Neurosci. 2009;10:345–359. doi: 10.1038/nrn2621. [DOI] [PubMed] [Google Scholar]
- Johnson K.L. Cambridge University Press; Cambridge: 1985. Contact Mechanics. [Google Scholar]
- Jones E.G. Cortical and subcortical contributions to activity-dependent plasticity in primate somatosensory cortex. Annu. Rev. Neurosci. 2000;23:1–37. doi: 10.1146/annurev.neuro.23.1.1. [DOI] [PubMed] [Google Scholar]
- Jörntell H., Ekerot C.F. Reciprocal bidirectional plasticity of parallel fiber receptive fields in cerebellar Purkinje cells and their afferent interneurons. Neuron. 2002;34:797–806. doi: 10.1016/s0896-6273(02)00713-4. [DOI] [PubMed] [Google Scholar]
- Kandel E.R., Schwarz J.H. Second Edition. Elsevier; New York, Amsterdam, Oxford: 1985. Principles of Neural Science. [Google Scholar]
- Lesniak D.R., Marshall K.L., Wellnitz S.A., Jenkins B.A., Baba Y., Rasband M.N., Gerling G.J., Lumpkin E.A. Computation identifies structural features that govern neuronal firing properties in slowly adapting touch receptors. Elife (Cambridge) 2014;3:e01488. doi: 10.7554/eLife.01488. [DOI] [PMC free article] [PubMed] [Google Scholar]
- Malenka R.C., Bear M.F. LTP and LTD: an embarrassment of riches. Neuron. 2004;44:5–21. doi: 10.1016/j.neuron.2004.09.012. [DOI] [PubMed] [Google Scholar]
- Minnery B.S., Simons D.J. Response properties of whisker-associated trigeminothalamic neurons in rat nucleus principalis. J. Neurophysiol. 2003;89:40–56. doi: 10.1152/jn.00272.2002. [DOI] [PubMed] [Google Scholar]
- Mountcastle V.B. The columnar organization of the neocortex. Brain. 1997;120:701–722. doi: 10.1093/brain/120.4.701. [DOI] [PubMed] [Google Scholar]
- Paré M., Smith A.M., Rice F.L. Distribution and terminal arborizations of cutaneous mechanoreceptors in the glabrous finger pads of the monkey. J. Comp. Neurol. 2002;445:347–359. doi: 10.1002/cne.10196. [DOI] [PubMed] [Google Scholar]
- Renart A., de la Rocha J., Bartho P., Hollender L., Parga N., Reyes A., Harris K.D. The asynchronous state in cortical circuits. Science. 2010;327:587–590. doi: 10.1126/science.1179850. [DOI] [PMC free article] [PubMed] [Google Scholar]
- Rigotti M., Barak O., Warden M.R., Wang X.J., Daw N.D., Miller E.K., Fusi S. The importance of mixed selectivity in complex cognitive tasks. Nature. 2013;497:585–590. doi: 10.1038/nature12160. [DOI] [PMC free article] [PubMed] [Google Scholar]
- Sur M., Wall J.T., Kaas J.H. Modular distribution of neurons with slowly adapting and rapidly adapting responses in area 3b of somatosensory cortex in monkeys. J. Neurophysiol. 1984;51:724–744. doi: 10.1152/jn.1984.51.4.724. [DOI] [PubMed] [Google Scholar]
- Szwed M., Bagdasarian K., Ahissar E. Encoding of vibrissal active touch. Neuron. 2003;40:621–630. doi: 10.1016/s0896-6273(03)00671-8. [DOI] [PubMed] [Google Scholar]
- Tabor D. The mechanism of rolling friction. II. The elastic range. Proc. R. Soc. Lond. A Math. Phys. Sci. 1955;229:198–220. [Google Scholar]
- Terekhov A.V., Hayward V. Minimal adhesion surface area in tangentially loaded digital contacts. J. Biomech. 2011;44:2508–2510. doi: 10.1016/j.jbiomech.2011.07.007. [DOI] [PubMed] [Google Scholar]
- Vallbo A.B., Johansson R.S. Properties of cutaneous mechanoreceptors in the human hand related to touch sensation. Hum. Neurobiol. 1984;3:3–14. [PubMed] [Google Scholar]
- Wang Q., Hayward V. In vivo biomechanics of the fingerpad skin under local tangential traction. J. Biomech. 2007;40:851–860. doi: 10.1016/j.jbiomech.2006.03.004. [DOI] [PubMed] [Google Scholar]
- Wang Q., Hayward V. Tactile synthesis and perceptual inverse problems seen from the viewpoint of contact mechanics. ACM Trans. Appl. Percept. 2008;5:1–19. [Google Scholar]
- Wang Q., Hayward V. Biomechanically optimized distributed tactile transducer based on lateral skin deformation. Int. J. Robot. Res. 2010;29:323–335. [Google Scholar]
- Weinberg R.J., Pierce J.P., Rustioni A. Single fiber studies of ascending input to the cuneate nucleus of cats: I. Morphometry of primary afferent fibers. J. Comp. Neurol. 1990;300:113–133. doi: 10.1002/cne.903000108. [DOI] [PubMed] [Google Scholar]
- Zachariah M.K., Coleman G.T., Mahns D.A., Zhang H.Q., Rowe M.J. Transmission security for single, hair follicle-related tactile afferent fibers and their target cuneate neurons in cat. J. Neurophysiol. 2001;86:900–911. doi: 10.1152/jn.2001.86.2.900. [DOI] [PubMed] [Google Scholar]
Associated Data
This section collects any data citations, data availability statements, or supplementary materials included in this article.
Supplementary Materials
Note that the neurons remained well segregated, regardless of viewing angle.