

Background: Pannexin-1 channels mediate ATP efflux and are substrates for apoptotic caspases.
Results: Chemotherapeutic drugs induce ATP release via caspase-dependent gating of pannexin-1 channels and a caspase/pannexin-1-independent mechanism in leukemic lymphocytes.
Conclusion: Pannexin-1 channels that release intracellular metabolites are a novel element of cancer chemotherapy.
Significance: Pannexin-1 channels link tumor cell apoptosis to purinergic regulation of anti-tumor immunity.
Keywords: Apoptosis, ATP, Caspase, Pannexin, Purinergic Agonist
Abstract
Anti-tumor immune responses have been linked to the regulated release of ATP from apoptotic cancer cells to engage P2 purinergic receptor signaling cascades in nearby leukocytes. We used the Jurkat T cell acute lymphocytic leukemia model to characterize the role of pannexin-1 (Panx1) channels in the release of nucleotides during chemotherapeutic drug-induced apoptosis. Diverse pro-apoptotic drugs, including topoisomerase II inhibitors, kinase inhibitors, and proteosome inhibitors, induced functional activation of Panx1 channels via caspase-3-mediated cleavage of the Panx1 autoinhibitory C-terminal domain. The caspase-activated Panx1 channels mediated efflux of ATP, but also ADP and AMP, with the latter two comprising >90% of the released adenine nucleotide pool as cells transitioned from the early to late stages of apoptosis. Chemotherapeutic drugs also activated an alternative caspase- and Panx1-independent pathway for ATP release from Jurkat cells in the presence of benzyloxycarbonyl-VAD, a pan-caspase inhibitor. Comparison of Panx1 levels indicated much higher expression in leukemic T lymphocytes than in normal, untransformed T lymphoblasts. This suggests that signaling roles for Panx1 may be amplified in leukemic leukocytes. Together, these results identify chemotherapy-activated pannexin-1 channels and ATP release as possible mediators of paracrine interaction between dying tumor cells and the effector leukocytes that mediate immunogenic anti-tumor responses.
Introduction
Immune responses to cancer play significant roles in suppressing or eliminating tumor cells that survive direct killing by chemotherapeutic agents or radiation. Anti-tumor immune responses have been linked in part to the regulated release of ATP from apoptotic tumor cells with consequent engagement of P2 purinergic receptor signaling cascades in tumor-infiltrating leukocytes (1–3). Tumor cell-derived extracellular ATP stimulates G protein-coupled P2Y2 receptors on dendritic cells and macrophages to amplify the recognition and phagocytosis of apoptotic cancer cells (4–6). ATP within the tumor microenvironment additionally stimulates ionotropic P2X7 receptors on dendritic cells/macrophages to elicit caspase-1 inflammasome assembly and IL-1β secretion (1). The ATP-dependent release of IL-1β from dendritic cells during presentation of tumor antigen to CD8+ T cells enhances differentiation of the latter into tumor-reactive effectors that can directly kill cancer cells or facilitate recruitment of natural killer cells. ATP can be released from normal or tumor cells via exocytosis of ATP-containing vesicles or granules, selective efflux via plasma membrane channels, or nonselective disruption of plasma membrane integrity by mechanical stress or cytolytic mediators (7, 8). Two mechanistically distinct pathways of ATP release, one channel-mediated and the other involving exocytosis, have been characterized in different tumor cell models during apoptosis induced by death receptors, radiation, or chemotherapeutic drugs.
Ravichandran and co-workers (9, 10) identified a central role for plasma membrane pannexin-1 channels in facilitating ATP export from apoptotic Jurkat human leukemic T cells or normal murine thymocytes. Pannexin-1 (Panx1) exhibits similar topology, but not sequence homology, to the larger family of connexin membrane proteins that form gap junction channels (11). Each Panx1 protein subunit contains 426 amino acids organized in four transmembrane segments, intracellular N and C termini and two extracellular loops. Six Panx1 subunits co-assemble into stable hexameric channels during synthesis in the endoplasmic reticulum/Golgi network and trafficking to the plasma membrane. In the basal state, Panx1 channels are defined by very low open probability and conductance (10, 12–16). Increased Panx1 channel activity in the plasma membrane of nonapoptotic cells can be rapidly (within seconds to minutes) induced by mechanical stresses, stimulation of some G protein-coupled receptors, or strong depolarization of the membrane potential to >0 mV (17). Notably, the intracellular C-terminal tail of Panx1 contains a consensus site (376Asp-Val-Val-Asp in human Panx1 and 376Asp-Ile-Ile-Asp in murine Panx1) for proteolytic cleavage by caspase-3 (10, 11, 13, 14). Cleavage at Asp-379 removes a 46-amino acid C-terminal segment that otherwise acts as an autoinhibitory blocker of the conducting pore formed by the Panx1 hexameric complex. Thus, accumulation of active caspase-3 during apoptosis can result in essentially irreversible open-gating of Panx1 channels. These C-terminally truncated Panx1 channels are characterized by increased permeability to both organic anions, such as ATP, and organic cations (10, 13, 14), such as propidium family dyes. Studies with the Jurkat lymphocytes and mouse thymocytes demonstrated caspase-3-dependent activation of Panx1 channels and consequent ATP release in response to Fas-triggered induction of the extrinsic apoptotic cascade or UV irradiation-induced activation of the intrinsic apoptosis program (10, 18, 19).
A different pathway for ATP release from apoptotic tumor cells was elucidated by Zitvogel and co-workers (1) and Kroemer and co-workers (20)based on studies with multiple murine tumor models, including EL4/EG7 thymoma, CT26 colon carcinoma, and MCA205 fibrosarcoma, as well as some human cancer cells such as U2OS osteosarcoma. Significant release of ATP from these tumor cells was induced by a broad range of chemotherapeutic drugs or pro-apoptotic agents, including anthracyclines, oxaliplatin, etoposide, and staurosporine. The extracellular accumulation of ATP was temporally correlated with a reduction in quinacrine-labeled intracellular puncta in the apoptotic tumor cells; quinacrine acts to fluorescently label ATP-containing acidophilic organelles or granules (20). Subsequent studies revealed that chemotherapeutic drug-induced ATP release was suppressed by pharmacological or genetic suppression of the autophagy regulators Atg5 and Atg7 and correlated with exocytosis of lysosomes (5). The autophagy proteins acted to increase ATP compartmentalization within a subset of secretory lysosomes. Parallel signals in the apoptotic cells promoted exocytotic fusion of these ATP-containing lysosomes with the plasma membrane. Inhibition of caspase-3 or knockdown of Panx1 attenuated lysosome exocytosis and secretion of ATP (21, 22). However, Panx1 in these tumor cell models was predominantly expressed as an intracellular protein prior to apoptosis but translocated to the plasma membrane concomitantly with apoptotic induction of lysosome exocytosis. In this model, Panx1 channels act as regulators of the exocytosis of ATP-containing lysosomes rather than conduits for the direct efflux of cytosolic ATP (21).
In this study, we used the Jurkat T cell acute lymphocytic leukemia models to address unresolved mechanistic questions regarding the role of Panx1 channels in the release of ATP and other metabolites from tumor cells during chemotherapeutic drug-induced apoptosis.
EXPERIMENTAL PROCEDURES
Cell Models and Reagents
The human Jurkat T cell acute lymphocytic leukemia and human THP1 promonocytic leukemia lines were obtained from ATCC. The human CEM T lymphoblastic leukemia line was generously provided by Dr. Aaron Weinberg (Case Western Reserve University). Normal human T lymphoblasts, expanded from human peripheral blood leukocytes cultured with phytohemagglutinin and IL-2 as described previously (23), were generously provided by Dr. Alan Levine (Case Western Reserve University). Key reagents were obtained from the following sources. Anti-human Fas (CH11 clone) was from Millipore; anti-human CD3 (OKT3 clone) was from BioLegend; doxorubicin was from (LC Laboratories or Sigma); staurosporine was from LC Laboratories; ATP, phosphoenolpyruvate, etoposide, carbenoxolone, trovafloxacin, probenecid, and 3-methyladenine were from Sigma; U73122 and ARL67156 were from Tocris; Z3-VAD was from Tocris or APExBio; MG132 and bafilomycin were from APExBIO; lyophilized Firefly luciferase ATP assay mix (FLAAM), Firefly luciferase ATP assay buffer (FLAAB), pyruvate kinase (P-1506), and myokinase (M-3003) were from Sigma. EnzChek Caspase 3 assay kit, AlamarBlue® cell viability reagent, YO-PRO, LysoTracker Red-DND 99, and Fluo4-AM dyes were from Invitrogen. Cell Titer-Glo luminescent viability assay kit was from Promega. Anti-PARP (9542) was from Cell Signaling. Anti-β actin (sc-1615) and all horseradish peroxidase (HRP)-coupled secondary antibodies were from Santa Cruz Biotechnology. Pierce® ECL Western blotting substrate was from ThermoScientific. The noncommercial rabbit anti-human pannexin-1 antiserum has been described previously (10, 24).
Cell Culture and Induction of Apoptosis
Jurkat cells were maintained in RPMI 1640 medium supplemented with 10% newborn bovine calf serum (Hyclone), 100 units/ml penicillin, 100 μg/ml streptomycin (Invitrogen), and 2 mm l-glutamine (Lonza) at 37 °C in 5% CO2. For induction of apoptosis and analysis of released adenine nucleotides, the cells were resuspended at 2 × 10⁶ cells/ml (2 ml/well; 6-well plates) in RPMI 1640 medium as above but with 10% bovine calf serum treated for 2 h at 65 °C to inactivate serum nucleotidases. In some experiments, cells were resuspended as above but in serum-free RPMI 1640 medium. The resuspended cells were preincubated for 1 h at 37 °C in 5% CO2 prior to induction of apoptosis by addition of 250 ng/ml anti-Fas, 3 μm staurosporine (STS), 25 μm doxorubicin (Dox), 20 μm etoposide (Etop), or 3 μm MG132. Where indicated, 100 or 500 μm carbenoxolone (CBX), 50 or 100 μm Z-VAD, 50 nm bafilomycin A (BafA), 5 mm 3-methyladenine, 10 μm trovafloxacin, 100 μm ARL67156, or 10 μm U73122 were added 30–60 min before the pro-apoptotic stimuli.
Collection of Conditioned Medium and Measurement of Released Adenine Nucleotides
Samples of the conditioned medium supernatants were taken at the indicated times (routinely 0, 2, 4, 8, 12, and 18 h) after addition of pro-apoptotic stimuli and centrifuged at 13,500 rpm for 15 s to pellet any cells. The cell-free supernatants were transferred to fresh tubes for analysis of either ATP only or total adenine nucleotides (ATP + ADP + AMP). For luciferase-based quantification of ATP only, a 50-μl aliquot of conditioned medium supernatant was supplemented with 46 μl of FLAAB and 4 μl of concentrated FLAAM (reconstituted with 5 ml of sterile water per vial of lyophilized luciferase/luciferin mix) and transferred to a well of a 96-well white plate. The ATP-dependent bioluminescence was measured with a BioTek Synergy HT plate reader (1 s integration of emitted light) and quantified by comparison with ATP standards assayed under identical conditions. For quantification of total adenine nucleotides, samples were subjected to a protocol modified from Ref. 25, whereby AMP and ADP were rephosphorylated to ATP (in a cycling reaction driven by excess phosphoenolpyruvate in the presence of pyruvate kinase and myokinase) prior to the luciferase analysis described above. 50 μl of conditioned medium supernatant was supplemented with 8.3 μl of rephosphorylation mixture (25 mm K-HEPES, pH 8.0, 50 mm MgSO4, 8.3 mm phosphoenolpyruvate, 600 units/ml myokinase, 300 units/ml pyruvate kinase) and incubated for 90 min at 37 °C. 37.7 μl of FLAAB and 4 μl concentrated FLAAM were then added to each resphosphorylated sample, and ATP-dependent bioluminescence was measured.
Measurement of Intracellular ATP, ADP, and AMP Content
Jurkat cells were incubated in the absence or presence of anti-Fas (4 h), STS (4 h), Dox (8 h), or Etop (8 h). Aliquots of cell suspension were centrifuged, and the cell pellets were resuspended in assay buffer (25 mm HEPES, 15 mm KOH, pH 8.0, 50 mm MgSO4) and lysed by heating in a boiling water bath for 1 min. The lysates were centrifuged to sediment denatured protein, and 25-μl aliquots were immediately assayed for ATP, ADP, or AMP content by adaptation of the rephosphorylation protocol described above but with a separate pyruvate kinase-only incubation to assay ADP versus combined pyruvate kinase/myokinase incubation to assay AMP. Quantification of each nucleotide (ATP, ADP, and AMP) in the lysates was determined relative to parallel rephosphorylation reactions containing known concentrations of ATP, ADP, or AMP standards.
Caspase-3 Activity
Jurkat cell suspensions were treated with pro-apoptotic stimuli as indicated above for the adenine nucleotide release experiments. At various times post-apoptotic induction, aliquots of cell suspension were centrifuged to pellet the cells. The cell pellets were washed, resuspended in PBS, and then mixed with EnzChek Caspase-3 kit (Invitrogen) lysis buffer. Caspase 3 activity in the cell lysates was assayed using caspase 3 reaction reagents as described in the vendor protocol.
Measurement of Cell Viability by AlamarBlue Metabolism or Intracellular ATP Content
Cell viability was measured using the AlamarBlue Cell Viability reagent® (Invitrogen) as described in the vendor protocol. Quantification of the fluorescent resorufin product produced by viable cells was measured with the BioTek Synergy HT plate reader using a 540/620-nm filter set. As an alternative assay of cell viability directly correlated with intracellular ATP, we used the Cell Titer-Glo® luminescent cell viability assay reagent (Promega) as described in the vendor protocol. This assay reagent combines a cell lysis buffer and proprietary thermostable recombinant luciferase for quantification of cell viability based on ATP content. At various times post-apoptotic induction, 25-μl aliquots of Jurkat cell suspensions were diluted to 100 μl with culture medium and mixed with 100 μl of reconstituted Cell Titer-Glo reagent per well of a 96-well white plate, and the ATP-dependent bioluminescence was measured with the BioTek plate reader.
Western Blot Analysis
1-ml aliquots of Jurkat cell suspension (2 × 10⁶ cells) were centrifuged, and the cell pellets were washed in PBS. Whole cell lysates were prepared by detergent-based extractions prior to standard processing by SDS-PAGE (12% polyacrylamide), transfer to PVDF membranes, and Western blot analysis as described previously (26). Primary antibodies were used at the following concentrations or dilutions: anti-human Panx1 serum (1:5000), anti-PARP (0.05 μg/ml), and anti-actin (1 μg/ml). HRP-conjugated secondary antibodies were used at a final concentration of 0.13 μg/ml. Chemiluminescent images of the blots were developed with ECL reagent, imaged, and quantified using a FluorChemE processor and AlphaView SA imaging software (Cell Biosciences).
YO-PRO Dye Uptake by End Point Assay
500-μl aliquots of Jurkat cell suspension (106/ml) were treated with anti-Fas (4 h), STS (4 h), Etop (8 h), Dox (12 h), or MG132 (8 h) in the absence or presence of 100 μm Z-VAD, collected by centrifugation, and washed once with PBS. The washed cell pellets were resuspended in 500 μl of basal salt solution (BSS) containing 130 mm NaCl, 5 mm KCl, 1 mm MgCl2, 1.5 mm CaCl2, 25 mm NaHEPES, pH 7.5, 5 mm glucose, and 0.1% bovine serum albumin. This suspension was divided into two 250-μl aliquots. One was supplemented with 250 μl of BSS containing 200 μm CBX (final concentration 100 μm), and the other was supplemented with 250 μlof BSS lacking CBX. Both aliquots were preincubated at room temperature for 15 min prior to addition of 1 μm YO-PRO dye and incubation for an additional 20 min. The cells were pelleted by brief centrifugation, washed once in PBS, and resuspended in 250 μl of fresh BSS. 200-μl aliquots were transferred to wells in a 96-well black wall/clear bottom plate, and the fluorescence (485 nm/540 nm) was measured on the BioTek Synergy HT plate reader. Afterward, phase contrast and epifluorescence images of the cells in each well were viewed and recorded using a Zeiss Axiovert 25 microscope equipped with a 485/540-nm filter set, QCam1394 digital camera, and QCapturePro imaging software (QImaging).
YO-PRO Dye Uptake by On-line Kinetic Assay
500-μl aliquots of Jurkat cell suspension (106/ml) were suspended in BSS containing 5 mm glucose, 0.1% BSA, and 1 μm YO-PRO and transferred to the wells of a 24-well plate. The cell suspensions in some wells were additionally supplemented with 100 μm Z-VAD or 100 μm CBX, and the 24-well plate was equilibrated to 37 °C in the BioTek Synergy HT plate reader. Baseline fluorescence (485/540 nm) in each well was measured at 1-min intervals for 5 min prior to the addition of 3 μm STS (or vehicle). The fluorescence in each well was measured at 1-min intervals for an additional 4 h prior to the addition of digitonin (100 μm) to permeabilize all cells. Digitonin-induced increases in fluorescence were measured at 30-s intervals for 10 min.
Fluo-4 Assay of Cytosolic [Ca2+]
Washed Jurkat cells were resuspended (106/ml) in BSS supplemented with 1 μm fluo-4 AM (premixed with pluronic F-127 at 1:1 by volume) and 2.5 mm probenecid. Cells were incubated at 37 °C for 45 min, washed in PBS, and resuspended in fresh BSS in the absence or presence of 2.5 mm probenecid. 500-μl aliquots were transferred to the wells of a 24-well plate that was placed into the BioTek Synergy HT plate reader preheated to 37 °C. Baseline fluorescence (485/540 nm) in each well was measured at 20-or 60-s intervals for 10 min. Cells were then stimulated 1 μg/ml anti-CD3, 10 μm ionomycin, 3 μm STS, or 5 mm ATP for 0.5 or 4 h. Where indicated, cells were treated with 5, 10, or 20 μm U73122 for 10 min prior to addition of anti-CD3. At the end of each assay, cells were permeabilized with 1% Triton X-100 to determine maximum Ca2+-dependent fluorescence and then supplemented with 15 mm EGTA and 50 mm Tris to determine Ca2+-independent fluorescence.
LysoTracker Red Accumulation Assay
1-ml aliquots of Jurkat cell suspension (2 × 10⁶/ml) in standard RPMI 1640 culture medium were transferred to the wells of a 24-well plate and supplemented with or without 250 nm bafilomycin A or 100 μm Z-VAD. After 60 min at 37 °C, the cells were treated with or without 3 μm STS and incubated for an additional 4 h. The cell suspensions were collected for centrifugation, and the cell pellets were washed once in PBS, resuspended in 500 μl of BSS containing 100 nm LysoTracker Red, and transferred to the wells of a 24-well plate. LysoTracker Red fluorescence (540 nm/620 nm) in each well was immediately measured in the BioTek plate reader.
Data Analysis
All experiments were repeated 2–4 times with separate Jurkat cell culture preparations. Figures illustrating Western blot results are from representative experiments. Where indicated, figures illustrating quantification of extracellular adenine nucleotide accumulation, cell viability, intracellular adenine nucleotide content, caspase-3 activity, or YO-PRO dye uptake represent either the mean (± S.E.) of data from several identical experiments or the mean (± S.E.) of triplicate independent cell suspension analyses from a single representative experiment. Quantitative results were analyzed by one-way analysis of variance with Tukey post-test comparison using Prism 3.0 software.
RESULTS
Chemotherapeutic Drugs Induce Caspase-3-mediated Excision of the Panx-1 Autoinhibitory Domain
Previous studies have defined the kinetics of caspase-3-mediated gating of Panx1 channels during Jurkat cell apoptosis induced by Fas receptor activation but not by chemotherapeutic drugs (10, 18, 19). Using Fas activation as a positive control stimulus, we compared the kinetics of caspase-3 activation and loss of cell viability in Jurkat cells treated with staurosporine (STS), a broad-spectrum kinase inhibitor widely used as a model pro-apoptotic inducer, or two clinically relevant topoisomerase II inhibitors, Etop and Dox. The three drugs were tested at concentrations known to be maximally efficacious in inducing apoptotic death in the Jurkat model. Fig. 1A shows that 3 μm STS mimicked the ability of anti-Fas to trigger a rapid accumulation of active caspase-3 within 2 h that preceded measurable loss of cell viability as indicated by the capacity to efficiently metabolize Alamar Blue dye (Fig. 1B). In contrast, significant caspase-3 activation required a 4-h incubation with 20 μm Etop or an 8-h exposure to 25 μm Dox. As with the anti-Fas or STS stimuli, the Etop- and Dox-induced accumulation of active caspase-3 preceded the loss of cell viability. Notably, the decreases in Jurkat cell viability induced by STS, Etop, Dox, or anti-Fas were markedly delayed and attenuated by the pan-caspase inhibitor, Z-VAD-fmk (Fig. 1C).
FIGURE 1.
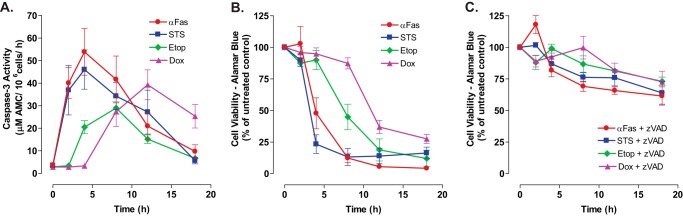
Comparative time courses for accumulation of active caspase-3 and loss of viability in Jurkat leukemic T cells treated with different chemotherapeutic agents. A, Jurkat T cells were treated with anti-Fas (250 ng/ml), STS (3 μm), Etop (20 μm), or Dox (25 μm). Cell lysates were prepared at the indicated times and then assayed for caspase 3 activity. Experiments with each agent were repeated 2–5 times with data indicating mean ± S.E. for n = 4 (anti-Fas), n = 5 (STS and Dox); n = 2 (Etop). B and C, Jurkat T cells were treated with anti-Fas (250 ng/ml), STS (3 μm), Etop (20 μm), or Dox (25 μm) in the absence or presence of Z-VAD (50 μm for anti-Fas-stimulated cells or 100 μm for cells stimulated with STS, Etop, or Dox). At the indicated times, aliquots were taken and immediately assayed for cell viability by measuring metabolism of AlamarBlue® dye to its fluorescent resorufin product. Data indicate mean ± S.E. for n = 3 experiments.
Asparagine 254 in the second extracellular loop of human Panx1 is N-glycosylated during synthesis, and this glycosylation enhances trafficking of mature Panx1 channels to the plasma membrane (11, 24, 27). Three different glycosylation states of Panx1 have been described: the Gly-0 core unglycosylated protein; the Gly-1 high mannose species that predominates in the endoplasmic reticulum pool; and the Gly-2 complex glycoprotein that is the most abundant form in control Jurkat cells (Fig. 2A) as detected using a previously characterized polyclonal rabbit antibody. This antibody recognizes residues 412–426 within the autoinhibitory C-terminal domain downstream of the caspase-3/7-cleavage site at Asp-379; two nonspecific bands in Jurkat lysates above and below the three specific Panx1 bands were also labeled by this antiserum. We compared the expression of Panx1 in whole cell lysates from control versus apoptotic (20 μm Etop, 8 h) Jurkat cells (Fig. 2A). The C-terminal autoinhibitory segment was efficiently cleaved from all three species of Panx1 in the apoptotic cells. The cleaved C-terminal fragment was not detectable on PVDF membranes after transfer from the 12% gels, presumably due to its small size (∼5 kDa) and possible intracellular instability. Using Fas activation as a positive control stimulus (Fig. 2B), we compared the kinetics of this Panx1 proteolytic processing in cells treated with STS (Fig. 2C), Etop (Fig. 2D), or Dox (Fig. 2E) in either the absence or presence of Z-VAD. STS mimicked the ability of anti-Fas to rapidly trigger significant proteolytic processing of Panx1 within 2 h and complete removal of the autoinhibitory domain by 4 h. PARP1 is a canonical substrate for the apoptotic executioner caspases-3/7, and the rapid Panx1 processing induced by STS (or anti-Fas) was temporally well correlated with conversion of the 115-kDa full-length PARP1 to its 89-kDa cleavage product. The kinetics of Panx1 proteolytic processing in the Etop- and Dox-treated cells were also well correlated with PARP1 cleavage, but it was delayed relative to the actions of STS or anti-Fas (Fig. 2, D–F) and consistent with the slower accumulation of active caspase-3 elicited by these drugs (Fig. 1B). The efficacy of Z-VAD in inhibiting caspase-3-dependent processing of its cellular substrates was verified by the complete suppression of PARP1 cleavage in cells incubated with any of the three chemotherapeutic drugs or anti-Fas in the presence of Z-VAD. Notably, Z-VAD was also able to completely suppress the proteolytic processing of Panx1 at each incubation time point in the anti-Fas-treated Jurkat cells (Fig. 2B). In contrast, the loss of full-length Panx1 glycoprotein species induced by STS, Etop, or Dox was markedly delayed in the presence of Z-VAD (Fig. 2, C–E with band density quantification in Fig. 2F). However, with prolonged exposure (>12 h) to these agents, the presence of Z-VAD had little effect on the final decrease in the levels of intact Panx1. These observations might indicate that the C-terminal autoinhibitory domain can be removed by a noncaspase family protease activated by chemotherapeutic agents but not death receptors in Jurkat cells under conditions of arrested apoptotic signaling. Alternatively, nonprocessed Panx1 channel proteins may be internalized and routed for degradation by other mechanisms when cells are treated with these drugs in the presence of caspase inhibitors. These alternatives are addressed below.
FIGURE 2.

Chemotherapeutic drugs induce caspase-3-mediated cleavage of the pannexin-1 C-terminal autoinhibitory domain. A, membrane topography of Panx1 protein subunit indicating the relative positions of the caspase-3 cleavage site and epitope recognized by the anti-Panx1 antibody used in the Western blot of cell lysates from control Jurkat cells or apoptotic Jurkat cells (20 μm Etop, 12 h). The indicated bands show the three different glycosylation states of Panx1 (Gly-0, core, Gly-1, high mannose species, and Gly-2, complex glycoprotein); * indicates nonspecific immunoreactive bands. B–E, Jurkat T cells were treated with 250 ng/ml anti-Fas (B), 3 μm STS (C), 20 μm Etop (D), or 25 μm Dox (E) in the absence or presence of Z-VAD (50 μm for anti-Fas or 100 μm for drugs). At the indicated times, aliquots were taken for Western blot analysis of Panx1, PARP1, and actin. Data are representative of 2–3 experiments with each pro-apoptotic stimulus. F, densitometric quantification of Panx1 bands in Western blots from B to E; bands were normalized to the densities of the t = 0-h samples for each experiment.
Chemotherapeutic Drugs Induce Caspase-dependent Activation of Pannexin-1 Channels
Using Fas activation as a positive control stimulus (Fig. 3, C and G), we compared the levels of plasma membrane Panx1 channel activity in Jurkat tumor cells following treatment with STS (Fig. 3, D and G), Etop (Fig. 3, E and G), or Dox (Fig. 3, F and G) in either the absence or presence of Z-VAD. As illustrated in Fig. 3A, we assayed the influx of YO-PRO dye (over a 20-min test period) as the readout of open-gated Panx1 channel function after incubation times that produced maximal accumulation of active caspase-3 (Fig. 1A) and proteolytic excision of the Panx1 autoinhibitory domain (Fig. 2, B—E) in response to each pro-apoptotic agent (4 h for STS and anti-Fas, 8 h for Etop, and 12 h for Dox). YO-PRO2+ is a 375-Da divalent cation and DNA-intercalating dye (629 Da as the diiodide salt) that is normally membrane-impermeant but readily conducted by open-gated Panx1 channels; the green fluorescence of YO-PRO2+ markedly increases upon binding to intracellular nucleic acids. CBX blocks ion fluxes through open-gated Panx1 channels but does not inhibit the caspase 3-mediated cleavage of the autoinhibitory domain. Previous studies have validated the use of propidium dye influx and CBX blockade for the functional analysis of Panx1 channels (10, 13, 14, 28). Consistent with previous studies and the kinetics of Panx1 proteolytic processing (Fig. 2B), Jurkat cells treated with anti-Fas for 4 h were characterized by robust increases in YO-PRO accumulation as indicated by qualitative fluorescence microscopy (Fig. 3C) or fluorescence plate reader-based quantification (Fig. 3G). Dye uptake was completely suppressed when Z-VAD was present during the 4-h incubation with anti-Fas and was markedly attenuated when CBX was present during the subsequent 20-min YO-PRO influx period. Only a minor fraction of control Jurkat cells were YO-PRO-positive under identical assay conditions (Fig. 3, B and G). Jurkat cells treated with STS for 4 h (Fig. 3, D and G), with Etop for 8 h (Fig. 3, E and G), or with Dox for 12 h (Fig. 3, F and G) were characterized by increased YO-PRO accumulation responses that were qualitatively and quantitatively similar to those observed with anti-Fas stimulation. Similar magnitudes of YoPro uptake were observed in cells treated with Etop for 8 h (Fig. 3G) or 12 h (data not shown) consistent with the near-maximal Panx1 cleavage induced by Etop at 8 h. Co-incubation with Z-VAD suppressed the ability of each drug to induce increased YO-PRO uptake, although inclusion of CBX during the dye influx assay decreased net accumulation and the numbers of YO-PRO bright cells. It is important to note that intracellular accumulation of the intensely red doxorubicin quenches the emitted green fluorescence of the YO-PRO·DNA complexes and thus decreases the absolute fluorescence measured in the plate reader assay (Fig. 3G, last data set on right). However, similar numbers of YO-PRO-positive cells, albeit with dimmer intensity per cell, were observed by fluorescence microscopy of the Dox-treated samples (Fig. 3F). To determine the onset of gating of Panx1 channels with significant permeability to YO-PRO, a real time/on-line YO-PRO uptake assay was performed using STS and anti-Fas as rapid apoptotic inducers. Significant YO-PRO influx in suspensions of Jurkat cells treated with STS (Fig. 3H) or anti-Fas (data not shown) occurred after a 90-min lag time, and this influx was completely suppressed in the presence of Z-VAD and markedly blocked by CBX. These data taken together indicate that pro-apoptotic chemotherapeutic drugs induce accumulation of functionally active Panx1 channels in hematopoietic tumor cells via a caspase-3-dependent activation mechanism.
FIGURE 3.

Chemotherapeutic drugs induce accumulation of active pannexin-1 channels via a caspase-dependent activation mechanism. A, schematic of the YoPro dye uptake end point assay. Jurkat T cells were incubated as follows: with no stimulus for 4 h (B); with 250 ng/ml anti-Fas, 4 h (C); 3 μm STS, 4 h (D); 20 μm Etop, 8 h (E); or 25 μm Dox (F) in the absence or presence of 100 μm Z-VAD. The treated cells were then washed, resuspended in basal saline supplemented with 1 μm YoPro ± 100 μm CBX, and incubated for 20 min prior to plate reader quantification of accumulated YoPro fluorescence per well (G) or phase-contrast and epifluorescence imaging (B–F). G, data indicate mean ± S.E. for n = 3 experiments for STS, Etop, and Dox, and n = 2 experiments for anti-Fas. *, p < 0.05; **, p < 0.01; ***, p < 0.001. H, schematic of the YoPro dye uptake kinetic assay. Jurkat cells were suspended in basal saline supplemented 1 μm YoPro ± 100 μm CBX ± 100 μm Z-VAD transferred to the wells of a 24-well plate. Fluorescence (485/540 nm) was measured at 1-min intervals for 15 min prior to addition of 3 μm STS (or vehicle) and then at 1-min intervals for an additional 4 h prior to the addition of digitonin (Dig) to permeabilize the cells. Data are representative of three experiments.
Caspase-gated Panx1 Channels Mediate Robust Efflux of AMP and ADP in Addition to ATP
When Jurkat T cells were treated with anti-Fas, STS, Etop, or Dox, intracellular ATP levels decreased (Fig. 4A) with time courses and delay phases similar to those describing the proteolytic processing of Panx1 induced by those agents. Z-VAD markedly delayed the decrease in intracellular ATP in STS-treated cells and completely suppressed it in cells incubated with anti-Fas, Etop, or Dox (Fig. 4B). The decreases in intracellular ATP were also correlated with decreases in the ratios of intracellular [ATP]:[ADP]:[AMP] during apoptotic progression induced by anti-Fas or the chemotherapeutic drugs (Fig. 4C). The decrease in intracellular ATP could reflect ATP efflux via the activated Panx1 channels, its intracellular metabolism to ADP and AMP, or a combination of the two processes. We hypothesized that active Panx1 channels will facilitate ATP efflux during the initial phases of apoptotic signaling but will increasingly mediate release of the metabolites ADP and AMP with ongoing apoptotic progression (Fig. 4D). Given the rapid and robust decrease in intracellular ATP induced by the 4-h exposure to STS, we measured the corresponding extracellular accumulation of ATP only (Fig. 4E) versus the sum of extracellular ATP, ADP, and AMP (ANex) (Fig. 4F) in medium conditioned for 4 h by STS-treated Jurkat cells. ANex accumulation was quantified by processing extracellular samples with a myokinase and pyruvate kinase-based rephosphorylation protocol prior to assaying total ATP via luciferin-luciferase. We additionally tested how the relative magnitudes of STS-induced ATP versus ANex accumulation might be modulated in the presence of ARL67156, an inhibitor of the CD39 family ecto-nucleotidases that serially metabolize extracellular ATP to ADP and ADP to AMP (29). Only 5 nm extracellular ATP accumulated in medium conditioned for 4 h by control Jurkat cells and ARL67156 induced a 2-fold increase in this basal ATP accumulation. STS treatment increased extracellular ATP accumulation by 12-fold to 60 nm, and this was modestly potentiated to 80 nm in the presence of the ecto-ATPase inhibitor. Notably, in both the absence and presence of ARL67156, the summed concentrations of the extracellular ATP + ADP + AMP species at this 4-h time point after STS stimulation increased to the 1200–1500 nm range that was 20-fold higher than the levels of ATP only. These data indicate that apoptotic Jurkat cells directly release large amounts of ADP and AMP in addition to ATP per se, rather than generating most of this extracellular ADP/AMP as a secondary consequence of ecto-nucleotidase action on the released ATP.
FIGURE 4.

Efflux of both ATP and ATP metabolites is triggered during chemotherapeutic drug-induced apoptosis of Jurkat cells. Jurkat T cells were treated with 250 ng/ml anti-Fas, 3 μm STS, 20 μm Etop, or 25 μm Dox in the absence or presence of Z-VAD (50 μm for anti-Fas or 100 μm for drugs) as indicated. A and B, cell lysates were prepared at the indicated times and processed for measurement of intracellular ATP content as described under “Experimental Procedures.” ATP content in cells treated with pro-apoptotic agents was normalized to the ATP content in control cells. Experiments with each agent were repeated 2–5 times with data indicating mean ± S.E. for n = 4 (anti-Fas), n = 5 (STS and Dox), n = 2 (Etop). C, Jurkat cells were treated with anti-Fas or STS for 4 h or with Etop or Dox for 8 h. Heat-denatured cell extracts were prepared and assayed for intracellular ATP, ADP, and AMP content as described under “Experimental Procedures.” Data (mean ± S.E.) are from one experiment performed in triplicate. D, schematic of Panx1 activation by caspase-3 cleavage secondary to chemotherapeutic drug induction of intrinsic apoptosis via release of mitochondrial cytochrome c. Caspase-gated Panx1 channels will mediate efflux of cytosolic ATP and ADP (and AMP, data not shown), the levels of which will vary with progressive mitochondrial dysfunction. Following release, extracellular ATP and ADP can also hydrolyzed by ectonucleotidases. E and F, Jurkat cells were suspended in serum-free RPMI 1640 medium and treated with 3 μm STS for 4 h in the absence or presence of 100 μm ARL67156 ecto-nucleotidase inhibitor. Samples of the extracellular medium were processed for analysis of ATP only (E) or summed ATP + ADP + AMP (F). Data indicate mean ± S.E. for n = 6 wells from two experiments.
We next compared the time courses of extracellular ATP versus ANex accumulation during apoptotic induction by anti-Fas, STS, Etop, and Dox. Consistent with previous reports, anti-Fas induced a rapid 10-fold increase in extracellular ATP within 4 h to a 60 nm plateau (Fig. 5A); after 8 h, the extracellular [ATP] gradually decreased due to the modest Jurkat cell ectonucleotidase activity described in Fig. 4E. The summed concentration of the three extracellular adenine nucleotide species within 4 h after Fas stimulation increased to 1200 nm, a 20-fold higher level than the ATP only; this further increased by ∼2-fold over the next 14 h (Fig. 5E). Similar to anti-Fas, STS also triggered a rapid 10-fold increase in extracellular ATP within 4 h that dissipated over the next 14 h of apoptotic progression (Fig. 5B). Again, the magnitude of total ANex accumulation was much greater (1800 nm) than that of ATP only during the early phase of STS-induced apoptosis and continued to increase over the next 18 h (Fig. 5F). Corresponding with their slower rates of caspase-3 activation and proteolytic processing of Panx1, Jurkat cells incubated with Etop or Dox were characterized by 4–6-h lag phases before releasing significant amounts of ATP (Fig. 5, C and D) or total ANex (Fig. 5, G and H) into the extracellular compartment. However, following these lag phases, the rates and magnitudes of ATP release and total ANex accumulation were similar to those observed with anti-Fas or STS stimulation. The onset of ATP accumulation was co-temporal with summed ANex accumulation in the Etop- and Dox-treated cells, but the peak amounts of released ATP were 20–30-fold lower than the total ANex. These data suggest that a changing mixture of ATP, ADP, and AMP is released from the Jurkat tumor cells during apoptotic progression with ADP and AMP comprising the predominant species at later times.
FIGURE 5.

Caspase-activated pannexin-1 channels mediate the efflux of ATP and ATP metabolites during chemotherapeutic drug-induced apoptosis but an alternative ATP release mechanism is engaged in the context of suppressed caspase activity. Jurkat T cells were treated with 250 ng/ml anti-Fas (A and E), 3 μm STS (B and F), 20 μm Etop (C and G), or 25 μm Dox (D and H) in the absence or presence of Z-VAD (50 μm for anti-Fas or 100 μm for drugs) as indicated. Samples of the extracellular medium were processed for analysis of ATP only (A–D) or summed ATP + ADP + AMP (E–H). Data indicate mean ± S.E. for n = 4–6 wells from two to three experiments (n = 4 for A, B, D, G, and H; n = 6 for E and F).
Chemotherapeutic Drugs Induce Caspase-gated ATP Release via Panx1 and an Alternative ATP Release Pathway in the Presence of Caspase Inhibition
To characterize the role of caspase-3-gated Panx1 channels in the accumulation of extracellular ATP and total ANex, Jurkat cells were treated with anti-Fas or the three pro-apoptotic drugs in the presence of Z-VAD. The accumulation of both ATP and summed ANex in anti-Fas-treated cell cultures was completely suppressed by Z-VAD at all times during the 18-h incubation (Fig. 5, A and E). Likewise, Z-VAD completely blocked the release of ATP and accumulation of ANex during the early phase (≤4 h) of STS treatment (Fig. 5, B and F). However, with sustained (>4 h) exposure to STS plus Z-VAD, Jurkat cells were characterized by a prolonged phase of ATP release and ANex accumulation over the next 14 h. Although the absolute magnitude of STS-induced ANex accumulation was markedly reduced in the presence of Z-VAD, the ratios of extracellular ATP/ANex in the STS + Z-VAD-treated cell cultures were invariably greater than those measured in the matched STS only-treated cell cultures. For example, at 12 h, extracellular ATP/ANex was 0.19 in the STS + Z-VAD-treated cells versus 0.008 in the STS-stimulated cells. In the presence of Z-VAD, Etop treatment also elicited a sustained release of ATP that, after 8 h, exceeded that measured in the absence of Z-VAD (Fig. 5C). As with STS, Z-VAD markedly reduced but did not eliminate ANex accumulation in Etop-treated cultures (Fig. 5G); the ratio of extracellular ATP/ANex in Etop-treated Jurkat cells was increased by Z-VAD at each time point after 8 h. In Dox-treated cells, co-incubation with Z-VAD almost completely suppressed the extracellular accumulation of ATP only (Fig. 5D) and the summed ANex (Fig. 5H). However, a modest Z-VAD-resistant ATP release was observed at the 18-h time point after addition of Dox (Fig. 5D) suggesting delayed activation of the caspase-insensitive ATP secretion response. These data suggest that chemotherapeutic agents can activate an alternative caspase-insensitive mechanism for secretion of ATP only (or predominantly) and that this response that is engaged in the context of caspase inhibition prevents gating of Panx1 channels that facilitate efflux of AMP and ADP in addition to ATP.
To verify that the Z-VAD-sensitive nucleotide release was mediated by activated Panx1 channels, we compared extracellular accumulation of ATP or summed ANex in Jurkat cultures incubated with the four pro-apoptotic stimuli in the absence or presence of CBX (Fig. 6). For each agent, we assayed the CBX sensitivity at time points where Z-VAD-sensitive ATP release was maximal (from Fig. 5: 4 h for anti-Fas and STS, 8 h for Etop, and 12 h for Dox). Because CBX by itself induced modest increases in extracellular ATP or ANex in control (Con) cells, we quantified the CBX-sensitive responses in the apoptotic stimulus (Stim)-treated cells using the equation: [Stim plus CBX] − [Con plus CBX]/[Stim − CBX] − [Con − CBX]. In anti-Fas-treated cells, CBX reduced ANex by 81% (Fig. 6A) and ATP release by 68% (Fig. 6E). In STS-treated cells, CBX reduced ANex by 95% (Fig. 6B) and ATP release by 65% (Fig. 6F). In Etop-treated cells, CBX reduced ANex by 90% (Fig. 6C) and ATP release by 95% (Fig. 6G). Finally, in Dox-treated cells, CBX reduced ANex by 86% (Fig. 6D) and ATP release by 59% (Fig. 6H). Thus, CBX-sensitive Panx1 channels include the predominant mechanism for release of ATP, ADP, and AMP from anti-Fas- or chemotherapeutic drug-treated Jurkat cells with intact apoptotic caspase signaling cascades.
FIGURE 6.

Carbenoxolone blocks the efflux of ATP and ATP metabolites during chemotherapeutic drug-induced apoptosis. Jurkat T cells were incubated with no stimulus, with 250 ng/ml anti-Fas, 4 h (A and E); 3 μm STS, 4 h (B and F); 20 μm Etop, 8 h (C and G); or 25 μm Dox, 12 h (D and H) in the absence or presence of 100 μm CBX (A–D) or 500 μm CBX (E–H). Samples of the extracellular medium were processed for analysis of summed ATP + ADP + AMP (A–D) or ATP only (E–H). Data indicate mean ± S.E. for n = 2–3 experiments each performed in triplicate. **, p < 0.01; ***, p < 0.001.
Caspase-insensitive ATP Release Is Resistant to Carbenoxolone Blockade but Suppressed by Intracellular Ca2+ Buffering
We next considered possible mechanisms (Fig. 7A) for the alternative caspase-insensitive ATP release observed in Jurkat cells treated with STS (Fig. 5B) or Etop (Fig. 5C) in the presence of Z-VAD. In addition to excision of the autoinhibitory domain, Panx1 channels can be reversibly activated by other stimuli, including G protein-coupled receptor signaling or mechanical perturbation of the subplasma membrane cytoskeleton (17, 30, 31). We tested whether noncleaved Panx1 channels might be gated by signals that progressively accumulate in Jurkat cells treated with chemotherapeutic drugs in the context of suppressed caspase signaling. These experiments used STS as the model stimulus given its more rapidly induced actions and tested for Panx1 channel involvement based on the known ability of CBX to block YO-PRO or ATP fluxes through activated but noncleaved Panx1 channels. Fig. 7B illustrates the typical severalfold increase in ATP release (at 8 h) induced by combined STS + Z-VAD treatment versus STS alone. The additional presence of CBX did not prevent this enhanced ATP release but further increased it by 2.5-fold (CBX also modestly enhanced STS-induced ATP even in the absence of Z-VAD). This potentiating action of CBX on ATP accumulation was also observed in cells co-treated with STS plus Z-VAD for 12 h (data not shown). In the same conditioned samples, we observed only inhibitory effects of CBX, Z-VAD, or combined Z-VAD + CBX on the STS-stimulated extracellular accumulation of the summed adenine nucleotide species (Fig. 7C). We also tested the effects of trovafloxacin that has recently been identified as another pharmacological inhibitor of Panx1 channels (19). Similar to the CBX experiments, the presence of 30 μm trovafloxacin (trova) did not antagonize the STS + Z-VAD-induced ATP release at 8 h (STS only, 14.5 ± 3.1 nm; STS + Z-VAD, 115.6 ± 6.6 nm; STS + trova, 13.5 ± 0.9 nm; STS +Z-VAD + trova, 109.4 ± 6.5 nm, n = 6 from two experiments). As expected, trovafloxacin markedly inhibited the caspase-dependent release of summed adenine nucleotides induced by an 8-h exposure to STS (STS only, 1589 ± 197 nm; STS + Z-VAD, 372 ± 18 nm; STS + trova, 616 ± 56 nm; STS + Z-VAD + trova, 380 ± 24 nm, n = 6). These data indicate the caspase-independent ATP release pathway is also independent of Panx1 channel activity.
FIGURE 7.

Caspase-insensitive ATP release stimulated by chemotherapeutic drugs is resistant to carbenoxolone blockade but suppressed by intracellular Ca2+ buffering. A, schematic of alternative ATP release pathways. When caspases are inhibited, ATP may be secreted via activation of noncleaved Panx1 channels or exocytosis of secretory lysosomes or autophagolysosomes. B and C, Jurkat T cells were incubated with no stimulus or with 3 μm STS for 8 h in the absence or presence of 100 μm Z-VAD, 500 μm CBX, or both inhibitors. Samples of the extracellular medium were processed for analysis of ATP only (B) or summed ATP + ADP + AMP (C). Data indicate mean ± S.E. for n = 6 wells from two experiments; ***, p < 0.001. D, Jurkat T cells were incubated for 1 h at 37 °C in either standard BSS (1.5 mm CaCl2) or calcium-free BSS (0 mm CaCl2) in the absence or presence 25 μm BAPTA-AM and then resuspended in fresh 1.5 calcium-BSS or 0 calcium BSS. The BAPTA-loaded or mock-loaded cells were then incubated with no stimulus or with 3 μm STS for 8 h in the absence or presence of 100 μm Z-VAD. Samples of the extracellular medium were processed for analysis of ATP. Data indicate mean ± S.E. for one experiment performed in triplicate; ns, p > 0.05; ***, p < 0.001. E and F, Jurkat T cells were incubated for 1 h at 37 °C in standard BSS (1.5 mm CaCl2) in the absence or presence 25 μm BAPTA-AM and then resuspended in fresh BSS. The BAPTA-loaded or mock-loaded cells were then incubated with no stimulus or with 3 μm STS for 8 h in the absence or presence of 100 μm Z-VAD. Samples of the extracellular medium were processed for analysis of ATP only (E) or summed ATP + ADP + AMP (F). Data indicate mean ± S.E. for n = 3 experiments; *, p < 0.05; **, p < 0.01; ***, p < 0.001. G, Jurkat cells were preincubated for 1 h in the absence or presence of 250 nm bafilomycin A (BafA), 100 μm Z-VAD, or both inhibitors. The cells were incubated for an additional 4 h with or without 3 μm STS and then assayed for LysoTracker Red accumulation. Data indicate average ± range from one experiment performed in duplicate. H, Jurkat T cells were incubated with no stimulus or with 3 μm STS for 8 h in the absence or presence of 100 μm Z-VAD, 250 nm bafilomycin A, or both inhibitors. Samples of the extracellular medium were processed for analysis of ATP. Data indicates mean ± S.E. for n = 3 experiments each performed in duplicate; ns, p > 0.05; *, p < 0.05. I, Jurkat T cells were incubated with no stimulus or with 3 μm STS for 8 h in the absence or presence of 100 μm Z-VAD, 5 mm 3-methyladenine (3MA), or both inhibitors. Samples of the extracellular medium were processed for analysis of ATP. Data indicate mean ± S.E. for n = 6 wells from two experiments; ns, p > 0.05; ***, p < 0.001.
Recent studies have indicated that several cell types, including astrocytes (32), Jurkat T cells (33), and THP1 monocytes (34), have a subpool of ATP-containing lysosomes that can be mobilized for rapid exocytosis in response to increases in cytosolic [Ca2+] (Fig. 7A). We tested the effects of either deleting the normal 1.5 mm CaCl2 from the extracellular saline or loading Jurkat cells with BAPTA, a high affinity Ca2+ chelator that buffers and blunts increases in cytosolic [Ca2+]. Although the absence of extracellular Ca2+ did not attenuate the caspase-independent ATP release (Fig. 7D), BAPTA loading completely suppressed this response (Fig. 7E). BAPTA also partially attenuated the extracellular accumulation of the summed adenine nucleotide species triggered by STS in the absence of Z-VAD (Fig. 7F), suggesting possible modulation of the caspase-3/Panx1 signaling axis by Ca2+. The potent inhibitory effect of BAPTA loading implicates a critical role for increased cytosolic [Ca2+] in supporting the caspase-independent ATP release.
We tested whether this Ca2+-dependent response involved exocytotic mobilization of secretory lysosomes or other secretory granules. ATP is concentrated within lysosomes or specialized secretory granules by the SLC17A9 anion transport protein (35). The ability of SLC17A9 to actively transport nucleotides is energized by the organellar membrane potential (Δψ; inside positive) and ΔpH established by the bafilomycin A (BafA)-sensitive vacuolar proton ATPase. Thus, we compared STS + Z-VAD-induced ATP secretion in Jurkat cells incubated in the absence or presence of BafA. Initial experiments verified the efficacy of BafA to decrease lysosomal/vesicular acid loading in Jurkat cells by measuring its ability to reduce intracellular accumulation of the acidophilic LysoTracker Red dye under the experimental conditions used to stimulate ATP release (Fig. 7G). Interestingly, apoptotic induction by STS also reduced LysoTracker Red accumulation, and this effect was reversed in the presence of Z-VAD. Despite the ability of BafA to collapse the ΔpH across lysosomal/vesicular membranes, it did not suppress the caspase-independent ATP release response (Fig. 7H).
Exocytosis of ATP-containing autophagolysosomes has been also been linked to chemotherapeutic drug-induced ATP secretion (21, 22). Autophagosome biogenesis requires the activity of class III phosphatidylinositol 3-kinases that are pharmacologically inhibited by 3-methyladenine (36, 37). However, we observed that inclusion of 5 mm 3-MA during stimulation of Jurkat cells with STS + Z-VAD for 8 h did not reduce ATP release but rather increased this response by 3-fold (Fig. 7I). Similar effects of 3-MA on the STS + Z-VAD-induced ATP accumulation were observed when the incubation was extended to 12 h (data not shown). Taken together, the findings illustrated in Fig. 7, G–I, argue against an obvious role for exocytosis of secretory lysosomes or autophagolysosomes in supporting the caspase-and Panx1-independent ATP release elicited by pro-apoptotic drugs in the presence of Z-VAD.
The suppressive effect of BAPTA-loading on the STS + Z-VAD-induced ATP release suggested that STS may directly or indirectly elicit mobilization of intracellular Ca2+ stores. We tested whether STS might elicit global changes in cytosolic [Ca2+] using Jurkat cells loaded with the fluo-4 indicator dye (Fig. 8B). In initial experiments, we observed rapid (within 60 min) and massive efflux of pre-loaded cytosolic fluo-4, which resulted in increased fluorescence upon binding extracellular Ca2+ (Fig. 8A). This constitutive fluo-4 efflux was mediated by organic anion transporter activity because it was suppressed by millimolar probenecid (which is also a Panx1 channel blocker). Thus, the measurement of cytosolic [Ca2+] in Jurkat cells over prolonged (>30 min) incubations requires the presence of probenecid. Under these assay conditions, no significant elevation of cytosolic [Ca2+] was observed in Jurkat cells during a >3-h incubation with STS (Fig. 8B). This contrasted with the sustained increase in [Ca2+] induced by ionomycin and the robust, but transient, Ca2+ mobilization triggered by T cell receptor (TCR) activation with anti-CD3 OKT antibody. As illustrated in Fig. 5C, these Jurkat cells exhibited a modest increase in cytosolic [Ca2+] in response to 5 mm ATP, which will activate the low ATP affinity P2X7 purinergic receptors expressed in these cells, but no response to 50 μm ATP. Although the Fig. 8B data argue against direct Ca2+-mobilizing actions of STS, it is possible that the longer (4–8 h) STS treatment times associated with the caspase-independent ATP release cause elevated Ca2+ by indirect mechanisms. These could involve the STS-induced release of autocrine mediators (e.g. bioactive lipids) that target Gq- or Gi-coupled receptors with consequent activation of phosphatidylinositol phospholipase C (PI-PLC) effector enzymes and 1,4,5-inositol trisphosphate-sensitive Ca2+ stores. This was investigated using U73122, an inhibitor of both G protein-regulated PI-PLCβ enzymes and the tyrosine kinase-regulated PI-PLCγ effectors in most cell types, including Jurkat T cells (38, 39). Fig. 8D shows that 5–20 μm U73122 markedly inhibited the PI-PLCγ-mediated Ca2+ mobilization response to TCR activation. However, 10 μm U73122 produced no obvious attenuation of the caspase-independent ATP release induced by co-treatment with STS + Z-VAD (Fig. 8E). Additionally, this PLC inhibitor had no effect on the caspase-sensitive accumulation of summed ANex observed in STS-treated Jurkat cells (Fig. 8F).
FIGURE 8.

Caspase-insensitive ATP release stimulated by staurosporine does not involve direct Ca2+ mobilization by staurosporine or activation of PI-PLC signaling. A–D, Jurkat cells loaded with fluo-4 Ca2+ indicator dye were assayed for changes in cytosolic [Ca2+] as described under “Experimental Procedures.” Each trace is representative of 2–5 similar test recordings from three separate batches of fluo-4-loaded cells. Where indicated in A and in all traces of B–D, the fluo-4 fluorescence signals (RFU) were assayed in the presence of 2.5 mm probenecid (prob). A and B, Ca2+ measurements were terminated by addition of Triton X-100 to release dye from all cells followed by addition of excess EGTA to indicate background Ca2+-independent fluorescence. Positive control stimuli for increasing cytosolic [Ca2+] included 10 μm ionomycin (A and B) and 1 μg/ml anti-CD3 TCR-activating antibody (B–D). D, indicated wells of Jurkat cell suspension were supplemented with 5, 10, or 20 μm U73122 PI-PLC inhibitor 15 min before stimulation with anti-CD3. E and F, Jurkat T cells were incubated with no stimulus or with 3 μm STS for 8 h in the absence or presence of 100 μm Z-VAD, 10 μm U73122, or both inhibitors. Samples of the extracellular media were processed for analysis of ATP only (E) or summed ATP + ADP + AMP (F). Data indicate mean ± S.E. for n = 6 wells from two experiments; ns, p > 0.05; ***, p < 0.001.
Proteosome Inhibitors Induce Caspase-3 Gating of Panx1 Channels and ATP Release
As indicated in Fig. 2, chemotherapeutic drugs induced a slow decrease in Panx1 levels in the presence of Z-VAD, which prevents caspase-mediated excision ofthe C-terminal inhibitory segment. This suggested that Panx1 channels may be degraded by other mechanisms in cells treated with chemotherapeutic drugs. We investigated possible involvement of the proteasomal pathway by treating Jurkat cells for 12 h with STS, Etop, or Dox in the absence or presence of various combinations of Z-VAD and/or MG132, a proteasome inhibitor. MG132 per se is a potent activator of apoptosis in various tumor cell types, including Jurkat cells (40), and proteasome inhibitors are used clinically as cancer chemotherapeutics (41, 42). MG132 alone induced cleavage of the Panx1 autoinhibitory domain, which was co-temporal with proteolytic processing PARP1 (Fig. 9, A and B). Although Z-VAD markedly attenuated the MG132-induced decrease in full-length (i.e. with the retained autoinhibitory segment) Panx1 levels, the overall expression of intact Panx1 protein remained lower than in control Jurkat cells or cells treated with only Z-VAD. Likewise, the additional presence of MG132 did not prevent the down-regulation of full-length Panx1 protein content observed in cells treated with STS, Etop, or Dox plus Z-VAD (Fig. 9, A and B). This argues against a role for proteasome-mediated degradation of Panx1 channels.
FIGURE 9.

Proteosome inhibition induces caspase-3-mediated cleavage of the pannexin-1 C-terminal autoinhibitory domain and pannexin-1-mediated release of adenine nucleotides. A, Jurkat T cells were treated with no stimulus, 3 μm MG132, 3 μm STS, 20 μm Etop, or 25 μm Dox in the absence or presence of 100 μm Z-VAD or combined 100 μm Z-VAD plus 3 μm MG132 for 12 h. Aliquots were taken for Western blot analysis of Panx1, PARP1, and actin. Panx1 blots are from two separate experiments; PARP and actin blots are representative of both experiments; * indicates nonspecific immunoreactive band. B, densitometric quantification of Panx1 bands in Western blots from A; bands were normalized to the densities of the control cell samples for each experiment. C, Jurkat cells were incubated with no stimulus or 3 μm MG132 in the absence or presence of 100 μm Z-VAD. At the indicated times, samples of the extracellular medium were processed for analysis of summed ATP + ADP + AMP. Data indicate mean ± S.E. from one experiment performed in triplicate. D, Jurkat T cells were incubated with no stimulus or with 3 μm MG132 for 8 h in the absence or presence of 100 μm Z-VAD or 100 μm CBX. Samples of the extracellular medium were processed for analysis of summed ATP + ADP + AMP. Data indicate mean ± S.E. for n = 3–9 wells from three experiments; ***, p < 0.001. E and F, Jurkat T cells were incubated with no stimulus or with 3 μm MG132 for 8 h in the absence or presence of 100 μm Z-VAD. Samples of the extracellular medium were processed for analysis of YoPro accumulation (in the absence or presence or 100 μm CBX) as described in Fig. 3. E, representative phase-contrast and epifluorescence microscopy images. F, data indicate mean ± S.E. for n = 6 wells from two experiments; ***, p < 0.001.
Consistent with the ability of MG132 to induce caspase-3-mediated cleavage of the Panx1 autoinhibitory domain, MG132-treated Jurkat cells were also characterized by time-dependent and Z-VAD-inhibitable increases in Panx1 channel activity as indicated by release of adenine nucleotides (Fig. 9, C and D) and accumulation of YO-PRO dye (Fig. 9, E and F). Both indices of MG132-stimulated Panx1 activity were also blocked in the presence of CBX.
Panx1 Is More Highly Expressed in Human Leukemic Leukocytes than in Normal Human T Cells
We compared the expression levels of Panx1 protein in Jurkat cells, two other human leukemia cell lines (CEM T lymphoblastic leukemia and THP1 promonocytic leukemia), and normal human blood-derived T lymphoblasts (Fig. 10). Although the Panx1 content of the CEM and THP1 cells was similar to that in Jurkat cells, the normal T cells expressed an ∼20-fold lower level of Panx1 relative to the leukemia cells. Treatment of the T lymphoblasts with anti-Fas or STS further decreased the immunoreactive Panx1 bands indicating cleavage of the autoinhibitory domain.
FIGURE 10.
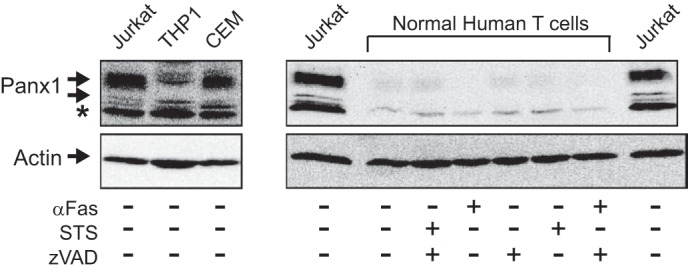
Pannexin-1 is more highly expressed in human leukemic leukocytes than in normal human T cells. Left panel, whole cell lysates from Jurkat T cell lymphocytic leukemia, THP1 promonocytic leukemia, or CEM T cell lymphoblastic leukemia were processed for Western blot analysis of Panx1 and actin; * indicates nonspecific immunoreactive band. Right panel, normal human T lymphoblasts were incubated for 4 h with or without 250 ng/ml anti-Fas or 3 μm STS the absence or presence of 100 μm Z-VAD. The cells were processed for Western blot analysis of Panx1 and actin; aliquots of cell lysates from an equivalent number (106) of Jurkat cells were run on the same gel as positive controls.
DISCUSSION
This study provides several new mechanistic insights regarding the role of Panx1 channels in the release of adenine nucleotides from apoptotic tumor cells. First, our experiments demonstrate that diverse pro-apoptotic chemotherapeutic agents, including topoisomerase II inhibitors, kinase inhibitors, and proteosome inhibitors, induce functional activation of Panx1 channels via caspase-3-mediated cleavage of the Panx1 autoinhibitory C-terminal domain. This observation extends the seminal demonstration by Chekeni et al. (10) regarding the caspase-mediated gating of Panx1 channels during apoptosis initiated by death receptors or UV irradiation. Second, we found that the profile of adenine nucleotide species transported through these caspase-activated channels includes ATP but also its immediate ADP and AMP breakdown products, with these metabolites comprising >90% of the released adenine nucleotide pool that progressively accumulates as cells transition from the early to late stages of apoptosis. Third, other experiments revealed that chemotherapeutic drugs, but not the Fas death receptor, activate an alternative caspase- and Panx1-independent pathway for ATP release from Jurkat leukemic T cells in the context of suppressed caspase activity. Thus, although caspase inhibition represses the ATP export normally mediated by the proteolytically gated Panx1 channels, it facilitates other chemotherapeutic drug-induced signaling pathways that entrain the alternative ATP release mechanism. Finally, comparison of Panx1 levels in different human leukocyte types indicated much higher expression in leukemic cells (lymphoid or myeloid) than in normal, untransformed T lymphoblasts. This suggests that various signaling functions of Panx1 may be amplified in leukemic leukocytes.
Caspase-mediated Gating of Panx1 Channels in Response to Diverse Chemotherapeutic Agents
Anti-Fas and the four different chemotherapeutic drugs (STS, Etop, Dox, and MG132) used in this study initiate and drive apoptotic progression in Jurkat cells with differing and distinctive lag times and rates of activation. This allowed us to establish that the kinetics of Panx1 proteolytic modification and accumulation of functionally active Panx1 channels were precisely correlated with, and limited by, the rates of active caspase-3 accumulation in response to each pro-apoptotic drug. For example, topoisomerase inhibitors, such as Etop or Dox, initially trigger DNA damage, which then drives transcriptional cascades that alter the expression of the various pro- and anti-apoptotic Bcl2 family protein, which ultimately control the rate at which cytochrome c is released from mitochondria to induce caspase-9 apoptosome assembly (43, 44). Accumulation of apoptosome complexes will be rate-limited by the upstream transcriptional cascades for Bcl2 family protein expression and, in turn, will rate-limit activation of the downstream executioner caspases3/7. Integration of the lag times between these multiple steps upstream of caspase-3 activation per se likely underlies the 4-h delay before significant cleavage of the Panx1 autoinhibitory domain is observed in Etop- or Dox-treated Jurkat cells. In contrast, proteolytic excision of the Panx1 autoinhibitory domains with consequent accumulation of active Panx 1 channels was near-maximal within 90 min after addition of STS. This was similar to the kinetics of Panx1 activation by the Fas death receptor that rapidly engages the FADD/caspase-8 cascade to drive accumulation of active caspase-3. This very rapid activation of Panx1 in response to STS is consistent with recent studies in Jurkat cells (43) and mouse embryo fibroblasts (45), which found that STS induced activation of caspase-9 independently of Bcl2 proteins or apoptotosome assembly. This underlies the unusually rapid induction of active caspase-3 and apoptotic progression widely observed in many STS-treated cell types.
We also observed that the chemotherapeutic agents, but not anti-Fas, induced a slow down-regulation of Panx1 protein levels in the presence of Z-VAD. Previous studies have indicated that cell surface Panx1 in healthy cells is a very stable protein characterized by only slow rates of internalization and endosomal trafficking (24, 46–49). However, point mutations, changes in glycosylation status, or disruption of the actin cytoskeleton alter Panx1 trafficking to result in increased intracellular accumulation and lysosomal degradation (24, 48, 49). Given that mutated Panx1 protein is targeted for proteosomal degradation (49), we tested whether the combination of chemotherapeutic drugs plus caspase inhibition might also promote proteosomal clearance of Panx1. However, the additional presence of MG132 did not rescue Panx1 expression levels.
Dynamic Changes in the Profile of Adenine Nucleotide Species Exported via Active Panx1 Channels during Apoptotic Progression
Release of ATP from multiple cell types due to diverse stimuli, such as mechanical stress or osmotic swelling, has been extensively studied (8). Less understood is the release of other major adenine nucleotide species, ADP and AMP, which are maintained at much lower steady-state concentrations in the cytosol of viable cells. Previous studies of Panx1 channels in apoptotic cells have focused on their ability to facilitate the efflux of cytosolic ATP into extracellular compartments and predominantly assayed accumulation of extracellular ATP as the readout of this activity (10, 18). However, apoptosis is an energy-consuming process that will increase the rate of intracellular ATP utilization in cells with a decreased capacity for mitochondrial ATP synthesis due to the changes in mitochondrial function that define the apoptotic phenotype. Even in tumor cells wherein glycolysis, rather than oxidative phosphorylation, may include the major pathway for ATP production, disruption of mitochondrial integrity will perturb the NAD/NADH cycling required for optimal glycolytic metabolism. Thus, apoptotic induction will perturb the steady-state bioenergetic networks that normally maintain high intracellular phosphate potentials ([ATP]/[ADP][phosphate] and [ATP]/[AMP][pyrophosphate]). This perturbation of intracellular adenine nucleotide homeostasis will be exacerbated with apoptotic activation of ATP-permeable Panx1 channels. Previous studies of intracellular ATP homeostasis during apoptosis indicated that ATP levels are maintained at normal levels, or even increase, in some cell types (50–52) but rapidly decrease in other cell models (53, 54). It is interesting to speculate that these cell-specific differences in intracellular ATP levels during apoptotic progress reflect differences in Panx1 expression levels or rates of proteolytic activation. Normal or cancer cell types with high Panx1 expression, such as Jurkat cells, would be characterized by marked decreases in cytosolic ATP defined by the rate of accumulation of active caspase-3. Consistent with this scenario, each chemotherapeutic drug used in our experiments induced a kinetically distinct time course of decreasing intracellular ATP content that was rate-limited by the accumulation of active caspase-3 and markedly delayed by the Z-VAD pan-caspase inhibitor. The decrease in total intracellular ATP was matched by changes in the ratio of intracellular ATP/ADP/AMP during apoptotic progression and correlated with robust extracellular accumulation of the ATP metabolites, ADP and AMP, in addition of ATP per se. Indeed, our data indicate ADP and AMP increasingly include a major fraction of the adenine nucleotide pool released into the extracellular compartment of the Jurkat cells as they transition from the early to the later phases of apoptosis.
Although active Panx1 channels have been best characterized as conduits for the efflux of ATP (and UTP), they likely function as nonselective channels for the release of other small cytosolic metabolites with molecular masses (<600–700 Da) similar to that of ATP (11, 55). In addition to direct release of intracellularly generated ADP and AMP, a fraction of the extracellular ADP and AMP pool will accumulate secondary to the hydrolysis of the directly released ATP pool by cell surface or serum ecto-nucleotidases. Indeed, we observed that the rapid accumulation of ATP in the extracellular medium of Jurkat cells treated with anti-Fas or STS transiently peaked at 4 h and then progressively declined. In contrast to many hematopoietic or nonhematopoietic tumor cell types, Jurkat cells are characterized by an atypically low expression of cell surface CD39 ecto-ATPase/ADPase and no detectable expression of the glycosylphosphatidylinositol-anchored CD73 ecto-AMPase/ecto-5′-nucleotidase (56). Likewise, our experiments utilizing the ARL67156 ecto-ATPase/ADPase inhibitor suggested that only a minor fraction of the extracellular ADP/AMP measured in the conditioned medium of STS-treated Jurkat cells was produced by the extracellular hydrolysis of released ATP. Notably, Yamaguchi et al. (57) recently reported that AMP is the major adenine nucleotide released via Panx1 channels from murine WR-19L lymphoma cells during Fas-induced apoptosis.
Alternative ATP Release Pathway Induced by Chemotherapeutic Drugs in the Context of Suppressed Caspase Activity
We unexpectedly observed that prolonged treatment of Jurkat T cells with staurosporine or etoposide, but not anti-Fas, in the presence of Z-VAD revealed an alternative CBX-insensitive mechanism of ATP release that was induced more slowly than the CBX-sensitive Panx1 channel pathway. Recent studies in Jurkat cells and normal human T cells have indicated that the T cell receptor (TCR) activation triggers a very rapid but transient (within minutes) release of ATP via both Panx1 channel-mediated and exocytotic pathways (33, 58, 59). Both ATP release mechanisms were dependent on the increase in cytosolic [Ca2+] elicited by TCR activation. Notably, the alternative Panx1-independent ATP release response elicited by STS treatment was completely suppressed in BAPTA-loaded Jurkat cells implicating regulation by Ca2+. However in contrast to the TCR-stimulated ATP release, which was partially inhibited in bafilomycin-treated Jurkat cells, we observed no suppressive effect of this V-ATPase inhibitor of the STS + Z-VAD-induced ATP release. This argues against exocytotic mobilization of ATP-containing secretory lysosomes as the mechanism for this response to STS. Likewise, the ability of STS + Z-VAD to trigger robust ATP release in the presence of 3-MA indicated no obvious role for autophagy-based mechanisms. However, experiments using Jurkat cells with knockdown of Atg5 or Atg7 would provide a more rigorous test for involvement of autophagy signaling.
In addition to exocytosis, the Ca2+-dependent, but Panx1-independent, ATP release response to STS + Z-VAD may involve another ATP-permeable channel. For example, the CALHM1 gene product encodes the subunits for an ATP-permeable, but CBX-insensitive, channel with structural features very similar to those of Panx1 (60, 61). Although CALHM1 is mainly expressed in taste-sensing cells (62) and the nervous system (63), five other human CALHM homologues have been reported (64). Additionally, the so-called maxi-anion channels have been reported as a functionally characterized but molecularly undefined efflux pathway in multiple cell types (65–67), including Jurkat cells (59). Future studies should test the possible involvement of other ATP-permeable channels that might be activated in response to chemotherapeutic drugs. Finally, we observed that STS did not directly trigger an acute increase in cytosolic [Ca2+] and that STS + Z-VAD-induced ATP release was not attenuated by inhibition of PI-PLC signaling. These findings argue against feed-forward loops involving release of autocrine mediators, such as bioactive lipids or nucleotides per se, that can activate G protein-coupled receptors and 1,4,5-inositol trisphosphate-mediated Ca2+ mobilization. How chemotherapeutic drugs, such as STS and Etop, may elicit slowly developing increases in cytosolic [Ca2+] in the context of suppressed caspase signaling is another relevant question for investigation.
Elevated Expression of Panx1 Channels in Leukemic Versus Normal Leukocytes
Studies in Jurkat cells and primary mouse thymocytes (from wild type and Panx1−/− mice) have provided most of the current understanding regarding natively expressed Panx1 channels (10, 18). Although apoptosis increased ATP efflux via Panx1 channels both in Jurkat cells and thymocytes, the magnitude of the peak extracellular ATP accumulation response was 5–8-fold greater in the Jurkat cells (9, 10). Although this suggested that leukemic T cells may express higher levels of Panx1 per cell than normal T cells, it is difficult to interpret comparisons between cell types from different species. However, our studies, which directly compared Panx1 protein content in Jurkat and CEM human leukemic T lymphocytes with normal human T lymphoblasts, support this possibility. We have also found that murine EL4/EG7 thymic lymphoma cells express higher levels of Panx1 protein than normal mouse thymocytes (data not shown). It will be relevant to extend such comparisons to a broader range of normal leukocytes (e.g. monocytes and B cells) and their corresponding leukemia/lymphoma variants. Previous studies have suggested that increased Panx1 expression in different hematopoietic tumor models can induce either pro-tumorigenic or anti-tumorigenic effects (68–72). Besides caspase-mediated proteolytic activation, Panx1 channels can be rapidly and reversibly gated by hypoxia, altered tyrosine phosphorylation, and signals driven by several G protein-coupled receptors (11, 17, 73). Thus, release of ATP, ATP metabolites, or arachidonic acid metabolites from Panx1-overexpressing tumor cells into different tumor microenvironments may entrain autocrine and paracrine signaling networks that differentially enhance or suppress tumor growth (74). Subsequent chemotherapy-induced apoptosis of tumor cells would skew these local networks by driving proteolytic gating of Panx1 channels and markedly enhanced extracellular accumulation of ATP and other cell-derived metabolites.
Significance of Panx1-mediated Efflux of ATP and ATP Metabolites from Chemotherapeutic Drug-treated Tumor Cells
Extracellular ATP and ADP, but not AMP, function as agonists for several P2Y and P2X receptor subtypes that activate immune or inflammatory responses (75–77). In contrast, extracellular AMP is rapidly hydrolyzed by CD73 expressed on nearby stromal or recruited immune effector cells to generate adenosine that acts as an agonist for G protein-coupled adenosine receptor subtypes. Activation of A2a or A2b adenosine receptors on effector leukocytes typically (but not always) drives anti-inflammatory or immunosuppressive responses (78–80). Thus, the relative concentrations of ATP versus ADP versus AMP that dynamically accumulate in the extracellular microenvironment of apoptotic tumor cells in vivo can variously skew local immune signaling networks between pro-inflammatory versus anti-inflammatory or immunogenic versus tolerogenic settings with significant consequences on the development of immunogenic anti-tumor responses (81–86). Moreover, most types of tumor cells per se express different cassettes of P2 purinergic or P1 adenosine receptors that can modulate cell growth, survival, and sensitivity to pro-apoptotic mediators. Indeed, the leukemic Jurkat cells used in this study express several ionotropic P2 receptor subtypes, including P2X1, P2X4, and P2X7, and these receptors act as autocrine modulators of TCR signaling pathways that regulate growth and cytokine production (58, 59). It is interesting to speculate whether autocrine activation of these receptors during chemotherapeutic drug-induced Panx1 activation may also modulate apoptotic progression in Jurkat or other leukemic cells. Results from this study highlight the ability of chemotherapeutic drugs to activate cancer cell Panx1 channels as efflux conduits for both pro-inflammatory ATP and the anti-inflammatory precursor AMP. Understanding how different chemotherapies initiate efficacious anti-tumor immune responses may be improved by further analyses of the tumor-specific differences in Panx1 expression levels, drug-induced changes in intracellular adenine nucleotide homeostasis, and the dynamics of extracellular adenine nucleotide metabolism.
Acknowledgments
We thank Dr. Alan Levine for providing normal human T lymphoblasts, Dr. Aaron Weinberg for providing the CEM cell line, and Christina Antonopoulos for performing the Western blot analyses of Panx1 expression in MG132-treated Jurkat cells.
This work was supported, in whole or in part, by National Institutes of Health Grant R01-GM36387 (to G. R. D.). This work was also supported by Canadian Institutes of Health Research MOP130530 (to S. P. and D. W. L.).
- Z
- benzyloxycarbonyl
- CBX
- carbenoxolone
- Dox
- doxorubicin
- STS
- staurosporine
- BafA
- bafilomycin A
- Etop
- etoposide
- PI-PLC
- phosphatidylinositol phospholipase C
- PARP
- poly(ADP-ribose) polymerase
- 3-MA
- 3-methyladenine
- ANex
- extracellular adenine nucleotide
- FLAAM
- Firefly luciferase ATP assay mix
- FLAAB
- Firefly luciferase ATP assay buffer
- TCR
- T cell receptor
- BAPTA
- 1,2-bis(2-aminophenoxy)ethane-N,N,N′,N′-tetraacetic acid
- BSS
- basal salt solution
- ns
- not significant.
REFERENCES
- 1. Ghiringhelli F., Apetoh L., Tesniere A., Aymeric L., Ma Y., Ortiz C., Vermaelen K., Panaretakis T., Mignot G., Ullrich E., Perfettini J. L., Schlemmer F., Tasdemir E., Uhl M., Génin P., Civas A., Ryffel B., Kanellopoulos J., Tschopp J., André F., Lidereau R., McLaughlin N. M., Haynes N. M., Smyth M. J., Kroemer G., Zitvogel L. (2009) Activation of the NLRP3 inflammasome in dendritic cells induces IL-1β-dependent adaptive immunity against tumors. Nat. Med. 15, 1170–1178 [DOI] [PubMed] [Google Scholar]
- 2. Kepp O., Tesniere A., Zitvogel L., Kroemer G. (2009) The immunogenicity of tumor cell death. Curr. Opin. Oncol. 21, 71–76 [DOI] [PubMed] [Google Scholar]
- 3. Zitvogel L., Kepp O., Galluzzi L., Kroemer G. (2012) Inflammasomes in carcinogenesis and anticancer immune responses. Nat. Immunol. 13, 343–351 [DOI] [PubMed] [Google Scholar]
- 4. Martins I., Michaud M., Sukkurwala A. Q., Adjemian S., Ma Y., Shen S., Kepp O., Menger L., Vacchelli E., Galluzzi L., Zitvogel L., Kroemer G. (2012) Premortem autophagy determines the immunogenicity of chemotherapy-induced cancer cell death. Autophagy 8, 413–415 [DOI] [PubMed] [Google Scholar]
- 5. Michaud M., Martins I., Sukkurwala A. Q., Adjemian S., Ma Y., Pellegatti P., Shen S., Kepp O., Scoazec M., Mignot G., Rello-Varona S., Tailler M., Menger L., Vacchelli E., Galluzzi L., Ghiringhelli F., di Virgilio F., Zitvogel L., Kroemer G. (2011) Autophagy-dependent anticancer immune responses induced by chemotherapeutic agents in mice. Science 334, 1573–1577 [DOI] [PubMed] [Google Scholar]
- 6. Ma Y., Adjemian S., Mattarollo S. R., Yamazaki T., Aymeric L., Yang H., Portela Catani J. P., Hannani D., Duret H., Steegh K., Martins I., Schlemmer F., Michaud M., Kepp O., Sukkurwala A. Q., Menger L., Vacchelli E., Droin N., Galluzzi L., Krzysiek R., Gordon S., Taylor P. R., Van Endert P., Solary E., Smyth M. J., Zitvogel L., Kroemer G. (2013) Anticancer chemotherapy-induced intratumoral recruitment and differentiation of antigen-presenting cells. Immunity 38, 729–741 [DOI] [PubMed] [Google Scholar]
- 7. Lazarowski E. R., Boucher R. C., Harden T. K. (2003) Mechanisms of release of nucleotides and integration of their action as P2X- and P2Y-receptor activating molecules. Mol. Pharmacol. 64, 785–795 [DOI] [PubMed] [Google Scholar]
- 8. Lazarowski E. R. (2012) Vesicular and conductive mechanisms of nucleotide release. Purinergic Signal. 8, 359–373 [DOI] [PMC free article] [PubMed] [Google Scholar]
- 9. Elliott M. R., Chekeni F. B., Trampont P. C., Lazarowski E. R., Kadl A., Walk S. F., Park D., Woodson R. I., Ostankovich M., Sharma P., Lysiak J. J., Harden T. K., Leitinger N., Ravichandran K. S. (2009) Nucleotides released by apoptotic cells act as a find-me signal to promote phagocytic clearance. Nature 461, 282–286 [DOI] [PMC free article] [PubMed] [Google Scholar]
- 10. Chekeni F. B., Elliott M. R., Sandilos J. K., Walk S. F., Kinchen J. M., Lazarowski E. R., Armstrong A. J., Penuela S., Laird D. W., Salvesen G. S., Isakson B. E., Bayliss D. A., Ravichandran K. S. (2010) Pannexin 1 channels mediate 'find-me' signal release and membrane permeability during apoptosis. Nature 467, 863–867 [DOI] [PMC free article] [PubMed] [Google Scholar]
- 11. Penuela S., Gehi R., Laird D. W. (2013) The biochemistry and function of pannexin channels. Biochim. Biophys. Acta 1828, 15–22 [DOI] [PubMed] [Google Scholar]
- 12. Wang J., Dahl G. (2010) SCAM analysis of Panx1 suggests a peculiar pore structure. J. Gen. Physiol. 136, 515–527 [DOI] [PMC free article] [PubMed] [Google Scholar]
- 13. Sandilos J. K., Chiu Y. H., Chekeni F. B., Armstrong A. J., Walk S. F., Ravichandran K. S., Bayliss D. A. (2012) Pannexin 1, an ATP release channel, is activated by caspase cleavage of its pore-associated C-terminal autoinhibitory region. J. Biol. Chem. 287, 11303–11311 [DOI] [PMC free article] [PubMed] [Google Scholar]
- 14. Dourado M., Wong E., Hackos D. H. (2014) Pannexin-1 is blocked by its C terminus through a delocalized non-specific interaction surface. PLoS One 9, e99596. [DOI] [PMC free article] [PubMed] [Google Scholar]
- 15. Ma W., Compan V., Zheng W., Martin E., North R. A., Verkhratsky A., Surprenant A. (2012) Pannexin 1 forms an anion-selective channel. Pflugers Arch. 463, 585–592 [DOI] [PubMed] [Google Scholar]
- 16. Romanov R. A., Bystrova M. F., Rogachevskaya O. A., Sadovnikov V. B., Shestopalov V. I., Kolesnikov S. S. (2012) The ATP permeability of pannexin 1 channels in a heterologous system and in mammalian taste cells is dispensable. J. Cell Sci. 125, 5514–5523 [DOI] [PMC free article] [PubMed] [Google Scholar]
- 17. Sandilos J. K., Bayliss D. A. (2012) Physiological mechanisms for the modulation of pannexin 1 channel activity. J. Physiol. 590, 6257–6266 [DOI] [PMC free article] [PubMed] [Google Scholar]
- 18. Qu Y., Misaghi S., Newton K., Gilmour L. L., Louie S., Cupp J. E., Dubyak G. R., Hackos D., Dixit V. M. (2011) Pannexin-1 is required for ATP release during apoptosis but not for inflammasome activation. J. Immunol. 186, 6553–6561 [DOI] [PubMed] [Google Scholar]
- 19. Poon I. K., Chiu Y. H., Armstrong A. J., Kinchen J. M., Juncadella I. J., Bayliss D. A., Ravichandran K. S. (2014) Unexpected link between an antibiotic, pannexin channels and apoptosis. Nature 507, 329–334 [DOI] [PMC free article] [PubMed] [Google Scholar]
- 20. Martins I., Tesniere A., Kepp O., Michaud M., Schlemmer F., Senovilla L., Séror C., Métivier D., Perfettini J. L., Zitvogel L., Kroemer G. (2009) Chemotherapy induces ATP release from tumor cells. Cell cycle 8, 3723–3728 [DOI] [PubMed] [Google Scholar]
- 21. Martins I., Wang Y., Michaud M., Ma Y., Sukkurwala A. Q., Shen S., Kepp O., Métivier D., Galluzzi L., Perfettini J. L., Zitvogel L., Kroemer G. (2014) Molecular mechanisms of ATP secretion during immunogenic cell death. Cell Death Differ. 21, 79–91 [DOI] [PMC free article] [PubMed] [Google Scholar]
- 22. Wang Y., Martins I., Ma Y., Kepp O., Galluzzi L., Kroemer G. (2013) Autophagy-dependent ATP release from dying cells via lysosomal exocytosis. Autophagy 9, 1624–1625 [DOI] [PubMed] [Google Scholar]
- 23. Franko J. L., Levine A. D. (2009) Antigen-independent adhesion and cell spreading by inducible costimulator engagement inhibits T cell migration in a PI-3K-dependent manner. J. Leukocyte Biol. 85, 526–538 [DOI] [PMC free article] [PubMed] [Google Scholar]
- 24. Penuela S., Bhalla R., Gong X. Q., Cowan K. N., Celetti S. J., Cowan B. J., Bai D., Shao Q., Laird D. W. (2007) Pannexin 1 and pannexin 3 are glycoproteins that exhibit many distinct characteristics from the connexin family of gap junction proteins. J. Cell Sci. 120, 3772–3783 [DOI] [PubMed] [Google Scholar]
- 25. Hampp R. (1985) in Methods of Enzymatic Analysis (Bergmeyer H. U., ed) p. 370, 3rd Ed., Verlag Chemie, Weinheim [Google Scholar]
- 26. Qu Y., Dubyak G. R. (2009) P2X7 receptors regulate multiple types of membrane trafficking responses and non-classical secretion pathways. Purinergic Signal. 5, 163–173 [DOI] [PMC free article] [PubMed] [Google Scholar]
- 27. Penuela S., Bhalla R., Nag K., Laird D. W. (2009) Glycosylation regulates pannexin intermixing and cellular localization. Mol. Biol. Cell 20, 4313–4323 [DOI] [PMC free article] [PubMed] [Google Scholar]
- 28. Qiu F., Dahl G. (2009) A permeant regulating its permeation pore: inhibition of pannexin 1 channels by ATP. Am. J. Physiol. Cell Physiol. 296, C250–C255 [DOI] [PMC free article] [PubMed] [Google Scholar]
- 29. Lévesque S. A., Lavoie E. G., Lecka J., Bigonnesse F., Sévigny J. (2007) Specificity of the ecto-ATPase inhibitor ARL 67156 on human and mouse ectonucleotidases. Br. J. Pharmacol. 152, 141–150 [DOI] [PMC free article] [PubMed] [Google Scholar]
- 30. Bao L., Locovei S., Dahl G. (2004) Pannexin membrane channels are mechanosensitive conduits for ATP. FEBS Lett. 572, 65–68 [DOI] [PubMed] [Google Scholar]
- 31. Locovei S., Bao L., Dahl G. (2006) Pannexin 1 in erythrocytes: function without a gap. Proc. Natl. Acad. Sci. U.S.A. 103, 7655–7659 [DOI] [PMC free article] [PubMed] [Google Scholar]
- 32. Zhang Z., Chen G., Zhou W., Song A., Xu T., Luo Q., Wang W., Gu X. S., Duan S. (2007) Regulated ATP release from astrocytes through lysosome exocytosis. Nat. Cell Biol. 9, 945–953 [DOI] [PubMed] [Google Scholar]
- 33. Tokunaga A., Tsukimoto M., Harada H., Moriyama Y., Kojima S. (2010) Involvement of SLC17A9-dependent vesicular exocytosis in the mechanism of ATP release during T cell activation. J. Biol. Chem. 285, 17406–17416 [DOI] [PMC free article] [PubMed] [Google Scholar]
- 34. Sivaramakrishnan V., Bidula S., Campwala H., Katikaneni D., Fountain S. J. (2012) Constitutive lysosome exocytosis releases ATP and engages P2Y receptors in human monocytes. J. Cell Sci. 125, 4567–4575 [DOI] [PubMed] [Google Scholar]
- 35. Sawada K., Echigo N., Juge N., Miyaji T., Otsuka M., Omote H., Yamamoto A., Moriyama Y. (2008) Identification of a vesicular nucleotide transporter. Proc. Natl. Acad. Sci. U.S.A. 105, 5683–5686 [DOI] [PMC free article] [PubMed] [Google Scholar]
- 36. Petiot A., Ogier-Denis E., Blommaart E. F., Meijer A. J., Codogno P. (2000) Distinct classes of phosphatidylinositol 3′-kinases are involved in signaling pathways that control macroautophagy in HT-29 cells. J. Biol. Chem. 275, 992–998 [DOI] [PubMed] [Google Scholar]
- 37. Wu Y. T., Tan H. L., Shui G., Bauvy C., Huang Q., Wenk M. R., Ong C. N., Codogno P., Shen H. M. (2010) Dual role of 3-methyladenine in modulation of autophagy via different temporal patterns of inhibition on class I and III phosphoinositide 3-kinase. J. Biol. Chem. 285, 10850–10861 [DOI] [PMC free article] [PubMed] [Google Scholar]
- 38. Katagiri K., Shimonaka M., Kinashi T. (2004) Rap1-mediated lymphocyte function-associated antigen-1 activation by the T cell antigen receptor is dependent on phospholipase C-γ1. J. Biol. Chem. 279, 11875–11881 [DOI] [PubMed] [Google Scholar]
- 39. An S., Bleu T., Zheng Y. (1999) Transduction of intracellular calcium signals through G protein-mediated activation of phospholipase C by recombinant sphingosine 1-phosphate receptors. Mol. Pharmacol. 55, 787–794 [PubMed] [Google Scholar]
- 40. Park H. S., Jun do Y., Han C. R., Woo H. J., Kim Y. H. (2011) Proteasome inhibitor MG132-induced apoptosis via ER stress-mediated apoptotic pathway and its potentiation by protein tyrosine kinase p56lck in human Jurkat T cells. Biochem. Pharmacol. 82, 1110–1125 [DOI] [PubMed] [Google Scholar]
- 41. Bassermann F., Eichner R., Pagano M. (2014) The ubiquitin proteasome system–implications for cell cycle control and the targeted treatment of cancer. Biochim. Biophys. Acta 1843, 150–162 [DOI] [PMC free article] [PubMed] [Google Scholar]
- 42. Suh K. S., Tanaka T., Sarojini S., Nightingale G., Gharbaran R., Pecora A., Goy A. (2013) The role of the ubiquitin proteasome system in lymphoma. Crit. Rev. Oncol. Hematol. 87, 306–322 [DOI] [PubMed] [Google Scholar]
- 43. Manns J., Daubrawa M., Driessen S., Paasch F., Hoffmann N., Löffler A., Lauber K., Dieterle A., Alers S., Iftner T., Schulze-Osthoff K., Stork B., Wesselborg S. (2011) Triggering of a novel intrinsic apoptosis pathway by the kinase inhibitor staurosporine: activation of caspase-9 in the absence of Apaf-1. FASEB J. 25, 3250–3261 [DOI] [PubMed] [Google Scholar]
- 44. Ferrari D., Stepczynska A., Los M., Wesselborg S., Schulze-Osthoff K. (1998) Differential regulation and ATP requirement for caspase-8 and caspase-3 activation during CD95- and anticancer drug-induced apoptosis. J. Exp. Med. 188, 979–984 [DOI] [PMC free article] [PubMed] [Google Scholar]
- 45. Imao T., Nagata S. (2013) Apaf-1- and caspase-8-independent apoptosis. Cell Death Differ. 20, 343–352 [DOI] [PMC free article] [PubMed] [Google Scholar]
- 46. Ambrosi C., Gassmann O., Pranskevich J. N., Boassa D., Smock A., Wang J., Dahl G., Steinem C., Sosinsky G. E. (2010) Pannexin1 and Pannexin2 channels show quaternary similarities to connexons and different oligomerization numbers from each other. J. Biol. Chem. 285, 24420–24431 [DOI] [PMC free article] [PubMed] [Google Scholar]
- 47. Boassa D., Qiu F., Dahl G., Sosinsky G. (2008) Trafficking dynamics of glycosylated pannexin 1 proteins. Cell Commun. Adhes. 15, 119–132 [DOI] [PMC free article] [PubMed] [Google Scholar]
- 48. Bhalla-Gehi R., Penuela S., Churko J. M., Shao Q., Laird D. W. (2010) Pannexin1 and pannexin3 delivery, cell surface dynamics, and cytoskeletal interactions. J. Biol. Chem. 285, 9147–9160 [DOI] [PMC free article] [PubMed] [Google Scholar]
- 49. Gehi R., Shao Q., Laird D. W. (2011) Pathways regulating the trafficking and turnover of pannexin1 protein and the role of the C-terminal domain. J. Biol. Chem. 286, 27639–27653 [DOI] [PMC free article] [PubMed] [Google Scholar]
- 50. Bossy-Wetzel E., Newmeyer D. D., Green D. R. (1998) Mitochondrial cytochrome c release in apoptosis occurs upstream of DEVD-specific caspase activation and independently of mitochondrial transmembrane depolarization. EMBO J. 17, 37–49 [DOI] [PMC free article] [PubMed] [Google Scholar]
- 51. Eguchi Y., Shimizu S., Tsujimoto Y. (1997) Intracellular ATP levels determine cell death fate by apoptosis or necrosis. Cancer Res. 57, 1835–1840 [PubMed] [Google Scholar]
- 52. Zamaraeva M. V., Sabirov R. Z., Maeno E., Ando-Akatsuka Y., Bessonova S. V., Okada Y. (2005) Cells die with increased cytosolic ATP during apoptosis: a bioluminescence study with intracellular luciferase. Cell Death Differ. 12, 1390–1397 [DOI] [PubMed] [Google Scholar]
- 53. Gleiss B., Gogvadze V., Orrenius S., Fadeel B. (2002) Fas-triggered phosphatidylserine exposure is modulated by intracellular ATP. FEBS Lett. 519, 153–158 [DOI] [PubMed] [Google Scholar]
- 54. Vander Heiden M. G., Chandel N. S., Schumacker P. T., Thompson C. B. (1999) Bcl-xL prevents cell death following growth factor withdrawal by facilitating mitochondrial ATP/ADP exchange. Mol. Cell 3, 159–167 [DOI] [PubMed] [Google Scholar]
- 55. Wang N., De Bock M., Decrock E., Bol M., Gadicherla A., Vinken M., Rogiers V., Bukauskas F. F., Bultynck G., Leybaert L. (2013) Paracrine signaling through plasma membrane hemichannels. Biochim. Biophys. Acta 1828, 35–50 [DOI] [PMC free article] [PubMed] [Google Scholar]
- 56. Yegutkin G. G., Henttinen T., Samburski S. S., Spychala J., Jalkanen S. (2002) The evidence for two opposite, ATP-generating and ATP-consuming, extracellular pathways on endothelial and lymphoid cells. Biochem. J. 367, 121–128 [DOI] [PMC free article] [PubMed] [Google Scholar]
- 57. Yamaguchi H., Maruyama T., Urade Y., Nagata S. (2014) Immunosuppression via adenosine receptor activation by adenosine monophosphate released from apoptotic cells. ELIFE 3, e02172. [DOI] [PMC free article] [PubMed] [Google Scholar]
- 58. Woehrle T., Yip L., Elkhal A., Sumi Y., Chen Y., Yao Y., Insel P. A., Junger W. G. (2010) Pannexin-1 hemichannel-mediated ATP release together with P2X1 and P2X4 receptors regulate T-cell activation at the immune synapse. Blood 116, 3475–3484 [DOI] [PMC free article] [PubMed] [Google Scholar]
- 59. Yip L., Woehrle T., Corriden R., Hirsh M., Chen Y., Inoue Y., Ferrari V., Insel P. A., Junger W. G. (2009) Autocrine regulation of T-cell activation by ATP release and P2X7 receptors. FASEB J. 23, 1685–1693 [DOI] [PMC free article] [PubMed] [Google Scholar]
- 60. Siebert A. P., Ma Z., Grevet J. D., Demuro A., Parker I., Foskett J. K. (2013) Structural and functional similarities of calcium homeostasis modulator 1 (CALHM1) ion channel with connexins, pannexins, and innexins. J. Biol. Chem. 288, 6140–6153 [DOI] [PMC free article] [PubMed] [Google Scholar]
- 61. Ma Z., Siebert A. P., Cheung K. H., Lee R. J., Johnson B., Cohen A. S., Vingtdeux V., Marambaud P., Foskett J. K. (2012) Calcium homeostasis modulator 1 (CALHM1) is the pore-forming subunit of an ion channel that mediates extracellular Ca2+ regulation of neuronal excitability. Proc. Natl. Acad. Sci. U.S.A. 109, E1963–E1971 [DOI] [PMC free article] [PubMed] [Google Scholar]
- 62. Taruno A., Vingtdeux V., Ohmoto M., Ma Z., Dvoryanchikov G., Li A., Adrien L., Zhao H., Leung S., Abernethy M., Koppel J., Davies P., Civan M. M., Chaudhari N., Matsumoto I., Hellekant G., Tordoff M. G., Marambaud P., Foskett J. K. (2013) CALHM1 ion channel mediates purinergic neurotransmission of sweet, bitter and umami tastes. Nature 495, 223–226 [DOI] [PMC free article] [PubMed] [Google Scholar]
- 63. Green K. N., LaFerla F. M. (2008) Linking calcium to Aβ and Alzheimer's disease. Neuron 59, 190–194 [DOI] [PubMed] [Google Scholar]
- 64. Dreses-Werringloer U., Lambert J. C., Vingtdeux V., Zhao H., Vais H., Siebert A., Jain A., Koppel J., Rovelet-Lecrux A., Hannequin D., Pasquier F., Galimberti D., Scarpini E., Mann D., Lendon C., Campion D., Amouyel P., Davies P., Foskett J. K., Campagne F., Marambaud P. (2008) A polymorphism in CALHM1 influences Ca2+ homeostasis, Aβ levels, and Alzheimer's disease risk. Cell 133, 1149–1161 [DOI] [PMC free article] [PubMed] [Google Scholar]
- 65. Dubyak G. R. (2012) Function without form: an ongoing search for maxi-anion channel proteins. Focus on “Maxi-anion channel and pannexin 1 hemichannel constitute separate pathways for swelling-induced ATP release in murine L929 fibrosarcoma cells”. Am. J. Physiol. Cell Physiol. 303, C913–C915 [DOI] [PMC free article] [PubMed] [Google Scholar]
- 66. Islam M. R., Uramoto H., Okada T., Sabirov R. Z., Okada Y. (2012) Maxi-anion channel and pannexin 1 hemichannel constitute separate pathways for swelling-induced ATP release in murine L929 fibrosarcoma cells. Am. J. Physiol. Cell Physiol. 303, C924–C935 [DOI] [PubMed] [Google Scholar]
- 67. Sabirov R. Z., Okada Y. (2005) ATP release via anion channels. Purinergic Signal. 1, 311–328 [DOI] [PMC free article] [PubMed] [Google Scholar]
- 68. Bao B. A., Lai C. P., Naus C. C., Morgan J. R. (2012) Pannexin1 drives multicellular aggregate compaction via a signaling cascade that remodels the actin cytoskeleton. J. Biol. Chem. 287, 8407–8416 [DOI] [PMC free article] [PubMed] [Google Scholar]
- 69. Celetti S. J., Cowan K. N., Penuela S., Shao Q., Churko J., Laird D. W. (2010) Implications of pannexin 1 and pannexin 3 for keratinocyte differentiation. J. Cell Sci. 123, 1363–1372 [DOI] [PubMed] [Google Scholar]
- 70. Lai C. P., Bechberger J. F., Thompson R. J., MacVicar B. A., Bruzzone R., Naus C. C. (2007) Tumor-suppressive effects of pannexin 1 in C6 glioma cells. Cancer Res. 67, 1545–1554 [DOI] [PubMed] [Google Scholar]
- 71. Litvin O., Tiunova A., Connell-Alberts Y., Panchin Y., Baranova A. (2006) What is hidden in the pannexin treasure trove: the sneak peek and the guesswork. J. Cell. Mol. Med. 10, 613–634 [DOI] [PMC free article] [PubMed] [Google Scholar]
- 72. Penuela S., Gyenis L., Ablack A., Churko J. M., Berger A. C., Litchfield D. W., Lewis J. D., Laird D. W. (2012) Loss of pannexin 1 attenuates melanoma progression by reversion to a melanocytic phenotype. J. Biol. Chem. 287, 29184–29193 [DOI] [PMC free article] [PubMed] [Google Scholar]
- 73. Chiu Y. H., Ravichandran K. S., Bayliss D. A. (2014) Intrinsic properties and regulation of pannexin 1 channel. Channels 8, 103–109 [DOI] [PMC free article] [PubMed] [Google Scholar]
- 74. Adamson S. E., Leitinger N. (2014) The role of pannexin1 in the induction and resolution of inflammation. FEBS Lett. 588, 1416–1422 [DOI] [PMC free article] [PubMed] [Google Scholar]
- 75. Dubyak G. R. (2000) Purinergic signaling at immunological synapses. J. Auton. Nerv. Syst. 81, 64–68 [DOI] [PubMed] [Google Scholar]
- 76. Dubyak G. R. (2012) P2X7 receptor regulation of non-classical secretion from immune effector cells. Cell. Microbiol. 14, 1697–1706 [DOI] [PMC free article] [PubMed] [Google Scholar]
- 77. Junger W. G. (2011) Immune cell regulation by autocrine purinergic signalling. Nat. Rev. Immunol. 11, 201–212 [DOI] [PMC free article] [PubMed] [Google Scholar]
- 78. Haskó G., Csóka B., Németh Z. H., Vizi E. S., Pacher P. (2009) A(2B) adenosine receptors in immunity and inflammation. Trends Immunol. 30, 263–270 [DOI] [PMC free article] [PubMed] [Google Scholar]
- 79. Köröskényi K., Duró E., Pallai A., Sarang Z., Kloor D., Ucker D. S., Beceiro S., Castrillo A., Chawla A., Ledent C. A., Fésüs L., Szondy Z. (2011) Involvement of adenosine A2A receptors in engulfment-dependent apoptotic cell suppression of inflammation. J. Immunol. 186, 7144–7155 [DOI] [PMC free article] [PubMed] [Google Scholar]
- 80. Csóka B., Selmeczy Z., Koscsó B., Németh Z. H., Pacher P., Murray P. J., Kepka-Lenhart D., Morris S. M., Jr., Gause W. C., Leibovich S. J., Haskó G. (2012) Adenosine promotes alternative macrophage activation via A2A and A2B receptors. FASEB J. 26, 376–386 [DOI] [PMC free article] [PubMed] [Google Scholar]
- 81. Yegutkin G. G., Marttila-Ichihara F., Karikoski M., Niemelä J., Laurila J. P., Elima K., Jalkanen S., Salmi M. (2011) Altered purinergic signaling in CD73-deficient mice inhibits tumor progression. Eur. J. Immunol. 41, 1231–1241 [DOI] [PubMed] [Google Scholar]
- 82. Stagg J., Divisekera U., McLaughlin N., Sharkey J., Pommey S., Denoyer D., Dwyer K. M., Smyth M. J. (2010) Anti-CD73 antibody therapy inhibits breast tumor growth and metastasis. Proc. Natl. Acad. Sci. U.S.A. 107, 1547–1552 [DOI] [PMC free article] [PubMed] [Google Scholar]
- 83. Stagg J., Divisekera U., Duret H., Sparwasser T., Teng M. W., Darcy P. K., Smyth M. J. (2011) CD73-deficient mice have increased antitumor immunity and are resistant to experimental metastasis. Cancer Res. 71, 2892–2900 [DOI] [PubMed] [Google Scholar]
- 84. Beavis P. A., Stagg J., Darcy P. K., Smyth M. J. (2012) CD73: a potent suppressor of antitumor immune responses. Trends Immunol. 33, 231–237 [DOI] [PubMed] [Google Scholar]
- 85. Beavis P. A., Divisekera U., Paget C., Chow M. T., John L. B., Devaud C., Dwyer K., Stagg J., Smyth M. J., Darcy P. K. (2013) Blockade of A2A receptors potently suppresses the metastasis of CD73+ tumors. Proc. Natl. Acad. Sci. U.S.A. 110, 14711–14716 [DOI] [PMC free article] [PubMed] [Google Scholar]
- 86. Loi S., Pommey S., Haibe-Kains B., Beavis P. A., Darcy P. K., Smyth M. J., Stagg J. (2013) CD73 promotes anthracycline resistance and poor prognosis in triple negative breast cancer. Proc. Natl. Acad. Sci. U.S.A. 110, 11091–11096 [DOI] [PMC free article] [PubMed] [Google Scholar]