Background: Ultrasonication effectively breaks supersaturation and forces amyloid fibrillation.
Results: A high-throughput analysis of amyloid fibrillation showed that, although the lag time varied depending on the conditions, its coefficient of variation was constant.
Conclusion: The large fluctuation in the lag time originates from a process associated with a common amyloidogenic intermediate.
Significance: High-throughput analysis is powerful enough to clarify the mechanisms of supersaturation-limited phase transitions of proteins.
Keywords: Amyloid, Fluorescence, High-throughput Screening (HTS), Protein Aggregation, Protein Misfolding, Supersaturation, Ultrasonication
Abstract
Amyloid fibrils form in supersaturated solutions of precursor proteins by a nucleation and growth mechanism characterized by a lag time. Although the lag time provides a clue to understanding the complexity of nucleation events, its long period and low reproducibility have been obstacles for exact analysis. Ultrasonication is known to effectively break supersaturation and force fibrillation. By constructing a Handai amyloid burst inducer, which combines a water bath-type ultrasonicator and a microplate reader, we examined the ultrasonication-forced fibrillation of several proteins, with a focus on the fluctuation in the lag time. Amyloid fibrillation of hen egg white lysozyme was examined at pH 2.0 in the presence of 1.0–5.0 M guanidine hydrochloride (GdnHCl), in which the dominant species varied from the native to denatured conformations. Although fibrillation occurred at various concentrations of GdnHCl, the lag time varied largely, with a minimum being observed at ∼3.0 m, the concentration at which GdnHCl-dependent denaturation ended. The coefficient of variation of the lag time did not depend significantly on the GdnHCl concentration and was 2-fold larger than that of the ultrasonication-dependent oxidation of iodide, a simple model reaction. These results suggest that the large fluctuation observed in the lag time for amyloid fibrillation originated from a process associated with a common amyloidogenic intermediate, which may have been a relatively compact denatured conformation. We also suggest that the Handai amyloid burst inducer system will be useful for studying the mechanism of crystallization of proteins because proteins form crystals by the same mechanism as amyloid fibrils under supersaturation.
Introduction
Of the various types of protein aggregates, amyloid fibrils, which are associated with >20 types of amyloidoses, have been the target of recent protein science investigations (1–4). Amyloid fibrils are fibrillar aggregates with a width of 10 nm and a length of several micrometers. The dominant secondary structure is a cross-β-structure stabilized by an ordered hydrogen bond network. Previous studies proposed that amyloid fibrils may form in supersaturated solutions of precursor proteins by a nucleation and growth mechanism characterized by a lag phase (5–7). Because amyloid fibrillation is a nucleation-dependent reaction, preformed fibrils act as seeds, i.e. fragmented fibrils effectively escape the high free energy barrier of nucleation, resulting in the immediate growth of seed fibrils (5–9). We revisited “supersaturation” and argued its critical involvement in amyloid fibrillation (10–12). The role of supersaturation at the proteome level in neurodegenerative diseases has recently been reported (13).
One of the most important parameters for characterizing amyloid fibrillation is the lag time, during which no fibrils are detected (6, 7, 14, 15). Because the lag time provides a clue to understanding the complexity of nucleation events, numerous experiments have been performed to reveal the relationship between the lag time and various factors determining fibrillation. However, the lag time varies from minutes to months depending on the conditions, and the reproducibility among samples is low in general, making exact analysis difficult. To characterize the kinetics of amyloid fibrillation, including the lag time, a high-throughput analysis using microplates combined with accelerated fibrillation has been suggested (16, 17).
Various kinds of agitation such as shaking (16), stirring (17), and ultrasonic irradiation (10, 18–21) have been shown to effectively force spontaneous fibrillation under conditions in which no fibrillation would ever occur because of the persistent metastability of supersaturation. Ultrasonication was originally used in studies examining amyloid fibrils to fragment preformed long fibrils into shorter fibrils (8, 19, 22, 23) by taking advantage of the strong shearing forces produced by the repeated growth and collapse of cavitation bubbles (24, 25). The ends of fibrils act as the templates of subsequent growth; therefore, ultrasonic treatments effectively maximize the seeding potential of preformed fibrils. The same effects have also been applied to the amplification of infectious prion proteins (26, 27). In the case of ultrasonication-forced fibrillation, we suggested that interactions with the hydrophobic surfaces of cavitation bubbles may locally condense proteins, leading to the breakdown of supersaturation and ultimately to fibrillation (10). Ultrasonication is now recognized as one of the important approaches to elucidate the mechanisms underlying amyloid fibrillation and also to experimentally accelerate otherwise time-consuming spontaneous fibrillation (21, 22, 28). These properties of amyloid fibrillation are essentially the same as those for the crystallization of substances including native proteins (29–31). We demonstrated previously that ultrasonication is an efficient agitation to induce protein crystallization (11).
In contrast, a microplate reader with a 96-well plate has been routinely used to make simultaneous measurements of many samples (16, 17). We suggested that the use of a microplate reader combined with an ultrasonicator may be an efficient approach to perform a high-throughput assay of amyloid fibrillation and protein crystallization (11, 20). Here, we constructed an instrument, a Handai amyloid burst inducer (HANABI),4 with which the ultrasonication-forced fibrillation of proteins can be automatically and rapidly analyzed.
To obtain further insights into the mechanism of amyloid fibrillation, we performed a series of experiments using the HANABI system, with a focus on the fluctuation in the lag time. Most important, using hen egg white lysozyme, we studied the dependence of the lag time on the initial conformational states. Although the lag time varied largely depending on the guanidine hydrochloride (GdnHCl) concentration, the degree of relative variation (i.e. coefficient of variation) did not depend on the GdnHCl concentration, suggesting that the large fluctuation originates from a process associated with a common amyloidogenic intermediate. We also show that the controlled crystallization of hen egg lysozyme could be monitored by installing a camera in the HANABI system. The results indicate that the HANABI system can be used to clarify the underlying mechanisms responsible for the supersaturation-limited phase transitions of proteins.
EXPERIMENTAL PROCEDURES
Proteins and Chemicals
Lysozyme chloride from hen egg white was purchased from Nacalai Tesque (Kyoto, Japan) and used without further purification. Lyophilized amyloid-β peptide-(1–40) (Aβ(1–40)), which was purchased from Peptide Institute, Inc. (Osaka, Japan), was dissolved in a 0.05% (w/w) ammonia solution at a concentration of 500 μm and stored at −80 °C. Recombinant human insulin (Roche Diagnostics) was purchased from Nacalai Tesque and used without further purification. Recombinant human β2-microglobulin was produced with an Escherichia coli expression system as described previously (32). Thioflavin T (ThT) was obtained from Wako Pure Chemical Industries Ltd. (Osaka, Japan). All other reagents were purchased from Nacalai Tesque.
Forced Amyloid Fibrillation and Crystallization with HANABI
The HANABI system, in which a microplate reader was combined with a water bath-type ultrasonicator (see Fig. 1), was used to induce amyloid fibril formation. Lysozyme was typically dissolved in a 3.2 mm HCl solution containing various concentrations of GdnHCl to yield a lysozyme concentration of 5.0 mg/ml. ThT was added to the samples at a final concentration of 5.0 μm. Amyloid fibrillation was assayed by a significant enhancement in ThT fluorescence. The excitation and emission wavelengths were 455 and 485 nm, respectively, and were set with diffraction gratings. Reaction mixtures in 96 wells of a microplate were ultrasonicated from three directions (i.e. two sides and the bottom) for 3 min and then incubated under quiescence for 7 min. This process was repeated during incubation at 37 °C. The volume of the water bath was ∼14 liters.
FIGURE 1.
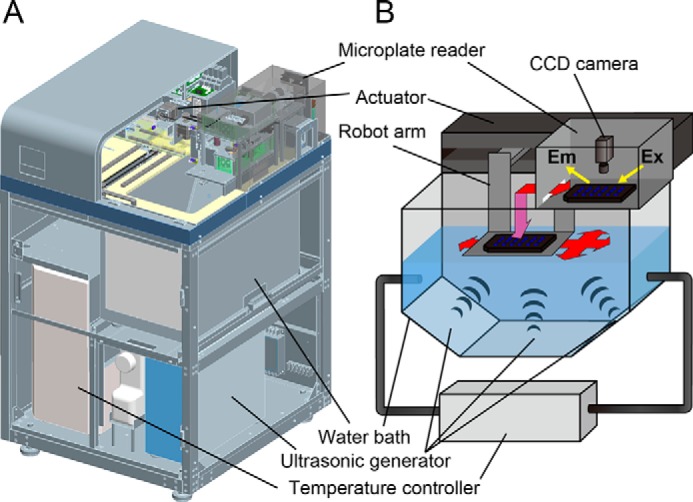
Overview (A) and schematic illustration (B) of the HANABI system. HANABI combines a water bath-type ultrasonicator and a fluorescence microplate reader.
To form lysozyme crystals, lysozyme was dissolved at a concentration of 20 mg/ml in 50 mm sodium acetate (pH 4.8) containing 1.0 m NaCl. The native lysozymes in the wells of the microplate were ultrasonicated for various periods, and crystal formation was directly monitored by a CCD camera installed in the HANABI system at the position of the microplate reader.
Transmission Electron Microscopy and Atomic Force Microscopy
Fibrils were diluted 10-fold and immediately placed on a 400-mesh carbon-coated copper grid (Nissin EM, Tokyo, Japan) for transmission electron microscopy (TEM) or on a freshly cleaved mica-covered metal plate for atomic force microscopy (AFM). For TEM measurements, adsorbed fibrils on the grid were negatively stained with a 2% (w/v) uranyl acetate solution. Electron micrographs were acquired using a Hitachi H-7650 transmission electron microscope at 80 kV. AFM images were obtained using a Digital Instruments NanoScope IIIa microscope in tapping mode with an Olympus AC160TS-R3 microcantilever.
Circular Dichroism Measurements
Far-UV CD spectra were measured with a Jasco 710 CD spectrophotometer as described previously (18). Measurements were performed at 0.1 mg/ml lysozyme and 25 °C using a quartz cuvette with a 1-mm path length, and the results are expressed as mean residue ellipticity (θ).
RESULTS
HANABI Construction and Potassium Iodide Oxidation
Although we previously used a 96-well microplate for simultaneous assays of ultrasonication-forced fibrillation, the microplate was moved manually after each ultrasonic irradiation from the ultrasonicator to the microplate reader (20). With the HANABI system, ultrasonic irradiation was performed in a water bath, the plate was then moved to the microplate reader, and ThT fluorescence was monitored; these three processes were repeated automatically under programmed time schedules (Fig. 1). Moreover, the plate was moved in the x-y axes in sequence to ultrasonicate the 96 wells evenly. A typical movement was 5 cm in the x axis, 10 cm in the y axis, −5 cm in the x axis, and −10 cm in the y axis in sequence.
We examined the effects of plate movements by monitoring the oxidation of potassium iodide (KI), one of the most conventional ultrasonication-dependent chemical dosimetries used to calibrate ultrasonic power (28, 33). When ultrasound is irradiated into the KI solution, I− ions are oxidized to give diatomic molecules (I2). When excess I− ions are present in solutions, I2 reacts with excess I− ions to form I3− ions. The amount of I3− ions produced after an adequate duration of sonication, which can be estimated by measuring the absorbance of I3− at 355 nm, is regarded as a relative measure of ultrasonic power.
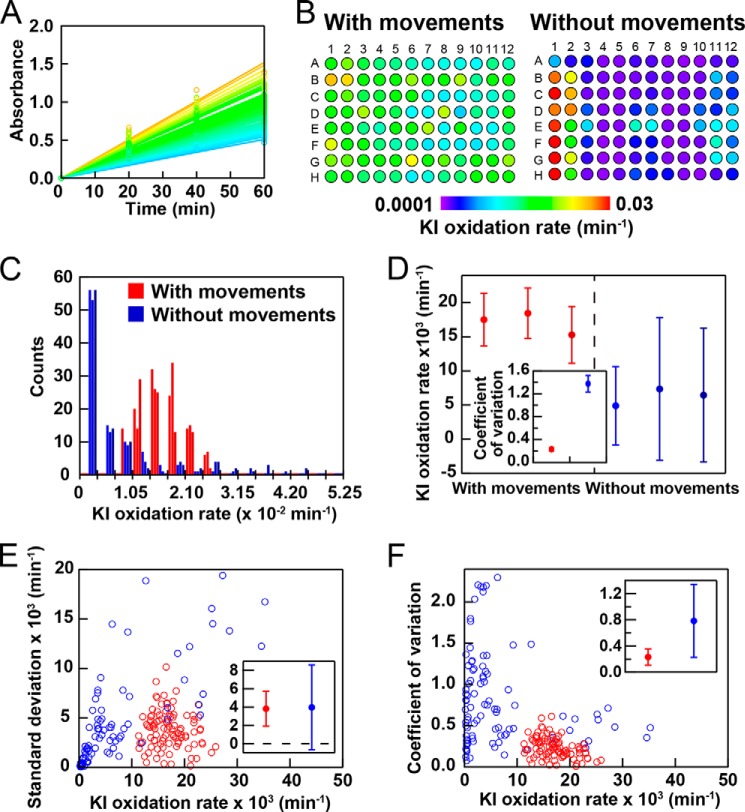
Absorbance was monitored at 355 nm following ultrasonic irradiation every 20 min. Absorbance was measured separately with an SH-9000 microplate reader (Corona Electric Co., Tokyo, Japan). From a linear increase in absorbance, we determined the rate of KI oxidation for each of the 96 wells (Fig. 2A) and represented it schematically on the plate (Fig. 2B).
FIGURE 2.
Ultrasonication-dependent KI oxidation. A, the kinetics of KI oxidation monitored by the absorbance of I3− at 355 nm with plate movements. The temperature of the water bath was controlled at 37 °C. The increase in the absorbance at 355 nm was fit by a straight line to obtain the oxidation rate. B, dependence of the rate of KI oxidation on the location of the well. The reaction was examined in the presence and absence of plate movements. KI oxidation rates are represented by different colors as defined by the color scale bar. C, histograms of the distribution of the KI oxidation rate in the presence and absence of plate movements. The results of three experiments in the presence and absence of plate movements are shown. D, means ± S.D. for the KI oxidation rate with and without plate movements among the 96 wells. The inset shows the average coefficients of variation with S.D. values. E and F, S.D. values (E) and coefficients of variation (F) of the KI oxidation rate in the presence and absence of plate movements among the three experiments for the 96 wells. The insets show the means ± S.D. fof the 96 wells.
Without plate movements, the rate of KI oxidation was slow in many wells and varied significantly depending on the well. These variations were attributed to fluctuations in the ultrasonic power, even though the three ultrasonic transducers were set to maximize the ultrasonic intensity at the location of the plate. Upon moving the microplate to average the ultrasonic energy, the rate increased, and variations in the KI oxidation rate decreased. Because KI oxidation is a simple reaction that is directly proportional to the ultrasonic energy, we assumed that the observed variations in the KI oxidation rate represented the basic performance of the HANABI system based on intrinsic variations in the simple chemical reaction and mechanical instability arising from uneven ultrasonic irradiation.
We repeated ultrasonication-dependent KI oxidation three times in the presence and absence of plate movements. Variations in the oxidation rate were then analyzed in two ways. First, a histogram was plotted for the distribution of this rate in the presence and absence of plate movements (Fig. 2C). The histogram with plate movements showed a Gaussian distribution, whereas that without plate movements had a maximum at the lower rate regions. We obtained the mean ± S.D. and coefficient of variation for the KI oxidation rate in the 96 wells in each of the three experiments in the presence and absence of plate movements (Fig. 2D). Here, the coefficient of variation defined by S.D. divided by the mean indicates a degree of relative variation. The results obtained revealed that plate movements significantly suppressed variations in the rate, giving coefficients of variation in the absence and presence of plate movements of 1.4 and 0.2, respectively (Fig. 2D). The coefficients of variation were constant in the three experiments, suggested that fluctuations between the experiments were minimal.
Alternatively, we obtained the mean ± S.D. of the rates for the three experiments in each of the 96 wells, and the S.D. (Fig. 2E) and coefficient of variation (Fig. 2F) were plotted against the average oxidation rate. Plots were made in both the absence and presence of plate movements. The coefficient of variation with plate movements was relatively independent of the rate of KI oxidation, giving a value of 0.2 (Fig. 2F).
In both analyses, we obtained a value of 0.2 for the coefficient of variation in the presence of plate movements. Thus, we assumed that the value of 0.2 represented the minimal value achieved for a simple reaction largely determined by mechanical instability associated with uneven ultrasonic irradiation.
Performance of HANABI Achieved with Various Proteins
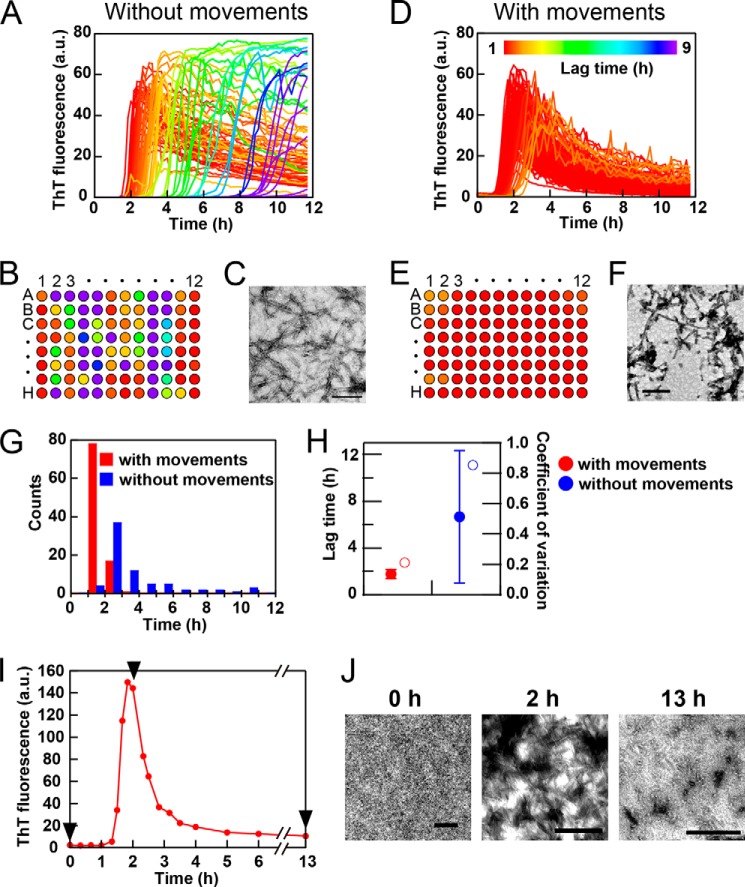
To assess the performance of the HANABI system, we examined the standard amyloid fibrillation of β2-microglobulin, a protein responsible for dialysis-related amyloidosis (8). Previous studies established that ultrasonication effectively accelerates the fibrillation of β2-microglobulin (18–20). Solutions of 0.3 mg/ml β2-microglobulin in 100 mm NaCl (pH 2.5) in 96-well plates were irradiated with cycles of 1 min of ultrasonication and 9 min of quiescence. Although the amyloid burst occurred after a lag time in the absence of plate movements, the lag time varied significantly from 1.5 to 10 h depending on the wells (Fig. 3, A and B). In contrast, plate movements led to synchronized fibril formation with a lag time of 1–1.5 h (Fig. 3, D and E). The formation of fibrils was confirmed by TEM (Fig. 3, C and F). These results are consistent with our previous finding showing that the rotation of a microplate is useful for synchronizing the lag time (20); however, the achievement was markedly better for the current x-y movement.
FIGURE 3.
Performance of HANABI with β2-microglobulin. A microplate with 96 wells containing 0.3 mg/ml β2-microglobulin in 100 mm NaCl and 5 μm ThT at pH 2.5 was ultrasonicated by cycles of 1 min of ultrasonication and 9 min of quiescence with (D–F) and without (A–C) plate movements at 37 °C. Fibrillation kinetics (A and D) monitored by ThT fluorescence at 480 nm and schematic representations of the plates (B and E) are shown by different colors according to the lag time, as defined by the color scale bar in D. C and F, representative TEM images of fibrils obtained after 12 h of ultrasonication. G, histograms of the lag time with (red) and without (blue) plate movements. H, means ± S.D. for lag times (closed circles) and coefficients of variation (open circles). I and J, extensive ultrasonication caused a decrease in ThT fluorescence and formation of amorphous aggregates. The experiment was done separately with a water bath-type ultrasonicator and a sample cell, which is useful for both ultrasonic treatments and fluorescence measurements. TEM images were obtained after 0, 2, and 13 h of incubation as indicated by the arrowheads. Scale bars = 200 nm.
Here, we noticed that, although the morphologies of fibrils were independent of the plate movements, the fibrils formed with plate movements tended to be contaminated by amorphous aggregates. This was more evident when the decrease in ThT fluorescence after the maximum was marked, suggesting that the extensive ultrasonication caused the transformation of preformed amyloid fibrils to more stable amorphous aggregates accompanied by the decrease in ThT fluorescence (see below).
The extent of variation among the 96 wells was analyzed on the basis of a lag time in the presence and absence of plate movements (Fig. 3, G and H). In the absence of plate movements, the mean ± S.D. and coefficient of variation were 6.0 ± 4.0 h and 0.85, respectively. In the presence of plate movements, the amyloid burst synchronized with a mean ± S.D. and coefficient of variation of 2.0 ± 0.4 h and 0.2, respectively.
ThT fluorescence decreased after the maximum, which was more pronounced for reactions with a shorter lag time. We assumed that the decrease after the maximum was caused by the formation of amorphous aggregates at the water-air interface of cavitation bubbles, which become more stable under continuous ultrasonic irradiation than kinetically preferred amyloid fibrils. We confirmed the validity of this assumption by monitoring the morphologies of aggregates by TEM at 0, 2.0, and 13.0 h after initiation of ultrasonication (Fig. 3, I and J).
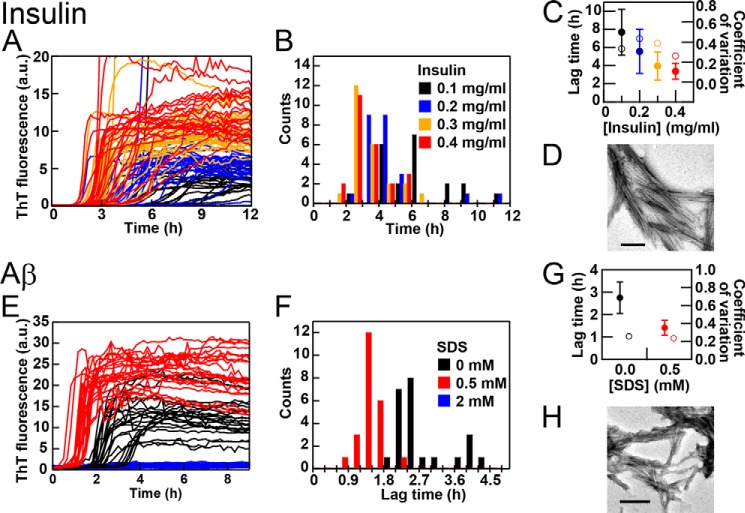
We then examined the amyloid fibrillation of human insulin at various concentrations in the presence of 3.0 m GdnHCl and 5 μm ThT at pH 2.5 and 37 °C with plate movements (Fig. 4, A–D). Insulin was unfolded under these conditions. We varied the insulin concentration between 0.4 (red), 0.3 (orange), 0.2 (blue), and 0.1 (black) mg/ml in one plate with 24 wells for each concentration. One experiment with a microplate containing 96 wells with various insulin concentrations revealed the concentration dependence of insulin fibrillation as monitored by ThT fluorescence. The average lag time shortened to 3 h when the insulin concentration was increased to 0.4 mg/ml (Fig. 4C). Although the S.D. shortened when the protein concentration was increased, the coefficient of variation was ∼0.4, which was independent of the protein concentration. The formation of fibrils was confirmed by TEM (Fig. 4D).
FIGURE 4.
Performance of HANABI with insulin (A–D) and Aβ(1–40) (E–H) with plate movements. A–C, kinetics (A), histograms of the lag time (B) and means ± S.D. for the lag time (closed circles) and coefficients of variation (open circles) (C) at 0.1 (black), 0.2 (blue), 0.3 (orange), and 0.4 (red) mg/ml insulin in 3.0 m GdnHCl and 5 μm ThT at pH 2.5 and 37 °C. A microplate with 96 wells was used, with 24 wells for each insulin concentration. D, TEM image of insulin fibrils formed at 0.2 mg/ml insulin. E–G, kinetics (E), histograms of the lag time (F), and means ± S.D. for the lag time and coefficients of variation (G) at 10 μm Aβ(1–40) in the absence (black) and presence of 0.5 (red) or 2.0 (blue) mm SDS in 100 mm NaCl and 5 μm ThT at pH 7.0 and 37 °C. H, TEM image of Aβ(1-)40 fibrils formed in the presence of 0.5 mm SDS. Scale bars = 200 nm. a.u., arbitrary units.
Depending on the concentration used, SDS accelerates or inhibits the amyloid fibrillation of various proteins and peptides (34, 35). Thus, SDS may be a model accelerator or inhibitor of amyloid fibrillation. We examined the effects of SDS on the fibril formation of 10 μm Aβ(1–40) in 50 mm NaCl and 5 μm ThT at pH 2.5 and 37 °C with plate movements (Fig. 4, E–H). Aβ(1–40) formed fibrils with a lag time of ∼2.5 h during cycles of 1 min of ultrasonic irradiation and 9 min of quiescence. In the presence of 0.5 mm SDS, the lag time shortened to 1.5 h. In contrast, fibrillation was suppressed completely in the presence of 2.0 mm SDS. In the absence and presence of 0.5 mm SDS, the coefficients of variation were both ∼0.2 (Fig. 4G). We confirmed the formation of fibrils by TEM (Fig. 4H).
Effect of GdnHCl on Lysozyme Fibrillation
The examples of amyloid fibrillation described above suggested that the coefficients of variation were larger than those with KI oxidation. Amyloid fibrillation often starts with a native state, where the rigid structure prevents amyloid formation, and at the very least, partial unfolding is required to form fibrils (36). To examine the effects of the initial conformation on the lag time and stochastic aspect of amyloid fibrillation, we used hen egg white lysozyme, for which fibrillation occurred from either the native or denatured structure at pH 2.0 by changing the concentration of GdnHCl. In previous studies, we reported the ultrasonication-forced amyloid fibrillation of lysozyme in water/alcohol mixtures (11, 12).
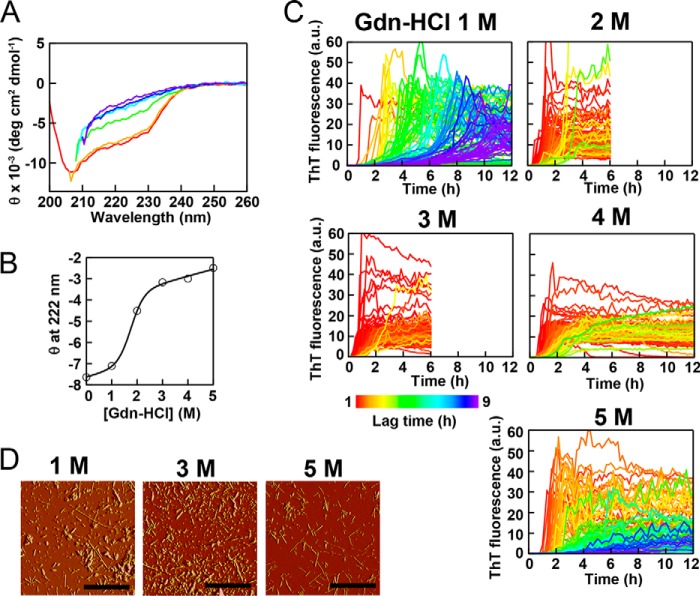
When monitored by the CD spectrum, lysozyme assumed a native structure at 1.0 m GdnHCl (Fig. 5A, orange). Lysozyme was significantly denatured at 2.0 m GdnHCl (green), although it retained some of the native population. Lysozyme was largely unfolded above 3.0 m GdnHCl.
FIGURE 5.
Amyloid fibrillation of lysozyme at 5.0 mg/ml in the presence of various concentrations of GdnHCl and 5 μm ThT at pH 2.5 and 37 °C. A, far-UV spectra of lysozyme before fibrillation in the absence (red) or presence of 1.0 (orange), 2.0 (green), 3.0 (light blue), 4.0 (dark blue), or 5.0 (purple) m GdnHCl at pH 2.5 and 37 °C. B, GdnHCl-dependent denaturation as monitored by the ellipticity at 222 nm. C, the kinetics monitored by ThT fluorescence at 480 nm are represented by different colors according to the lag time, as defined by the color scale bar. D, AFM images of lysozyme fibrils in the presence of 1.0, 3.0, or 5.0 m GdnHCl. Scale bars = 2 μm. a.u., arbitrary units.
Lysozyme was incubated at 37 °C with plate movements during cycles of 3 min of ultrasonication and 7 min of quiescence and was analyzed with ThT fluorescence (Fig. 5C). In the absence of GdnHCl, no significant ThT binding was observed over 12 h (data not shown), indicating the absence of fibrillation. Fibrillation monitored by ThT fluorescence occurred in the presence of 1.0 m GdnHCl, with a significant variation in the lag time from 1 to 9 h depending on the wells. In the presence of 2.0–4.0 m GdnHCl, fibrillation occurred rapidly, and the lag time apparently synchronized among the 96 wells between 30 and 90 min. Fibrillation was the fastest in the presence of 3.0 m GdnHCl, with a lag time of <60 min for most of the wells. In the presence of 5.0 m GdnHCl, fibrillation became slow, with apparently scattered lag times. The formation of fibrils at various concentrations of GdnHCl was confirmed by AFM (Fig. 5D).
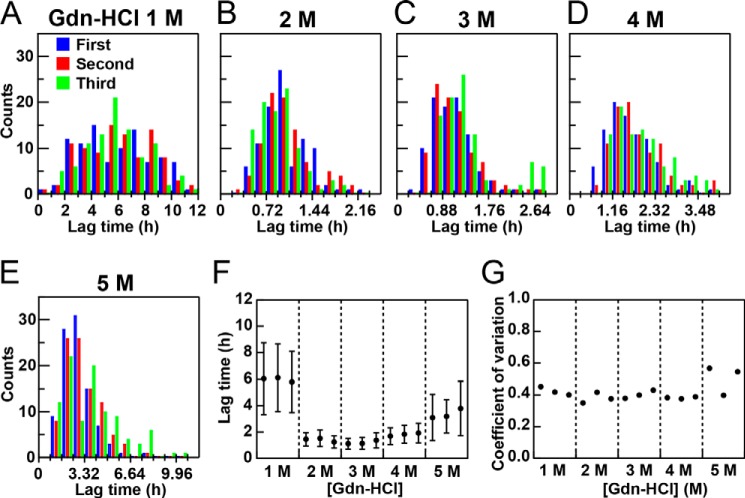
We analyzed the distribution of lag times by the two methods, as was the case with KI oxidation. We first plotted histograms to represent the distribution of lag times at various concentrations of GdnHCl (Fig. 6, A–E). We then estimated variations in the lag time among the 96 wells in each experiment assuming a Gaussian distribution (Fig. 6F). Thus, we obtained the mean ± S.D. and coefficient of variation (Fig. 6, F and G) for each of the experiments at various GdnHCl concentrations. Although the lag time and S.D. depended on the concentration of GdnHCl with a minimum at ∼3.0 m, the coefficient of variation was constant at a value of ∼0.4 at all GdnHCl concentrations examined. These results suggested that, although scattering of the lag time was evident at the lower and higher concentrations, this appeared to have been caused by an increase in the lag time. Moreover, the coefficient of variation (∼0.4) was larger than that of KI oxidation (∼0.2), representing a complicated mechanism of amyloid nucleation.
FIGURE 6.
Dependence of the lag time of lysozyme fibrillation on the GdnHCl concentration on the basis of “whole plate analysis.” A–E, histograms of the lag time at various GdnHCl concentrations. F and G, means ± S.D. for the lag times (F) and coefficients of variation (G) at various GdnHCl concentrations. The results of three experiments (as shown in Fig. 5) are represented.
We also analyzed variations in the lag time starting with variations in each well in the three independent experiments (Fig. 7). We obtained a mean ± S.D. and coefficient of variation for the lag time for each well. The S.D. (Fig. 7A) and coefficient of variation (Fig. 7B) were then plotted against the mean lag time. The S.D. values appeared to increase with increases in the average lag time. Because the lag time depended on the GdnHCl concentration, data points clustered depending on the GdnHCl concentration, with the shortest lag time at 3.0 m GdnHCl.
FIGURE 7.
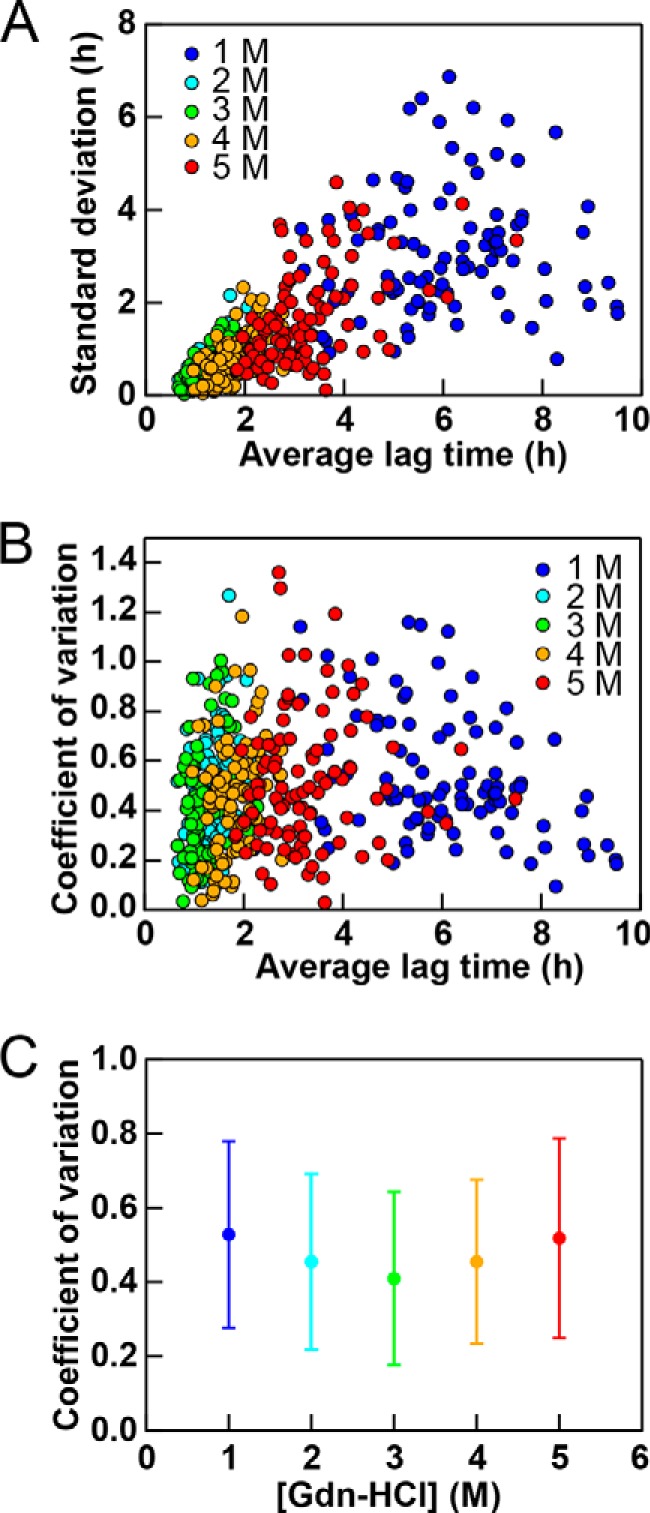
Dependence of the lag time of lysozyme fibrillation on the GdnHCl concentration on the basis of “each well analysis.” The S.D. (A) and coefficient of variation (B) obtained for each well on the basis of three experiments at various GdnHCl concentrations are plotted against the average lag time. C, average coefficients of variation with S.D. values at various GdnHCl concentrations.
However, the coefficient of variation appeared to be independent of the average lag time. In other words, the coefficient of variation was independent of GdnHCl. We also obtained the average coefficient of variation for the 96 wells at the respective GdnHCl concentrations (Fig. 7C). Although the coefficient of variation suggested a minimum at 3 m GdnHCl, its dependence was weak. The coefficients of variation were slightly larger than 0.4, similar to those obtained assuming a Gaussian distribution among the 96 wells.
Although the coefficients of variation depended weakly on the method of statistical analysis starting either with an analysis of the 96 wells in the respective experiments or with an analysis of each well among the three experiments, we obtained the same conclusion that the lag time and its variations correlated. Although scattering of the lag time at the lower and higher GdnHCl concentrations was larger than that at 2–3 GdnHCl, it was clear that the coefficient of variation was constant or close to constant independent of the initial GdnHCl.
The results provided an important insight into the mechanism underlying fibril formation. The detailed mechanism responsible for fibril formation varies depending on the GdnHCl concentration. At 1.0 m GdnHCl, the concentration at which lysozyme dominantly assumes its native structure, the protein had to unfold to form fibrils. At 5.0 m GdnHCl, highly disordered proteins returned to the amyloidogenic conformation with some degree of compaction. This resulted in the shortest lag time at 2–3 m GdnHCl, at which the amyloidogenic conformation stably populated and initiated fibrillation directly. However, the overall stochastic factor (i.e. coefficient of variation) determining amyloid nucleation did not depend on these conformations (Figs. 6G and 7C). The importance of additional stochastic factors is evident from the coefficient of variation for fibrillation being ∼0.4, which was larger than the value of 0.2 for KI oxidation (Fig. 2F). Although the factors that produce a high coefficient of variation have yet to be determined, we argue that the HANABI system has the potential to address these factors by advancing the high-throughput analysis of the forced fibrillation of proteins.
Ultrasonication-dependent Crystallization of Lysozyme
Ultrasonication was previously shown to be useful for accelerating the crystallization of proteins (11, 37). In this study, we installed a CCD camera in the HANABI system to rapidly and automatically monitor the crystallization of hen egg white lysozyme solution at a concentration of 20 mg/ml at pH 4.8 and 25 °C as described previously (11). No crystals were observed after the 1 day of incubation at 1.0 m NaCl in the absence of agitation (Fig. 8A). However, when the solution was subjected to ultrasonication for 5 min, crystals appeared at 10 h and grew in size by 30 h (Fig. 8B). These results indicate that ultrasonic irradiation broke supersaturation, leading to protein crystallization, as reported previously (11).
FIGURE 8.
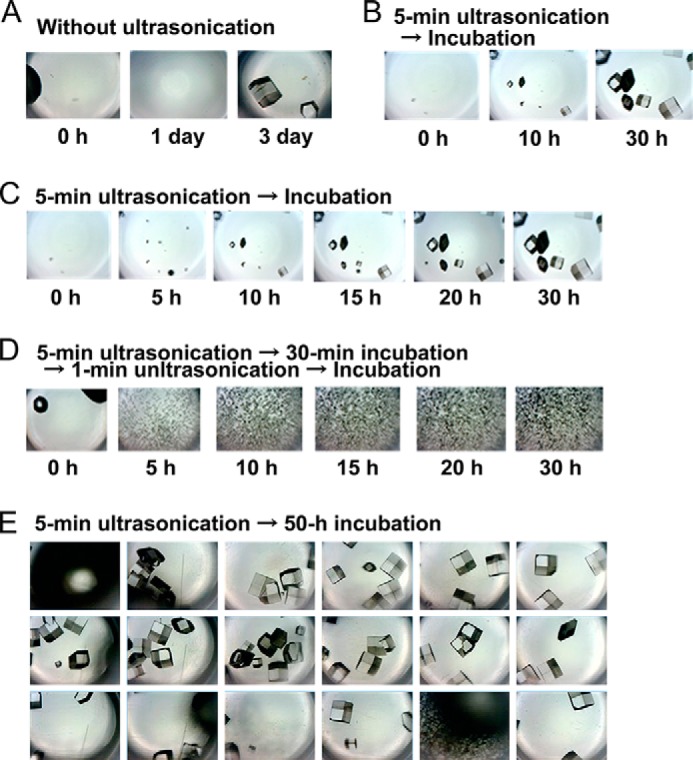
Monitoring the crystallization of lysozyme. A and B, crystallization with (B) and without (A) 5 min of ultrasonication. C, crystallization with 5 min of ultrasonication followed by quiescence. D, crystallization with 5 min of ultrasonication followed by 30 min of quiescence, 1 min of ultrasonication, and quiescence. E, crystallization in various wells with 5 min of ultrasonication followed by quiescence for 50 h. Sizes of images are 3 × 4 mm.
Ultrasonication has been shown to exert opposing effects on amyloid fibrils: the induction of monomers to form fibrils and the breakdown of preformed fibrils into smaller fibrils (19, 23). This also appears to be true for protein crystals based on the finding that ultrasonication-induced crystals are relatively homogeneous and small in size (11). Moreover, a smaller number of ultrasonic pulses without subsequent pulses is useful to obtain a smaller number of larger crystals (11). Therefore, we may be able to control the size and homogeneity of protein crystals by manipulating ultrasonic pulses. With a CCD camera attached to the HANABI system, we directly monitored the controlled growth of crystals (Fig. 8, C–E). Extensive ultrasonication, which was achieved by repeated pulses, resulted in a large number of small and homogeneous crystals (Fig. 8D), which may be useful for single-beam x-ray crystallography.
DISCUSSION
To advance studies of the mechanism of amyloid fibrillation, we developed the HANABI system by combining the use of ultrasonication and a fluorescence microplate reader. HANABI enables the automatic high-throughput analysis of ultrasonication-forced amyloid fibrillation under conditions in which the metastability of supersaturation is persistently stable. By applying controlled movements of the plate and averaging the applied energy of ultrasonication, we can synchronize the amyloid burst in 96 wells, although a higher level of synchronization is needed in the future. Ultrasonication-forced synchronized fibrillation with plate movements was demonstrated for β2-microglobulin (Fig. 3), insulin (Fig. 4, A–D), Aβ (Fig. 4, E–H), and lysozyme (Figs. 5–7). However, the kinetics of fibrillation still showed some variations in the lag time.
Regarding lysozyme, we performed a detailed analysis of fibrillation at various concentrations of GdnHCl (Figs. 6 and 7). On the basis of the complicated mechanism responsible for fibrillation, which consists of nucleation, growth, and the preceding denaturation of the native state, we expected that an analysis of variations in the lag time between the 96 wells would provide insight into the mechanism underlying fibrillation.
The lag time depended significantly on GdnHCl, with a minimum at 2.0–3.0 m GdnHCl, showing that both rigid native and highly disordered structures prevented fibrillation. The apparent scattering of the lag time was larger at the low and high concentrations of GdnHCl. However, the observed coefficient of variation (∼0.4) was almost independent of the GdnHCl concentration, although the major conformation varied largely depending on the GdnHCl concentration. The results suggest that the critical step associated with a large coefficient of variation is common to the reactions observed at various concentrations of GdnHCl. In other words, neither unfolding of the native state nor possible compaction of the highly disordered state produced large fluctuations in the lag time. The conformational states at 3.0 or 4.0 m GdnHCl may directly start nucleation processes. These processes may have large fluctuations, causing the observed large fluctuation in the lag time of amyloid fibrillation.
Here, the coefficient of variation for the ultrasonication-dependent oxidation rate of KI (∼0.2) (Fig. 2F) provides a measure of minimal scattering achieved with the current system. In comparison, the amyloid fibrillation of lysozyme gave a value of 0.4 at various concentrations of GdnHCl (Figs. 6G and 7C). This difference represents the complexity of amyloid nucleation in comparison with that of KI oxidation. In other words, the amyloid nucleation step itself is more stochastic than other simple reactions such as KI oxidation.
In conclusion, by performing high-throughput analyses of the ultrasonication-forced accelerated fibrillation with the HANABI system, we succeeded in the statistical analysis of the lag time of amyloid fibrillation. The results obtained with hen egg white lysozyme suggest that the large fluctuation observed in the lag time originated from a process associated with a common amyloidogenic intermediate, which may have been a relatively compact denatured conformation. As far as we know, a detailed statistical analysis of the lag time has not been reported previously, and this was only possible with a high-throughput analysis with the HANABI system, creating a new methodology of amyloid research. Moreover, we demonstrated that HANABI combined with a camera system is powerful enough to rapidly monitor the growth of protein crystals. Taken together, the HANABI system will further advance the studies of fibrillation and crystallization of proteins, both of which occur by the common mechanism of breaking the supersaturation of solute molecules.
Acknowledgments
We thank Shuzo Kasai (Corona Electric Co.) and Kokichi Ido (Elekon Science Co.) for technical support.
This work was supported by the Japanese Ministry of Education, Culture, Sports, Science and Technology, Takeda Science Foundation, and the Kansai Bureau of Economy, Trade and Industry.
- HANABI
- Handai amyloid burst inducer
- GdnHCl
- guanidine hydrochloride
- Aβ(1–40)
- amyloid-β peptide-(1–40)
- ThT
- thioflavin T
- TEM
- transmission electron microscopy
- AFM
- atomic force microscopy.
REFERENCES
- 1. Sipe J. D., Benson M. D., Buxbaum J. N., Ikeda S., Merlini G., Saraiva M. J., Westermark P. (2012) Amyloid fibril protein nomenclature: 2012 recommendations from the Nomenclature Committee of the International Society of Amyloidosis. Amyloid 19, 167–170 [DOI] [PubMed] [Google Scholar]
- 2. Jucker M., Walker L. C. (2013) Self-propagation of pathogenic protein aggregates in neurodegenerative diseases. Nature 501, 45–51 [DOI] [PMC free article] [PubMed] [Google Scholar]
- 3. Eisenberg D., Jucker M. (2012) The amyloid state of proteins in human diseases. Cell 148, 1188–1203 [DOI] [PMC free article] [PubMed] [Google Scholar]
- 4. Tycko R., Wickner R. B. (2013) Molecular structures of amyloid and prion fibrils: consensus versus controversy. Acc. Chem. Res. 46, 1487–1496 [DOI] [PMC free article] [PubMed] [Google Scholar]
- 5. Jarrett J. T., Lansbury P. T., Jr. (1993) Seeding “one-dimensional crystallization” of amyloid: a pathogenic mechanism in Alzheimer's disease and scrapie? Cell 73, 1055–1058 [DOI] [PubMed] [Google Scholar]
- 6. Wetzel R. (2006) Kinetics and thermodynamics of amyloid fibril assembly. Acc. Chem. Res. 39, 671–679 [DOI] [PubMed] [Google Scholar]
- 7. Morris A. M., Watzky M. A., Finke R. G. (2009) Protein aggregation kinetics, mechanism, and curve-fitting: a review of the literature. Biochim. Biophys. Acta 1794, 375–397 [DOI] [PubMed] [Google Scholar]
- 8. Naiki H., Hashimoto S., Suzuki H., Kimura K., Nakakuki K., Gejyo F. (1997) Establishment of a kinetic model of dialysis-related amyloid fibril extension in vitro. Amyloid 4, 223–232 [Google Scholar]
- 9. Harper J. D., Lansbury P. T., Jr. (1997) Models of amyloid seeding in Alzheimer's disease and scrapie: mechanistic truths and physiological consequences of the time-dependent solubility of amyloid proteins. Annu. Rev. Biochem. 66, 385–407 [DOI] [PubMed] [Google Scholar]
- 10. Yoshimura Y., Lin Y., Yagi H., Lee Y. H., Kitayama H., Sakurai K., So M., Ogi H., Naiki H., Goto Y. (2012) Distinguishing crystal-like amyloid fibrils and glass-like amorphous aggregates from their kinetics of formation. Proc. Natl. Acad. Sci. U.S.A. 109, 14446–14451 [DOI] [PMC free article] [PubMed] [Google Scholar]
- 11. Kitayama H., Yoshimura Y., So M., Sakurai K., Yagi H., Goto Y. (2013) A common mechanism underlying amyloid fibrillation and protein crystallization revealed by the effects of ultrasonication. Biochim. Biophys. Acta 1834, 2640–2646 [DOI] [PubMed] [Google Scholar]
- 12. Lin Y., Lee Y. H., Yoshimura Y., Yagi H., Goto Y. (2014) Solubility and supersaturation-dependent protein misfolding revealed by ultrasonication. Langmuir 30, 1845–1854 [DOI] [PubMed] [Google Scholar]
- 13. Ciryam P., Tartaglia G. G., Morimoto R. I., Dobson C. M., Vendruscolo M. (2013) Widespread aggregation and neurodegenerative diseases are associated with supersaturated proteins. Cell Rep. 5, 781–790 [DOI] [PMC free article] [PubMed] [Google Scholar]
- 14. Cabriolu R., Auer S. (2011) Amyloid fibrillation kinetics: insight from atomistic nucleation theory. J. Mol. Biol. 411, 275–285 [DOI] [PubMed] [Google Scholar]
- 15. Cohen S. I., Vendruscolo M., Dobson C. M., Knowles T. P. (2012) From macroscopic measurements to microscopic mechanisms of protein aggregation. J. Mol. Biol. 421, 160–171 [DOI] [PubMed] [Google Scholar]
- 16. Platt G. W., Routledge K. E., Homans S. W., Radford S. E. (2008) Fibril growth kinetics reveal a region of β2-microglobulin important for nucleation and elongation of aggregation. J. Mol. Biol. 378, 251–263 [DOI] [PMC free article] [PubMed] [Google Scholar]
- 17. Giehm L., Otzen D. E. (2010) Strategies to increase the reproducibility of protein fibrillization in plate reader assays. Anal. Biochem. 400, 270–281 [DOI] [PubMed] [Google Scholar]
- 18. Ohhashi Y., Kihara M., Naiki H., Goto Y. (2005) Ultrasonication-induced amyloid fibril formation of β2-microglobulin. J. Biol. Chem. 280, 32843–32848 [DOI] [PubMed] [Google Scholar]
- 19. Chatani E., Lee Y. H., Yagi H., Yoshimura Y., Naiki H., Goto Y. (2009) Ultrasonication-dependent production and breakdown lead to minimum-sized amyloid fibrils. Proc. Natl. Acad. Sci. U.S.A. 106, 11119–11124 [DOI] [PMC free article] [PubMed] [Google Scholar]
- 20. So M., Yagi H., Sakurai K., Ogi H., Naiki H., Goto Y. (2011) Ultrasonication-dependent acceleration of amyloid fibril formation. J. Mol. Biol. 412, 568–577 [DOI] [PubMed] [Google Scholar]
- 21. Yoshimura Y., So M., Yagi H., Goto Y. (2013) Ultrasonication: an efficient agitation for accelerating the supersaturation-limited amyloid fibrillation of proteins. Jpn. J. Appl. Phys. 52, 07HA01 [Google Scholar]
- 22. Lee Y. H., Chatani E., Sasahara K., Naiki H., Goto Y. (2009) A comprehensive model for packing and hydration for amyloid fibrils of β2-microglobulin. J. Biol. Chem. 284, 2169–2175 [DOI] [PubMed] [Google Scholar]
- 23. Yoshimura Y., Sakurai K., Lee Y. H., Ikegami T., Chatani E., Naiki H., Goto Y. (2010) Direct observation of minimum-sized amyloid fibrils using solution NMR spectroscopy. Protein Sci. 19, 2347–2355 [DOI] [PMC free article] [PubMed] [Google Scholar]
- 24. Webster E. (1963) Cavitation. Ultrasonics 1, 39–48 [Google Scholar]
- 25. Thomas J. R. (1959) Sonic degradation of high polymers in solution. J. Phys. Chem. 63, 1725–1729 [Google Scholar]
- 26. Saborio G. P., Permanne B., Soto C. (2001) Sensitive detection of pathological prion protein by cyclic amplification of protein misfolding. Nature 411, 810–813 [DOI] [PubMed] [Google Scholar]
- 27. Saá P., Castilla J., Soto C. (2006) Ultra-efficient replication of infectious prions by automated protein misfolding cyclic amplification. J. Biol. Chem. 281, 35245–35252 [DOI] [PubMed] [Google Scholar]
- 28. Yamaguchi K., Matsumoto T., Kuwata K. (2012) Proper calibration of ultrasonic power enabled the quantitative analysis of the ultrasonication-induced amyloid formation process. Protein Sci. 21, 38–49 [DOI] [PMC free article] [PubMed] [Google Scholar]
- 29. Kam Z., Shore H. B., Feher G. (1978) Crystallization of proteins. J. Mol. Biol. 123, 539–555 [DOI] [PubMed] [Google Scholar]
- 30. Asherie N. (2004) Protein crystallization and phase diagrams. Methods 34, 266–272 [DOI] [PubMed] [Google Scholar]
- 31. Durbin S. D., Feher G. (1996) Protein crystallization. Annu. Rev. Phys. Chem. 47, 171–204 [DOI] [PubMed] [Google Scholar]
- 32. Chiba T., Hagihara Y., Higurashi T., Hasegawa K., Naiki H., Goto Y. (2003) Amyloid fibril formation in the context of full-length protein. Effects of proline mutations on the amyloid fibril formation of β2-microglobulin. J. Biol. Chem. 278, 47016–47024 [DOI] [PubMed] [Google Scholar]
- 33. Koda S., Kimura T., Kondo T., Mitome H. (2003) A standard method to calibrate sonochemical efficiency of an individual reaction system. Ultrason. Sonochem. 10, 149–156 [DOI] [PubMed] [Google Scholar]
- 34. Yamamoto S., Hasegawa K., Yamaguchi I., Tsutsumi S., Kardos J., Goto Y., Gejyo F., Naiki H. (2004) Low concentrations of sodium dodecyl sulfate induce the extension of β2-microglobulin-related amyloid fibrils at a neutral pH. Biochemistry 43, 11075–11082 [DOI] [PubMed] [Google Scholar]
- 35. Yamaguchi K., Naiki H., Goto Y. (2006) Mechanism by which the amyloid-like fibrils of a β2-microglobulin fragment are induced by fluorine-substituted alcohols. J. Mol. Biol. 363, 279–288 [DOI] [PubMed] [Google Scholar]
- 36. Uversky V. N., Fink A. L. (2004) Conformational constraints for amyloid fibrillation: the importance of being unfolded. Biochim. Biophys. Acta 1698, 131–153 [DOI] [PubMed] [Google Scholar]
- 37. Crespo R., Martins P. M., Gales L., Rocha F., Damas A. M. (2010) Potential use of ultrasound to promote protein crystallization. J. Appl. Cryst. 43, 1419–1425 [Google Scholar]


