

Abstract
Despite mounting evidence of the high disease burden of influenza in tropical regions, relatively little viral sequence data is available from tropical countries in the Western hemisphere. To understand the evolutionary dynamics of influenza A and B viruses in Managua, Nicaragua, we performed a phylogenetic analysis of 1,956 influenza viruses, including 335 collected for this study during 2007–2010 from a population-based cohort in Managua. North America was consistently identified as the most significant source of influenza virus diversity in Managua, although South America and Mexico were important viral sources during the 2009 A/H1N1 pandemic. The low number of viral introductions of Central American origin may reflect differences in the seasonality of influenza in Nicaragua versus neighboring countries, and underscores the need for additional data in this understudied region.
Keywords: influenza, evolution, Central America, molecular epidemiology
Introduction
Although influenza virus activity is associated with cold winter months in temperate regions, the last decade of research has highlighted the importance of tropical and sub-tropical regions in the disease burden and the long-term evolution of influenza viruses in humans at a global scale (Viboud et al., 2007; Moura et al., 2010). Strong influenza virus population bottlenecks following the end of seasonal influenza epidemics in temperate regions indicate that viral migration is central to the long-term persistence of the influenza virus in humans (Rambaut et al., 2008). Tropical regions with more variable climatic patterns may sustain influenza viruses for longer time periods, and recent studies provide phylogenetic evidence for the persistence of human influenza virus lineages for more than a year in both Vietnam (Le et al., 2013) and West Africa (Nelson et al., 2014). Large-scale phylogenetic analyses of influenza virus sequence data support various models for viral migration, including an out-of-Asia model in which Southeast Asia sustains a permanent reservoir of influenza virus diversity that is continually exported to other continents (Russell et al., 2008), as well as metapopulation models (Bedford et al., 2010; Bahl et al., 2011). Recently it has been demonstrated that air traffic communities are key determinants of global migration patterns of A/H3N2 viruses in humans (Lemey et al., 2014).
A complete understanding of influenza virus dynamics requires increased data from understudied populations in the tropics, including Latin America, Africa, and South Asia. To address this gap, the Nicaraguan Influenza Cohort Study has conducted population-level multi-year surveillance for influenza viruses in children ages 2–14 within the capital city of Managua in Nicaragua. One of the key findings of this long-term study has been the high level of influenza virus activity detected during the seasonal epidemic that typically begins in Managua in June (Gordon et al., 2009). This timing falls towards the end of the North American influenza season, which typically runs October to April, and the start of the influenza season in temperate South American countries that runs May to September. We therefore sought to understand how the diversity of influenza A and B viruses that circulate in Managua during an epidemic relates genetically to the viruses that circulate elsewhere in the Americas. Using 335 whole-genome sequences from influenza viruses collected in Managua during 2007–2010 as part of our study and 1,621 additional viruses collected elsewhere in the Americas and globally during this time period, we conducted a large-scale phylogenetic analysis of the viral diversity that circulates in Managua each year and the spatial relationships between viruses in Managua and neighboring regions in the Americas.
Results
Phylogenetic analysis
We performed a phylogenetic analysis to estimate the extent of influenza virus diversity that circulates within Managua, the geographical sources of such viral diversity, and how the genetic diversity of an epidemic relates to the observed epidemiology each season. Specifically, we inferred (a) the number of introductions of influenza viruses into Managua during each epidemic, (b) the geographical sources of these introductions within the Americas, (c) a picture of the viral diversity underlying epidemics with unusual epidemiological patterns, such as Managua’s extended multi-wave 2008 epidemic, and (d) the spatial dynamics of the virus within the geographically defined neighborhoods (‘barrios’) of the study area, Managua’s District II. To mitigate the effect of sample bias, we randomly subsampled background viruses to have an equal number of sequences from North America, South America, and globally for each data set (Table S1).
Genetic diversity of influenza A and B viruses in Managua
The Bayesian maximum clade credibility (MCC) trees inferred for the six viral lineages that were detected in Managua during 2007–2010 identified extensive influenza virus diversity co-circulating within the district, resulting from multiple introductions of the virus into Managua each year (Table 1; Figs. 1–4 and S1–S2). More than 15 discrete introductions of the A/H3N2 virus into Managua were estimated during the 2007 epidemic (Fig. 1). Almost 30 viral introductions were estimated during the particularly diverse influenza epidemic of 2008 when both seasonal A/H1N1 and B/Yamagata viruses co-circulated (Table 1; Figs. 2 and S1). Over 20 viral introductions were estimated during the 2009 A/H1N1 pandemic (Fig 3). In contrast, Managua’s epidemic of 2010 was characterized by relatively few introductions of the A/H3N2 viruses (n = 3.5 introductions) (Fig. 4) and the co-circulating B/Victoria viruses (n = 1.1 introductions) (Fig. S2). The diversity of both of the A/H3N2 and B/Victoria viruses in Managua was mostly restricted to a single clade in 2010.
Table 1.
Introductions of influenza A and B viruses (a) into and (b) out of Managua, Nicaragua, during four seasons (2007–2010) for three key regions in the Americas: North America (North), Central America (Central), and South America (South). Given the importance of Mexico in the early spread of the 2009 pandemic A/H1N1 virus and the greater availability of influenza virus sequence data following the 2009 pandemic, Mexico (Mex) and the Caribbean (Carib) are also considered as regions for the years 2009 and 2010. Global viruses (Global) were sampled from Africa, Asia, Europe, and the Pacific region.
| a. Introductions into Managua | ||||||||
|---|---|---|---|---|---|---|---|---|
| Year | Subtype | North | Central | South | Global | Carib | Mex | Total |
| 2007 | H3N2 | 9.3 | < 1 | 5.6 | < 1 | n/a | n/a | 15.4 |
| 2008 | sH1N1 | 6.2 | 4.4 | 1.2 | < 1 | n/a | n/a | 12.1 |
| 2008 | B/YAM | 15.6 | 1 | < 1 | < 1 | n/a | n/a | 17.1 |
| 2009 | pH1N1 | 3.1 | < 1 | 14.3 | n/a | < 1 | 3.1 | 20.5 |
| 2010 | H3N2 | 2.9 | < 1 | < 1 | < 1 | < 1 | < 1 | 3.5 |
| 2010 | B/VIC | < 1 | < 1 | < 1 | 1.1 | n/a | n/a | 1.1 |
| Total | 37.1 | 5.7 | 21.5 | 2.2 | < 1 | 3.1 | 69.7 | |
| b. Introductions out of Managua | ||||||||
|---|---|---|---|---|---|---|---|---|
| Year | Subtype | North | Central | South | Global | Carib | Mex | Total |
| 2007 | H3N2 | 2.4 | 2.9 | 2.4 | < 1 | n/a | n/a | 8.3 |
| 2008 | sH1N1 | < 1 | 1.4 | < 1 | < 1 | n/a | n/a | 2.3 |
| 2008 | B/YAM | 1.5 | 3.1 | 1.4 | < 1 | n/a | n/a | 6.5 |
| 2009 | pH1N1 | 2.1 | 4.3 | < 1 | n/a | < 1 | < 1 | 7.4 |
| 2010 | H3N2 | 2.5 | 8 | < 1 | < 1 | < 1 | < 1 | 11.8 |
| 2010 | B/VIC | < 1 | < 1 | < 1 | < 1 | n/a | n/a | 0.2 |
| Total | 8.9 | 19.7 | 4.8 | 2.3 | < 1 | < 1 | 36.5 | |
Figure 1. Phylogenetic relationships of HA1 sequences from 356 seasonal A/H3N2 influenza viruses collected during 2006–2007.

Time-scaled Bayesian MCC tree of the HA1 sequences of viruses collected in Managua, Nicaragua (n = 47), as well as background viruses (n = 309) from South America, Central America, North America, and globally. Tip labels have been removed and branches are labeled as follows: viruses from Managua, Nicaragua (NIC), are shaded blue; viruses from Central America (CEN) are shaded red; viruses from North America (in this case United States and Canada, NOR) are green; viruses from South America (SOU) are purple; and viruses collected globally from other countries in Africa, Asia, Europe, and the Pacific region (GLO) are black. Posterior probabilities > 0.80 are included for key nodes. The estimated number of introductions of the A/H3N2 virus into Managua by region, inferred by location state transitions on the phylogeny, is summarized for the four regions, with shading identical to that used in the tree.
Figure 4. Phylogenetic relationships of HA sequences from 379 seasonal A/H3N2 influenza viruses collected during 2009–2010.

Time-scaled Bayesian MCC tree of the HA sequences of viruses collected from our study site in Managua, Nicaragua (n = 73), as well as background viruses from South America, Central America, the Caribbean, North America, Mexico, and globally (n = 306). Labels and shading of branches is identical to Fig. 3.
Figure 2. Phylogenetic relationships of HA sequences from 186 seasonal A/H1N1 influenza viruses collected during 2007–2008.

Time-scaled Bayesian MCC tree of the HA sequences of viruses collected from Managua, Nicaragua (n = 35), as well as background viruses (n = 152) from South America, Central America, North America, and globally. Labels and shading of branches is identical to Fig. 1, with the additional labeling of the eleven viral introductions into Managua that correspond to Fig. 6.
Figure 3. Phylogenetic relationships of HA sequences from 592 pandemic A/H1N1 influenza viruses collected during 2009.

Time-scaled Bayesian MCC tree of the HA sequences of viruses collected from Managua, Nicaragua (n = 131), as well as background viruses (n = 461) from South America, Central America, and North America. Labels and shading of branches is identical to Fig. 1, with the addition of viruses from the Caribbean (light orange) and Mexico (maroon) and the omission of global viruses.
Geographical sources of viral diversity in Managua
To further investigate the spatial origins of these viral introductions into Managua, we employed a Bayesian phylogeographic approach to infer patterns of spatial migration from the evolutionary relationships of viruses sampled in the Americas and globally (Tables 1, S2). ‘Markov jump’ counts (Minin et al., 2008) of the expected number of location state transitions along the phylogenetic branches provided a quantitative measure of gene flow between regions, representing successful viral introductions. For four of the six viral lineages detected in Managua during this time period (H3N2-2007, sH1N1-2008, B/Yam-2008, and H3N2-2010), North America (in this case the United States and Canada) was the source of the largest number of discrete viral introductions into Managua (Tables 1 and S2; Figs. 1, 2, 4, and S1). South America was the second-most important source of influenza virus diversity in Managua over this time period, especially during the 2009 A/H1N1 pandemic (Table 1; Fig. 3). Mexico also was estimated to be an important source of the major clade of pandemic A/H1N1 (pH1N1) viruses in Managua (Fig. 3), which is consistent with Mexico’s central role in the emergence and early spatial dissemination of the pH1N1 virus (Chowell et al., 2009; Lemey et al., 2009a). Although the global viral population was an important source of the viral diversity found in North America and, to a lesser extent, South America (Table S2), very little direct importation of viruses from global regions beyond the Americas was observed in Managua in this study. Only the 2010 clade of B/Victoria viruses identified in Managua was estimated to derive from the global viral population (n = 1.1 introductions, Table 1; Fig. S2).
In most years Central America was not found to be an important source of viral diversity in Managua. The relatively lower availability of influenza virus data from this region may account in part for the lack of observed viral migration from other Central American countries into Nicaragua. However, several clades with high posterior probabilities (> 80) contained viruses from other Central American countries (e.g., Fig 1), providing evidence of frequent viral migration between other Central American countries, including Honduras, Costa Rica, El Salvador, Panama, and Guatemala. The lack of viruses from Managua in these Central American clades was conspicuous, and could relate to differences in the timing of epidemics across Central America. Whereas epidemics in Managua typically occur in summer months, viruses from other Central American countries were more commonly collected during the fall months of September, October, and November. Central America was found to be the largest recipient of influenza virus diversity exported from Managua to other regions (Table 1; Fig. 5), which is consistent with the initiation of epidemics in other Central American countries in late summer when the Managua epidemic is ending.
Figure 5. Inter-regional movements of seasonal influenza viruses into and out of Managua, Nicaragua.
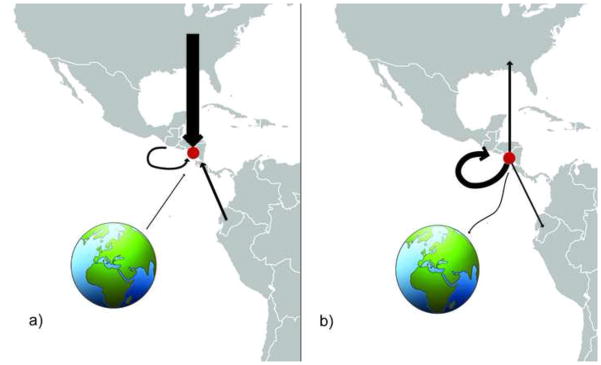
The width of each arrow is proportional to the total number of viral migration events inferred directly from the MCC phylogenies of seasonal (non-pandemic) A/H3N2 viruses, A/H1N1 viruses, B/Yamagata viruses, and B/Victoria viruses (see Table 1) that occurred (a) into Managua, Nicaragua (indicated with red circle), from North America, Central America, South America, and a global viral population located outside of the Americas, and (b) from Managua to North America, Central America, South America, and globally.
Epidemiology of influenza viruses in the Americas
To provide additional context for epidemic dynamics in Managua, we gathered influenza virus surveillance data for the years 2006–2010 from South America via the WHO’s FluNet (Anonymous, 2014a), from the United States via the Centers for Disease Control and Prevention’s detailed weekly surveillance reports for influenza (Anonymous, 2014b), and from Canada via Canada’s Communicable Disease Reports (e.g., Reyes et al., 2008). In several cases, high activity of a viral subtype during the later spring months of a US epidemic was associated with multiple introductions of that subtype into Managua. For example, the large number of viral introductions that were associated with the 2007 A/H3N2 epidemic in Managua from North America (n = 9.3 introductions, Table 1) coincided with high A/H3N2 virus activity during March – May 2007 in the United States (Anonymous, 2014b). The low number of introductions of A/H3N2 viruses during Managua’s 2010 A/H3N2 epidemic (n = 3.5) coincided with low levels of A/H3N2 virus activity during a 2009–2010 epidemic that was dominated strongly by pandemic A/H1N1 viruses in the United States. The high number of introductions of B/Yamagata influenza viruses into Managua of North American origin in 2008 (n = 15.6 introductions) coincided with a late peak of B/Yamagata virus activity in the United States during the spring of 2008. In 2010, Managua’s influenza B epidemic was characterized by a single introduction of a B/Victoria virus of global origin, which is consistent with the low levels of influenza B virus activity observed in the United States throughout the 2009–2010 epidemic (~1% of all influenza viruses).
Molecular epidemiology of the 2008 epidemic in Managua
Influenza activity in Managua followed a strong seasonal pattern during the study period, with a distinct summer peak following the initial detection of the virus, typically in June. Although the distinct June–July summer peak was again observed during 2008 in Managua, influenza virus activity also increased at other times of the year. In late winter/early spring a first wave of influenza virus activity was observed that was epidemiologically dominated by B/Yamagata viruses (data not shown). Following the major second wave of seasonal A/H1N1 in June–July, a third wave dominated by B/Yamagata viruses was observed in August. Influenza virus activity persisted unusually late into autumn, with an additional fourth wave dominated by seasonal A/H1N1 in October–November (Figs. 2 and 6). Sequence data from influenza viruses collected in Managua throughout 2008 indicate that these epidemic waves were initiated by repeated introductions of seasonal A/H1N1 and B/Yamagata viruses into the city. At least 11 introductions of seasonal A/H1N1 viruses occurred during 2008, with the largest number of introductions (n = 5) occurring during the main second wave (introductions 2, 6, 7, 8, and 10, Fig. 6). Different clades of B/Yamagata viruses also were dominant during the first and second halves of 2008 (Fig. 6). Overall, North America was the largest geographical source of the viral introductions observed in Managua during 2008. However, a key viral introduction from South America during Managua’s large second epidemic wave circulated from June to August. The viral introduction associated with the fourth wave was of Central American origin. Therefore, North America, South America, and Central America all contributed to the re-seeding of Managua’s extended 2008 epidemic.
Figure 6. Molecular epidemiology of the 2008 influenza epidemic in Managua.

The incidence of influenza in the Managua cohort population per 100 person-years during 2008 is represented by the black line. Each black dash indicates a time point of identification of a virus belonging to one of the eleven clades of seasonal A/H1N1 viruses, which are shaded by region of origin, identical to Fig. 1: introductions of Central American origin are red, introductions of North American origin are green, and introductions of South American origin are purple. No indication of the time of circulation is provided for the two B/Yamagata lineages due to the low resolution of the phylogeny and our necessarily conservative approach towards estimating the number of introductions of each of these two lineages.
Spatial dynamics of the 2010 A/H3N2 epidemic in Managua
The dominance of a single well-sampled A/H3N2 influenza virus lineage in Managua during the 2010 epidemic provided the opportunity to examine the fine-scale spatial dynamics of this virus within Managua’s District II (Fig. S3). A separate MCC tree was inferred for the concatenated whole-genome sequences of the 69 A/H3N2 viruses from this Managua clade (none of which were reassortants, data not shown). The resulting phylogeny is characterized by panmixis, with no statistically significant geographical pattern of spatial structure by neighborhood (‘barrio’) (AI = 0.110, PS = 0.687) or more broadly defined clusters of barrios (AI = 0.504, PS = 0.702, Table S3). Three pairs of viruses that were collected from the same barrio and sampled less than five days apart are supported by high posterior probabilities (100%), potentially representing limited viral transmission within barrios. However, the lack of broader spatial pattern of viral diffusion suggests that the virus had extensively disseminated throughout the barrios prior to our sampling.
Discussion
Our study highlights the dynamic nature of influenza epidemics in the tropical city of Managua. Each epidemic was composed of multiple introductions of influenza viruses of the same subtype of influenza A virus, with co-circulation of influenza B viruses in two of the four years of the study. The frequent introduction of new viral diversity can generate multiple epidemic waves, each associated with different clades of influenza A and B viruses, as observed during the particularly diverse and extended epidemic of seasonal A/H1N1 and B/Yamagata viruses in 2008. Influenza viruses rapidly disseminated spatially throughout the city, as evidenced by the lack of spatial structure observed even during what appeared to be a point-source outbreak of A/H3N2 viruses in 2010. The difficulty of identifying traceable chains of community virus transmission has been observed previously in the United States for influenza (Holmes et al., 2011), and the scale of viral sampling required to identify modes of fine-scale community transmission by phylogenetic analysis remains an open and important question for rapidly diffusing viruses.
For seasonal influenza virus epidemics, North America was estimated to be the source of the majority of these introductions, although the role of other Central American countries remains obscured by the relative lack of data. Our finding that the global population of influenza viruses beyond the Americas (i.e., Africa, Asia, Europe, and the Pacific region) was not a major source of viral diversity in Managua is consistent with previous models (Russell et al., 2008), and likely relates to Managua’s lower global interconnectivity via air travel compared to countries in North America as well as South America. We found no evidence that Managua – or Central America as a whole -- represents an important ‘source’ population for viral epidemics in North or South America, suggesting that the role of tropical regions in the global ecology of influenza is variable and complex. There is great interest in understanding how the architecture of the network of human movements via air, road, and other means impacts the spatial spread of infectious diseases (Brockmann et al., 2013; Lemey et al., 2014), and further understanding of the role of air traffic and human movements in the migration of influenza viruses in and out of Managua merits further study.
It remains unclear why North America was not an important source of pandemic A/H1N1 virus diversity in Managua in 2009, especially when pandemic activity was high in parts of the United States at the beginning of Managua’s pandemic. It is possible that the routes of viral migration between North America and Managua mainly involve the southern regions of the United States, which did not experience high pandemic A/H1N1 activity during the 2009 spring wave (Nelson et al., 2011). We are also aware that the broad geopolitical delineations of North America, Central America, and South America used in our study do not account for the environmental and climatic heterogeneity within these regions. Although evenly and randomly subsampling viral sequence data each year from North America, South America, and globally ought to mitigate the effect of sample bias in those regions, there was not sufficient data to subsample from Central America. It is important to note that phylogeographic methods are inherently sensitive to surveillance bias and cannot account for unsampled data points, and it is possible that viruses from North and South America traveled to Managua via other Central American countries, Mexico, or other localities that remain sparsely sampled. However, the presence of multiple Central American clades lacking Managua viruses was striking, and indicates that Central America cannot be considered a homogenous unit when it comes to influenza dynamics.
Variations in the seasonal patterns of influenza virus epidemics in Central American countries remain poorly documented, despite their central role in understanding the evolution and ecology of influenza viruses in the tropics. The apparent asymmetrical pattern of viral migration observed between Managua and other Central American countries underscores the need for additional epidemiological and virological surveillance data from other Central American countries. Knowledge of influenza dynamics in these tropical countries may be particularly important to inform vaccine strategies, as it has become apparent in recent years that the irregular seasonality of influenza in tropical and sub-tropical countries located near the equator undermines the default practice of selecting Northern versus Southern influenza vaccine based on a country’s hemispheric position alone (Yu et al. 2013; de Mello et al. 2009). Given the heterogeneity of climate and influenza dynamics among neighboring countries in the tropics, a detailed knowledge of the evolution and epidemiology and influenza viruses in these regions is essential for informing optimal vaccine strategies.
Methods
Data collection
The Nicaraguan Influenza Cohort Study was conducted from June 2007 to December 2010 to study the incidence and seasonality of pediatric influenza in Nicaragua. The study population consisted of ~3,800 children between the ages of 2 and 14 years in District II of Managua, Nicaragua. Children were provided with medical care through the study and a random sample of 25% of all children presenting with fever or history of fever with cough, rhinorrhea, or sore throat were selected for respiratory sampling. Respiratory samples consisted of a pooled nasal and throat swab. Influenza testing was performed by RT-PCR or real-time RT-PCR using standard Centers for Disease Control and Prevention protocols. All influenza-positive samples collected during low influenza transmission times and a random sample of those collected during peak transmission were selected for sequencing. Written informed consent was obtained from the parent or legal guardian of each child and verbal assent was obtained from all children aged six and older. This study was approved by the institutional review boards at the University of California, Berkeley and the Nicaraguan Ministry of Health.
Sample preparation and sequencing
Total RNA was extracted from primary swabs. Multi-segment PCR for the random amplification and barcoding of each individual sample (Zhou et al., 2009; Zhou et al., 2012) was used to amplify influenza-specific segments, followed by SISPA (Djikeng et al., 2009). Each sample was amplified twice using different barcodes to control for barcode-specific bias in the amplification process, and pooled for sequencing using HiSeq2000 (Illumina) and/or 454 (Roche) platforms. All data sequenced for this study was submitted to the Influenza Virus Resource at NCBI’s GenBank (Bao et al., 2008), and accession numbers are available in Table S4.
Phylogenetic analysis
The evolutionary relationships between the influenza viruses collected in Managua and the diversity of influenza viruses circulating in the Americas and globally were studied for six influenza viral lineages that circulated in Managua during 2007–2010: A/H3N2 (2007), seasonal A/H1N1 (2008), pandemic A/H1N1 (2009), A/H3N2 (2010), B/Yamagata (2008), and B/Victoria (2010). As whole-genome sequence data for influenza viruses is extremely limited in Latin American countries, we used sequence data from either the full-length hemagglutinin (HA) (1695 nt) or in some cases the partial HA1 region (987 nt) in order to maximize the number of background sequences included in this study. All sequence data was downloaded from the EpiFlu database of the Global Initiative on Sharing All Influenza Data (GISAID) (http://platform.gisaid.org/), which currently has more sequences available from across the Americas than GenBank (Table S5). To mitigate the effect of sample bias, viruses from North America, South America, and globally were subsampled randomly to have even numbers for each lineage by year. However, too few viruses were available from Central America to avert the under-representation of the region.
Nucleotide sequence alignments for each of the six data sets were generated using MUSCLE v3.8.31 (Edgar et al., 2004), with manual correction using Se-Al v2.0 (Rambaut et al., 2002): 356 HA1 sequences from A/H3N2 viruses collected September 2006 – December 2007, 186 full-length HA sequences from seasonal A/H1N1 collected September 2007 – December 2008, 236 HA1 sequences from B/Yamagata viruses collected in 2008, 592 HA sequences from pandemic A/H1N1 viruses collected in 2009, 379 HA sequences from A/H3N2 viruses collected September 2009 – December 2010, and 207 HA sequences from B/Victoria viruses collected in 2010 (Table S1). Each viral sequence was categorized into one of five discrete regions in the Americas that were well sampled in our data: North America, Central America, South America, Globally (not from the Americas), and Managua, Nicaragua. Following the intensification of influenza virus surveillance during the 2009 A/H1N1 pandemic and the increased availability of viral sequence data from Mexico and the Caribbean, these two discrete localities were added in 2009 and 2010.
Bayesian analysis
Posterior distributions under the Bayesian phylogeographic model (Lemey et al., 2009b) were estimated using a Markov chain Monte Carlo (MCMC) method implemented in the BEAST package (v1.8) (Drummond et al., 2012), incorporating the date of sampling, and using BEAGLE (Suchard et al., 2009) to improve computational performance. For viruses where only the year of sampling was available on GISAID, the lack of tip date precision was accommodated by sampling uniformly across a one-year window of time from January 1st to December 31st. Given the short evolutionary time span of each data set (less than 1.5 years), we employed a simple evolutionary model including a strict molecular clock, the HKY85 + Γ4 model of nucleotide substitution, and a flexible demographic model (Bayesian skyline). For each of the six data sets, the MCMC chain was run three times for at least 150 million iterations, with subsampling every 15,000 iterations. All parameters reached convergence, as visually assessed in Tracer (v1.5), and the three runs were combined using LogCombiner (v1.8) and subsampled further to generate final outputs of 10,000 total trees for each data set. Ten percent of the chain was then removed as burn-in, and maximum clade credibility (MCC) trees were summarized using TreeAnnotator (v.1.8). The expected number of location state transitions conditional on the observed data was obtained using ‘Markov jump’ counts (Minin et al., 2008), again implemented in BEAGLE, and summarized per branch and for the complete evolutionary history. Markov jump counts provided a quantitative measure of gene flow between regions, representing successful viral introductions. An example of the XML file created in BEAUTi v1.8.0 and edited by hand to estimate Markov jump counts is provided for the 2007 A/H3N2 epidemic in Text S1.
Spatial analysis of the 2010 A/H3N2 epidemic in Managua
The 2010 A/H3N2 epidemic was dominated by a single A/H3N2 viral lineage in Managua, as evidenced by 70 of the 72 Managua viruses sampled in our study belonging to a single clade, and therefore provided the best opportunity to study the fine-scale spatial dissemination of a single viral lineage within Managua. The city of Managua is spatially divided into seven districts that are each composed of neighborhoods referred to as ‘barrios’. Within District II, we further clustered these barrios into six spatially defined groups (G1–G6) based on geography and SES characteristics, which we incorporated as discrete location states into our Bayesian inference of viral diffusion. To increase phylogenetic resolution, we concatenated the whole-genome sequences for the 69 viruses belonging to the dominant A/H3N2 lineage in Managua in 2010, following phylogenetic determination that none of these 69 viruses were reassortants (data available upon request). Posterior distributions were estimated using the MCMC method implemented in the BEAST package (v1.8), as described above. In this case of a defined outbreak, we also performed a Bayes factor (BF) comparison using marginal likelihoods to explore whether a demographic model of exponential population growth provided a better fit than the Bayesian skyline model. However, the Bayesian skyline model was again preferred, and it is possible that our sampling scheme may have missed the very early stage of the epidemic when exponential growth may have occurred. Measures of the extent of geographic structure across the distribution of 9,000 sampled trees (after 10% burn-in was removed) were determined separately for barrio and barrio cluster using the parsimony score (PS) and association index (AI) tests available in the Bayesian Tip-association Significance testing (BaTS) program (Parker et al., 2008).
Supplementary Material
Time-scaled Bayesian MCC tree of the HA1 sequences of viruses collected from our study site in Managua, Nicaragua (n = 25), as well as background viruses from South America, Central America, the Caribbean, North America, Mexico, and globally (n = 211). Labels and shading of branches is identical to Fig. 1, with the additional labeling of the two lineages of B/Yamagata viruses that circulated in Managua (see Fig. 6).
Time-scaled Bayesian MCC tree of the HA sequences of viruses collected from our study site in Managua, Nicaragua (n = 36), as well as background viruses from South America, Central America, the Caribbean, North America, Mexico, and globally (n = 171). Labels and shading of branches is identical to Fig. 1.
Time-scaled Bayesian MCC tree of the concatenated whole-genome sequences of 69 A/H3N2 viruses collected from our study site in Managua, Nicaragua that represent a single viral introduction (see Fig. 4). Branches and tip labels are shaded according to the six clusters of barrios defined in our study that are located within District 2, as well as a separate category for viruses collected outside of these barrios. Posterior probabilities > 0.80 are included for key nodes, and nodes defining the three pairs of intra-cluster transmission are indicated with an asterisk (*).
Highlights.
Influenza virus epidemics in Managua, Nicaragua, are genetically diverse.
North America is a key source of influenza viruses introduced into Managua each year.
The heterogeneous climates of Central America complicate regional flu dynamics.
Acknowledgments
We thank the study team of the Nicaraguan Influenza Cohort Study in the Centro de Salud Sócrates Flores Vivas, and the Laboratorio Nacional de Virología at the Centro Nacional de Diagnóstico y Referencia of the Nicaraguan Ministry of Health, as well as the Sustainable Sciences Institute (SSI). We are also grateful to the study participants and their families. We thank Cécile Viboud of Fogarty International Center, NIH, for her thoughtful inputs. This work was supported in part by the Multinational Influenza Seasonal Mortality Study (MISMS), an ongoing international collaborative effort to understand influenza epidemiology and evolution, led by the Fogarty International Center, NIH, with funding from the Office of Global Affairs at the Department of Health and Human Services (DHHS) [MIN] and by the National Institute of Allergy and Infectious Diseases, National Institutes of Health grant number U01 AI088654 (EH, AG) and the Fogarty International Center, National Institutes of Health [grant number K02 TW009483 (AG). This project has also been funded in part with federal funds from the National Institute of Allergy and Infectious Diseases, National Institutes of Health, Department of Health and Human Services under the contract number HHSN272200900007C.
Footnotes
Accession numbers: All nucleotide sequence data generated for this study have been deposited in GenBank, and accession numbers are available in Table S4.
Publisher's Disclaimer: This is a PDF file of an unedited manuscript that has been accepted for publication. As a service to our customers we are providing this early version of the manuscript. The manuscript will undergo copyediting, typesetting, and review of the resulting proof before it is published in its final citable form. Please note that during the production process errors may be discovered which could affect the content, and all legal disclaimers that apply to the journal pertain.
References
- 1.Anonymous. [Accessed February 23, 2014];World Health Organization’s FluNet database. Available at http://www.who.int/influenza/gisrs_laboratory/flunet/en/
- 2.Anonymous. [Accessed February 23, 2014];Centers for Disease Control and Prevention Past Weekly Surveillance Reports for Influenza. Available at http://www.cdc.gov/flu/weekly/pastreports.htm.
- 3.Bao Y, Bolotov P, Dernovoy D, Kiryutin B, Zaslavsky L, Tatusova T, Ostell J, Lipman D. The influenza virus resource at the National Center for Biotechnology Information. J Virol. 2008;82:596–601. doi: 10.1128/JVI.02005-07. [DOI] [PMC free article] [PubMed] [Google Scholar]
- 4.Bahl J, Nelson MI, Chan KH, Chen R, Vijaykrishna D, Halpin RA, Stockwell TB, Lin X, Wentworth DE, Ghedin E, et al. Temporally structured metapopulation dynamics and persistence of influenza A H3N2 virus in humans. Proc Natl Acad Sci USA. 2011;108:19359–19364. doi: 10.1073/pnas.1109314108. [DOI] [PMC free article] [PubMed] [Google Scholar]
- 5.Bedford T, Cobey S, Beerli P, Pascual M. Global migration dynamics underlie evolution and persistence of human influenza A (H3N2) PLoS Pathog. 2010;6:e1000918. doi: 10.1371/journal.ppat.1000918. [DOI] [PMC free article] [PubMed] [Google Scholar]
- 6.Brockmann D, Helbing D. The hidden geometry of complex, network-driven contagion phenomena. Science. 2013;342:1337–1342. doi: 10.1126/science.1245200. [DOI] [PubMed] [Google Scholar]
- 7.Chowell G, Echevarría-Zuno S, Viboud C, Simonsen L, Tamerius J, Miller MA, Borja-Aburto VH. Characterizing the epidemiology of the 2009 influenza A/H1N1 pandemic in Mexico. PLoS Med. 2011;8:e1000436. doi: 10.1371/journal.pmed.1000436. [DOI] [PMC free article] [PubMed] [Google Scholar]
- 8.de Mello WA, de Paiva TM, Ishida MA, Benega MA, Dos Santos MC, Viboud C, Miller MA, Alonso WJ. The dilemma of influenza vaccine recommendations when applied to the tropics: the Brazilian case examined under alternative scenarios. PLoS One. 2009;4:e5095. doi: 10.1371/journal.pone.0005095. [DOI] [PMC free article] [PubMed] [Google Scholar]
- 9.Djikeng A, Spiro D. Advancing full length genome sequencing for human RNA viral pathogens. Future Virol. 2009;4:47–53. doi: 10.2217/17460794.4.1.47. [DOI] [PMC free article] [PubMed] [Google Scholar]
- 10.Drummond AJ, Suchard MA, Xie D, Rambaut A. Bayesian phylogenetics with BEAUti and the BEAST 1.7. Mol Biol Evol. 2012;29:1969–1973. doi: 10.1093/molbev/mss075. [DOI] [PMC free article] [PubMed] [Google Scholar]
- 11.Edgar RC. MUSCLE: multiple sequence alignment with high accuracy and high throughput. Nucleic Acids Res 2004. 2004;32:1792–1797. doi: 10.1093/nar/gkh340. [DOI] [PMC free article] [PubMed] [Google Scholar]
- 12.Gordon A, Ortega O, Kuan G, Reingold A, Saborio S, Balmaseda A, Harris E. Prevalence and seasonality of influenza-like illness in children, Nicaragua, 2005–2007. Emerg Infect Dis. 2009;5:408–414. doi: 10.3201/eid1503.080238. [DOI] [PMC free article] [PubMed] [Google Scholar]
- 13.Holmes EC, Ghedin E, Halpin RA, Stockwell TB, Zhang XQ, Fleming R, Davey R, Benson CA, Mehta S, Taplitz R, et al. Extensive geographical mixing of 2009 human H1N1 influenza A virus in a single university community. J Virol. 2011;85:6923–6929. doi: 10.1128/JVI.00438-11. [DOI] [PMC free article] [PubMed] [Google Scholar]
- 14.Le MQ, Lam HM, Cuong VD, Lam TT, Halpin RA, Wentworth DE, Hien NT, Thanh le T, Phuong HV, Horby P, et al. Migration and persistence of human influenza A viruses, Vietnam, 2001–2008. Emerg Infect Dis. 2013;19:1756–65. doi: 10.3201/eid1911.130349. [DOI] [PMC free article] [PubMed] [Google Scholar]
- 15.Lemey P, Suchard M, Rambaut A. Reconstructing the initial global spread of a human influenza pandemic: A Bayesian spatial-temporal model for the global spread of H1N1pdm. PLoS Curr. 2009a;1:RRN1031. doi: 10.1371/currents.RRN1031. [DOI] [PMC free article] [PubMed] [Google Scholar]
- 16.Lemey P, Rambaut A, Drummond AJ, Suchard MA. Bayesian phylogeography finds its roots. PLoS Comput Biol. 2009b;5:e1000520. doi: 10.1371/journal.pcbi.1000520. [DOI] [PMC free article] [PubMed] [Google Scholar]
- 17.Lemey P, Rambaut A, Bedford T, Faria N, Bielejec F, Baele G, Russell CA, Smith DJ, Pybus OG, Brockmann D, et al. Unifying Viral Genetics and Human Transportation Data to Predict the Global Transmission Dynamics of Human Influenza H3N2. PLoS Pathog. 2014;10:e1003932. doi: 10.1371/journal.ppat.1003932. [DOI] [PMC free article] [PubMed] [Google Scholar]
- 18.Minin VN, Suchard MA. Counting labeled transitions in continuous-time Markov models of evolution. J Math Biol. 2008;56:391–412. doi: 10.1007/s00285-007-0120-8. [DOI] [PubMed] [Google Scholar]
- 19.Moura FE. Influenza in the tropics. Curr Opin Infect Dis. 2010;23:415–420. doi: 10.1097/QCO.0b013e32833cc955. [DOI] [PubMed] [Google Scholar]
- 20.Nelson MI, Tan Y, Ghedin E, Wentworth DE, St George K, Edelman L, Beck ET, Fan J, Lam TT, et al. Phylogeography of the spring and fall waves of the H1N1/09 pandemic influenza virus in the United States. J Virol. 2011;85:828–834. doi: 10.1128/JVI.01762-10. [DOI] [PMC free article] [PubMed] [Google Scholar]
- 21.Nelson MI, Njouom R, Viboud C, Niang MN, Kadjo H, Ampofo W, Adebayo A, Tarnagda Z, Miller MA, Holmes EC, et al. Multi-year persistence of two pandemic A/H1N1 influenza virus lineages in West Africa. J Infect Dis. 2014 doi: 10.1093/infdis/jiu047. Epub ahead of print Jan 19, 2014. [DOI] [PMC free article] [PubMed] [Google Scholar]
- 22.Parker J, Rambaut A, Pybus OG. Correlating viral phenotypes with phylogeny: accounting for phylogenetic uncertainty. Infect Genet Evol. 2008;8:239–246. doi: 10.1016/j.meegid.2007.08.001. [DOI] [PubMed] [Google Scholar]
- 23.Rambaut A. Sequence alignment editor, version 2.0. 2002 Available: http://tree.bio.ed.ac.uk/software/seal/
- 24.Rambaut A, Pybus OG, Nelson MI, Viboud C, Taubenberger JK, Holmes EC. The genomic and epidemiological dynamics of human influenza A virus. Nature. 2008;453:615–619. doi: 10.1038/nature06945. [DOI] [PMC free article] [PubMed] [Google Scholar]
- 25.Reyes F, Aziz S, Li Y, Macey JF, Winchester B, Garner M, Huston P, King A. Influenza in Canada: 2006–2007 season. Canada Communicable Disease Report. 2008;34:1–25. [PubMed] [Google Scholar]
- 26.Russell CA, Jones TC, Barr IG, Cox NJ, Garten RJ, Gregory V, Gust ID, Hampson AW, Hay AJ, Hurt AC, et al. The global circulation of seasonal influenza A (H3N2) viruses. Science. 2008;320:340–346. doi: 10.1126/science.1154137. [DOI] [PubMed] [Google Scholar]
- 27.Suchard MA, Rambaut A. Many-core algorithms for statistical phylogenetics. Bioinformatics. 2009;25:1370–1376. doi: 10.1093/bioinformatics/btp244. [DOI] [PMC free article] [PubMed] [Google Scholar]
- 28.Viboud C, Alonso WJ, Simonsen L. Influenza in tropical regions. PLoS Med. 2006;3:e89. doi: 10.1371/journal.pmed.0030089. [DOI] [PMC free article] [PubMed] [Google Scholar]
- 29.Yu H, Alonso WJ, Feng L, Tan Y, Shu Y, Yang W, Viboud C. Characterization of regional influenza seasonality patterns in china and implications for vaccination strategies: spatio-temporal modeling of surveillance data. PLoS Med. 2013;10:e1001552. doi: 10.1371/journal.pmed.1001552. [DOI] [PMC free article] [PubMed] [Google Scholar]
- 30.Zhou B, Donnelly ME, Scholes DT, StGeorge K, Hatta M, Kawaoka Y, Wentworth DE. Single-Reaction Genomic Amplification Accelerates Sequencing and Vaccine Production for Classical and Swine Origin Human Influenza A Viruses. J Virol. 2009;19:10309–10313. doi: 10.1128/JVI.01109-09. [DOI] [PMC free article] [PubMed] [Google Scholar]
- 31.Zhou B, Wentworth DE. Influenza A virus molecular virology techniques. Methods Mol Biol. 2012;865:175–192. doi: 10.1007/978-1-61779-621-0_11. [DOI] [PubMed] [Google Scholar]
Associated Data
This section collects any data citations, data availability statements, or supplementary materials included in this article.
Supplementary Materials
Time-scaled Bayesian MCC tree of the HA1 sequences of viruses collected from our study site in Managua, Nicaragua (n = 25), as well as background viruses from South America, Central America, the Caribbean, North America, Mexico, and globally (n = 211). Labels and shading of branches is identical to Fig. 1, with the additional labeling of the two lineages of B/Yamagata viruses that circulated in Managua (see Fig. 6).
Time-scaled Bayesian MCC tree of the HA sequences of viruses collected from our study site in Managua, Nicaragua (n = 36), as well as background viruses from South America, Central America, the Caribbean, North America, Mexico, and globally (n = 171). Labels and shading of branches is identical to Fig. 1.
Time-scaled Bayesian MCC tree of the concatenated whole-genome sequences of 69 A/H3N2 viruses collected from our study site in Managua, Nicaragua that represent a single viral introduction (see Fig. 4). Branches and tip labels are shaded according to the six clusters of barrios defined in our study that are located within District 2, as well as a separate category for viruses collected outside of these barrios. Posterior probabilities > 0.80 are included for key nodes, and nodes defining the three pairs of intra-cluster transmission are indicated with an asterisk (*).